the Creative Commons Attribution 4.0 License.
the Creative Commons Attribution 4.0 License.
 | 12 Jan 2018
Detecting the permafrost carbon feedback: talik formation and increased cold-season respiration as precursors to sink-to-source transitions
Nicholas C. Parazoo
Charles D. Koven
David M. Lawrence
Vladimir Romanovsky
Charles E. Miller
Thaw and release of permafrost carbon (C) due to climate change is likely to offset increased vegetation C uptake in northern high-latitude (NHL) terrestrial ecosystems. Models project that this permafrost C feedback may act as a slow leak, in which case detection and attribution of the feedback may be difficult. The formation of talik, a subsurface layer of perennially thawed soil, can accelerate permafrost degradation and soil respiration, ultimately shifting the C balance of permafrost-affected ecosystems from long-term C sinks to long-term C sources. It is imperative to understand and characterize mechanistic links between talik, permafrost thaw, and respiration of deep soil C to detect and quantify the permafrost C feedback. Here, we use the Community Land Model (CLM) version 4.5, a permafrost and biogeochemistry model, in comparison to long-term deep borehole data along North American and Siberian transects, to investigate thaw-driven C sources in NHL (> 55∘ N) from 2000 to 2300. Widespread talik at depth is projected across most of the NHL permafrost region (14 million km2) by 2300, 6.2 million km2 of which is projected to become a long-term C source, emitting 10 Pg C by 2100, 50 Pg C by 2200, and 120 Pg C by 2300, with few signs of slowing. Roughly half of the projected C source region is in predominantly warm sub-Arctic permafrost following talik onset. This region emits only 20 Pg C by 2300, but the CLM4.5 estimate may be biased low by not accounting for deep C in yedoma. Accelerated decomposition of deep soil C following talik onset shifts the ecosystem C balance away from surface dominant processes (photosynthesis and litter respiration), but sink-to-source transition dates are delayed by 20–200 years by high ecosystem productivity, such that talik peaks early (∼ 2050s, although borehole data suggest sooner) and C source transition peaks late (∼ 2150–2200). The remaining C source region in cold northern Arctic permafrost, which shifts to a net source early (late 21st century), emits 5 times more C (95 Pg C) by 2300, and prior to talik formation due to the high decomposition rates of shallow, young C in organic-rich soils coupled with low productivity. Our results provide important clues signaling imminent talik onset and C source transition, including (1) late cold-season (January–February) soil warming at depth (∼ 2 m), (2) increasing cold-season emissions (November–April), and (3) enhanced respiration of deep, old C in warm permafrost and young, shallow C in organic-rich cold permafrost soils. Our results suggest a mosaic of processes that govern carbon source-to-sink transitions at high latitudes and emphasize the urgency of monitoring soil thermal profiles, organic C age and content, cold-season CO2 emissions, and atmospheric 14CO2 as key indicators of the permafrost C feedback.


The future trajectory of the Arctic Boreal Zone (ABZ) as a carbon (C) sink or source is of global importance due to vast quantities of C in permafrost and frozen soils (Belshe, Schuur and Bolker, 2013). Cold and waterlogged conditions in the ABZ have hindered soil organic material (SOM) from microbial decomposition and led to long-term C accumulation at soil depths below 1 m (Ping et al., 2015). Arctic warming, which stimulates plant growth as well as respiration in tundra ecosystems (Mack et al., 2004; Euskirchen et al., 2012; Natali et al., 2012; Barichivich et al., 2013; Commane et al., 2017), has driven a period of C cycle intensification over the last 50 years with greater C inputs and outputs across high-latitude ecosystems (Graven et al., 2013). Expert assessments of site-level observations, inversion studies, and process models suggest that Arctic C balance is near neutral, but large uncertainties allow for solutions ranging from small sources to moderate sinks; however, most assessments favor an overall strengthening of the regional C sink, with productivity gains exceeding respiration losses on average (McGuire et al., 2012).
The effect of continued warming on future northern high-latitude (NHL) ecosystem C balance is uncertain but appears to be increasingly dependent on responses to changes in cold-season emissions, soil moisture, shifts in vegetation community, and permafrost degradation (Abbott et al., 2016). These vulnerabilities are likely driven by disproportionate warming during the cold season (Fraser et al., 2014), which is projected to increase at twice the rate of summer warming over the next century (Christensen et al., 2013). For example, winter warming during the long cold season promotes increased soil respiration, offsetting C uptake during the short Arctic growing season (Oechel et al., 2014; Euskirchen et al., 2016; Commane et al., 2017), and shifting tundra ecosystems from C sink to source (Webb et al., 2016). Winter warming also promotes earlier and more rapid snow melt and landscape thawing (Goulden, 1998; Schuur et al., 2015). This can impact seasonal C balance through increased hydrological export of SOM by Arctic rivers (Olefeldt and Roulet, 2014), which is projected to increase by 75 % by end of century (Abbott et al., 2016). Early snow melt can also cause increased exposure of the land surface to solar absorption (Lawrence et al., 2012), resulting in increased evapotranspiration and summer drought risk (Zhang et al., 2011), which decreases terrestrial biomass through reduced plant growth and increased intensity and frequency of boreal fire emissions and fire disturbance (Yi et al., 2014; Veravebeke et al., 2017). ABZ fire-driven C losses are expected to increase 4-fold by 2100 (Abbott et al., 2016).
On longer timescales, permafrost degradation and resulting C losses from deep, old C is expected to be the dominant factor affecting future Arctic C balance (McGuire et al., 2012; Lawrence et al., 2015; Schuur et al., 2015). In addition to these effects, warmer temperatures and longer non-frozen seasons caused by earlier spring thaw and later autumn freezing can promote accelerated deepening and increased duration of the active layer (layer of soil near the surface which is unfrozen in summer and frozen in winter) and thawing permafrost. More abrupt processes such as thermokarst lake initialization can also lead to rapid thaw through pronounced sub-lake talik formation (Jorgenson and Osterkamp, 2005). These processes can initiate formation of a talik zone (perennially thawed subsurface soils) during active layer adjustment to new thermal regimes (Jorgenson et al., 2010) in lake and non-lake environments. Talik as well as longer, deeper active layer thaw stimulate respiration of soil C (Romanovsky and Osterkamp, 2000; Lawrence et al., 2008), making the ∼ 1035 Pg soil organic carbon in near surface permafrost (0–3 m) and ∼ 350 Pg soil organic carbon in deep permafrost (> 3 m) vulnerable to decomposition (Hugelius et al., 2014; Jackson et al., 2017).
Climate models used in the Coupled Model Intercomparison Project Phase 5 (CMIP5) consistently project widespread loss of permafrost in the future due to climate warming (Slater and Lawrence, 2013), though the earth system models that participated in the CMIP5 also project NHL terrestrial C uptake rather than losses due to warming (Ciais et al., 2013). This projection conflicts with expectations from field studies (Schuur et al., 2009; Natali et al., 2014), but newer approaches, such as explicitly representing the vertical structure of soil respiration and its coupling to deep soil thermal changes, lead to changes in the model-projected response from a net C gain with warming to a net loss and hence a positive carbon–climate feedback (Koven et al., 2011).
Permafrost C emissions are likely to occur gradually over decades to centuries and therefore are unlikely to cause abrupt and easily detected signals in the global C cycle or climate (Schuur et al., 2015). We use the coupled permafrost and biogeochemistry Community Land Model version 4.5 (CLM4.5) to investigate in detail the subsurface thermal processes driving C emissions from shallow (0–3 m) and deep (> 3 m) permafrost C stocks and to project the rate of NHL permafrost C feedbacks (> 55∘ N) over the 21st century. Using CLM4.5 in the framework of an observing system simulation experiment (Parazoo et al., 2016), we ask how we might be able to (1) identify potential thresholds in soil thaw, (2) detect the specific changes in soil thermal regimes that lead to changes in ecosystem C balance, and (3) project future C sources following talik onset. We hypothesize that talik formation in permafrost triggers accelerated respiration of deep soil C and, ultimately, NHL ecosystem transition to long-term C sources.
Comparison to observed thaw at selected tundra and forested ecosystems along north–south transects in Siberia and North America in the 20th and early 21st century provides a reference to evaluate historical thaw patterns and projected thaw rates. The remainder of our paper is organized as follows: Sect. 2.1 describes our methods to simulate and analyze soil thaw and C balance in CLM4.5; Sect. 2.2 describes borehole datasets used to analyze CLM4.5 soil thermal regime; Sect. 3.1 presents results of talik formation in CLM4.5 and comparison of simulated thaw profiles to borehole data in North America; Sect. 3.2 evaluates projected thaw rates against long-term borehole data in Siberia; Sect. 3.3 identifies timing and location of C source onset and discusses formation mechanisms in the presence and absence of talik; Sect. 4 discusses the main findings.
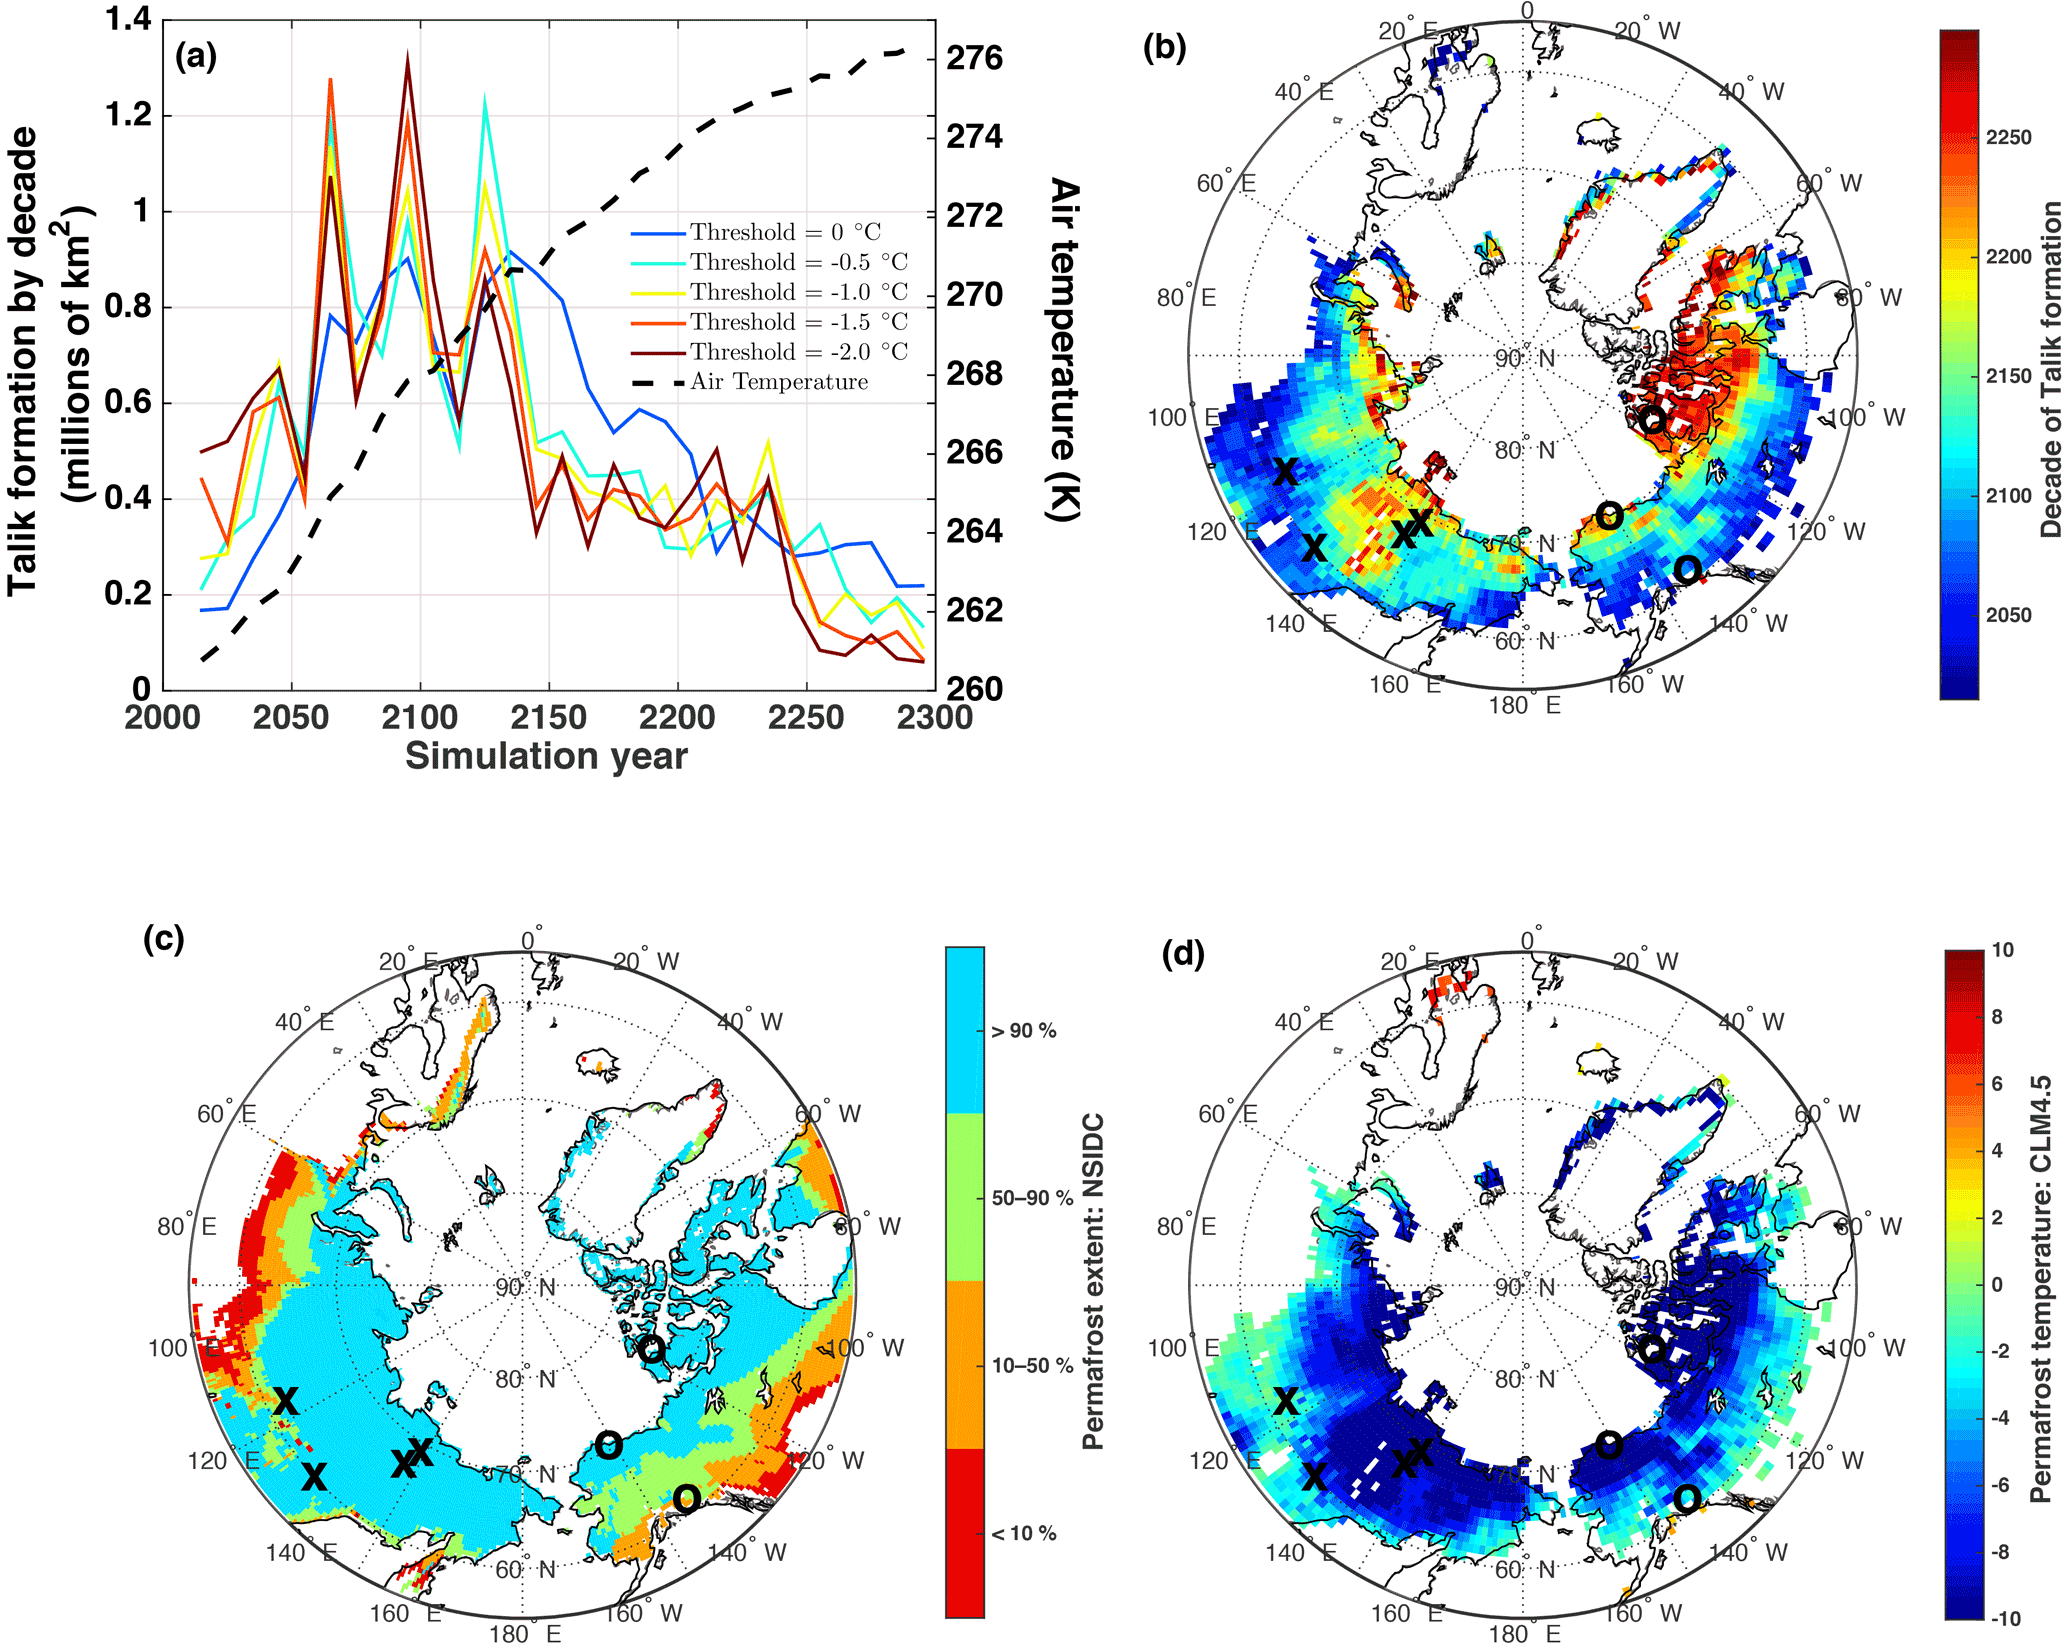
Figure 1Decade of projected talik formation and correlation to initial state of simulated permafrost temperature and observed permafrost extent. (a) Time series and (b) map of the simulated decade of talik formation are estimated from CLM4.5 as the first decade when the mean temperature of a soil layer exceeds a freeze–thaw threshold of −0.5 ∘C in every month. Additional colors in panel (a) represent progression of talik onset for different freeze–thaw thresholds. (c) Initial permafrost temperature is defined as the annual mean soil temperature at 3 m depth from 2006 to 2010. (d) Permafrost extent is taken from https://nsidc.org/data/docs/fgdc/ggd318_map_circumarctic/ (Brown et al., 2001). Crosses in panel (a, c, d) represent locations of Siberian borehole measurements along the East Siberian Transect from 1955 to 1900 (Table 1). Circles represent locations of borehole measurements in Alaska and Canada from 2002 to 2013 (Table 2). Dashed black line in panel (a) shows projected air temperature over the talik region. These results assume a Representative Pathway 8.5 warming scenario through 2100 and an Extended Concentration Pathway 8.5 through 2300. We note that peak talik formation occurs around 2100.
2.1 Simulations
CLM4.5 provides an accurate characterization of the physical and hydrological state of permafrost needed to evaluate permafrost vulnerability and identify key processes (Lawrence et al., 2008; Swenson et al., 2012). CLM4.5 includes a basic set of permafrost processes to allow projection of permafrost carbon–climate feedbacks, including snow schemes, vertically resolved SOM dynamics and soil hydrology, coupled hydraulic and thermal properties in frozen and unfrozen soils allowing realistic seasonal evolution of the active layer, and interaction with shallow (0–3 m) and deep (> 3 m) permafrost C (Swenson et al., 2012; Oleson, 2013; Koven et al., 2013, 2015; Lawrence et al., 2008). More abrupt thaw processes affecting permafrost C dynamics and talik formation such as thermokarst or other thaw-related landscape dynamics changes in wetland or lake distribution are not accounted for in CLM4.5 (see Riley et al., 2011, for more discussion).
CLM is spun up to C equilibrium for the year 1850 by repeatedly cycling through 20 years of pre-industrial climate forcing with CO2 and N-deposition set at 1850 levels. C initialization is achieved via slow mixing by cryoturbation between the seasonally thawed active layers and deeper permafrost layers (Koven et al., 2009). Including vertically resolved processes leads to a sign change in the projected high-latitude C response to warming, from net C gains driven by increased vegetation productivity to net C losses from enhanced SOM decomposition (Koven et al., 2011). The soil grid includes 30 vertical levels that have a high-resolution exponential grid in the interval 0–0.5 m and fixed 20 cm layer thickness in the range of 0.5–3.5 m to maintain resolution through the base of the active layer and upper permafrost, and reverts to exponentially increasing layer thickness in the range 3.5–45 m to allow for large thermal inertia at depth. Soil C turnover in CLM4.5 is based on a vertical discretization of first-order multi-pool SOM dynamics (Koven et al., 2013; Oleson, 2013), where decomposition rates as a function of soil depth are controlled by a parameter Zτ (Koven et al., 2015; Lawrence et al., 2015). This depth control of decomposition represents the net impacts of unresolved depth-dependent processes. In this study, we utilize Zτ = 10 m, which yields a weak additional depth dependence of decomposition beyond the environmental controls and, as discussed and evaluated relative to Zτ = 1 m and Zτ = 0.5 m in Koven et al. (2015), results in CLM permafrost-domain soil C stocks that are in closest agreement (1582 Pg for Zτ = 0.5 m, 1331 Pg for Zτ = 1 m, and 1032 Pg for Zτ = 10 m) with observed estimates (1060 Pg C to 3 m depth; Hugelius et al., 2013). This reduction in initial C is due to higher decomposition rates at depth during the model initialization period. There is no C below 3.5 m, so additional thaw below 3 m has a small impact on the C cycle. We note that the relationship applied in CLM4.5, which implies multiplicative impacts of limitations to decomposition, is commonly applied in land biogeochemical models but is quite uncertain.
We use CLM4.5 configured as described in two recent permafrost studies (Lawrence et al., 2015; Koven et al., 2015) using time-varying meteorology, N deposition, CO2 concentration, and land use change to capture physiological (i.e., CO2 fertilization) and climate effects of increasing CO2 over the period 2006–2300. We use an anomaly forcing method to repeatedly force CLM4.5 with observed meteorological from the CRUNCEP dataset for the period 1996–2005 (data available at https://www.earthsystemgrid.org/dataset/ucar.cgd.ccsm4.CRUNCEP.v4.html) and monthly anomalies added based on a single ensemble member from a CCSM4 Representative Concentration Pathway 8.5 (RCP8.5) simulation for the years 2006–2100 and Extended Concentration Pathway 8.5 (ECP8.5) for the years 2100–2300. The period from 1996 to 2015 represents a base climatological period used for calculating monthly anomalies, with a 20-year record chosen to minimize large anomalies in the first few years. This process is repeated for all variables and all times from 2006 to 2300 (constantly cycling through the same 1996–2005 observed data). Land air temperature for the period 2006–2300, shown in Fig. 1a, is projected to increase steadily over our simulation, with a slight decrease in the rate of warming.
We caution that we are using only a single ensemble member from CCSM4, and hence our results represent one realization from one model forced with one climate scenario. This results in uncertainties from the historical climate–weather forcing, the structure and parameterization of the model, and climate scenarios (both across models and across emissions scenarios).
Simulations are carried out on a global domain at a grid resolution of 1.25∘ longitude × 0.9375∘ latitude and saved as monthly averages. Simulation output is collected into decadal averages from 2011 to 2300 (e.g., 2011–2020 averages for the 2010s, 2021–2030 for the 2020s). Our method to link C balance changes to permafrost thermal state relies on identifying the timing of two key processes: (1) talik formation and (2) C source transition. Talik formation represents a critical threshold of permafrost thaw. The C source transition represents a shift of ecosystem C balance from a neutral or weak C sink to a long-term source as C balance shifts to increasing dominance of C source processes including permafrost thaw and fires (Koven, Lawrence and Riley, 2015). Using the hypothesis that talik formation triggers a transition to long-term C sources, we quantify the extent of talik formation and rate of transition to C source once talik has formed in permafrost-affected NHL ecosystems.
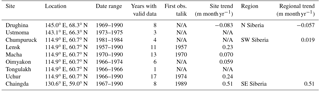
Table 1Site information for long-term borehole temperature measurements along the East Siberian Transect for the period 1957–1990. The nine sites reported in this table, presented in a north-to-south order, meet the criteria of at least 1 year of valid soil temperature data (≥ 10 months per layer, ≥ 55 months across five layers). Talik is observed in four of nine sites, two of which is observed in the first year of valid reported data. Site-specific thaw trends are provided for sites with at least 6 years of valid data. Regional trends are calculated from all available data for three regional locations.
Following Koven et al. (2015), we define the timing of C source transition from net annual sink to net source as the first decade when annual net biome production (NBP) decreases below −25 and remains a source (NBP < 0 ) through 2300. Here, we use the sign convention of NBP < 0 to represent net C flux from land to atmosphere (e.g., source). The timing of talik formation is defined as the first decade when soil temperature (Ts) for any layer between 0 and 40 m exceeds −0.5 ∘C for all months in a calendar year (January–December), assuming that soils start off as permafrost at the beginning of our simulations in 2006. We use a negative freezing point threshold to account for availability of liquid water below 0 ∘C due to freezing point depression. We note that the real threshold temperature at which liquid water remains available varies depending on the soil salinity or mineral content, the latter effect of which is included in the actual respiration calculations used by CLM. Here we use −0.5 ∘C as the freeze–thaw cutoff and examine cutoffs at 0.5 ∘C increments from 0 to −2.0 ∘C.
We introduce the thawed volume–time integral, or “thaw volume”, as a metric to better understand thaw dynamics and help identify thaw instability thresholds. We integrate permafrost in both time (month of year) and depth (soil layer from the surface to 40 m) into a logical function that is one for thawed layers (Ts > −0.5 ∘C), zero for frozen layers, and multiply each thawed layer by layer thickness to convert to units of meter months. This conversion accounts for nonuniform layer thicknesses, providing a consistent metric for comparing simulated and observed thaw.
Our analysis focuses on NHL grid points within the ABZ north of 55∘ N. We analyze talik formation and C source transitions in the context of the simulated initial state of SOM as well as published maps of permafrost conditions from NSIDC (https://nsidc.org/data/docs/fgdc/ggd318_map_circumarctic/) and described in Brown et al. (2001). Permafrost extent is classified as continuous (90–100 %), discontinuous (50–90 %), and sporadic (10–50 %).
2.2 Observations
We compare simulated patterns of active layer dynamics and soil thaw to patterns observed from contemporary and historical borehole measurements of permafrost temperature profiles. We focus on sites in western North America and eastern Siberia with daily continuous observations year-round (January–December) over multiple consecutive years. The primary focus of data in North America (2004–2013) is to evaluate seasonal progression of soil thaw and talik formation near the surface (0–3 m). Siberian data, which have a longer record on average (1950–1994), are used to evaluate long-term trends in soil thaw at 0.0–3.6 m depth. Site locations are shown in Fig. 1.
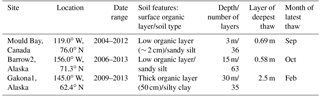
Table 2Site information for borehole temperature measurements at three sites along a north-to-south transect in North America for the period 2004–2012. Climatological soil thermal states presented on a site-to-site basis in Fig. 4 are based on all available valid monthly data for each site, with valid data requiring at least 20 days of reported data for each layer. Layer of Deepest thaw represents the deepest layer in which mean soil temperature exceeds freezing (> −0.5 ∘C) in at least 1 month. Month of latest thaw represents the latest month in which mean soil temperature exceeds freezing. Here, we define May as the earliest possible month and April as the latest possible month.
Siberian data are based on measurements along the East Siberian Transect (EST) (https://arcticdata.io/metacat/metacat/doi:10.5065/D6Z036BQ/default). The EST consists of 13 sites that cover a southwest-to-northeast transect in east Siberia (60.7∘ N, 114.9∘ E to 68.3∘ N, 145∘ E) during the period 1882–1994 (Romanovsky et al., 2007). For this study, we focus on the nine sites which report measurements as monthly averages at regular depths of 0.2, 0.4, 0.8, 1.6, and 3.2 m. Unfortunately, data gaps of years to decades exist on a site-by-site basis, and many years do not report the full annual cycle over multiple layers. To assess observed thaw trends from 1955 to 1990, we analyze individual sites which report at least 10 months yr−1 of reported monthly mean soil temperature at each layer, and 55 months across the 5 layers (out of 60 possible layer months per year). Based on these requirements, we find that six of nine sites yield at least 6 years of data over multiple decades and are well suited for examining historical thaw trends. For comparison of observed trends to historical and projected trends from 1950 to 2300, we analyze clusters of sites by combining the nine sites into three groups based on approximate locations and calculate observed trends using the inter-site average at each location. We use two sites in northern Siberia (67∘ N, 144∘ E), six sites in southwest Siberia (61∘ N, 115∘ E), and one site in southeast Siberia (59∘ N, 131∘ E). Site information is shown in more detail in Table 1.
North American transect data are taken from the global terrestrial network for permafrost (GTNP) borehole database (http://gtnpdatabase.org/boreholes): (1) Borehole 1108 at Mould Bay in Canada (119∘ W, 76∘ N) from 2004 to 2012, (2) Borehole 33 in Barrow along the northern coast of Alaska (156∘ W, 71.3∘ N) from 2006 to 2013; and (3) Borehole 848 in Gakona in southeastern Alaska (145∘ W, 62.39∘ N) from 2009 to 2013. Mould Bay is a continuous permafrost tundra site with measurements at 63 depths from 0–3 m. Mould Bay has almost no organic layer (about 2 cm) and then sandy silt with high thermal conductivity. Barrow is a continuous permafrost tundra site with measurements at 35 depths from 0 to 15 m. The soil at Barrow is represented by silt with a bit of mix with some organics and almost no organic layer on top. Conductivity of the upper layer is ∼ 1 W mK−1 for unfrozen and ≥ 2 W mK−1 for frozen soil. Gakona is a continuous permafrost forest tundra site with measurements at 36 depths from 0 to 30 m. Gakona has a thick organic layer of moss (0 to 5 cm), dead moss (from 5 to 13 cm), and peat (from 13 to 50 cm), then silty clay at depth.
All North American transect datasets are reported as daily averages. For each site, we aggregate from daily to monthly averages requiring at least 20 days month−1 at each layer and for each year. Measurements are reported at multiple depths and high vertical resolution (up to 0.1 m in shallow layers) but are generally nonuniform in depth (multiple layers missing, different layers reported for each site). Given these inconsistencies and records ≤ 8 years, we use these data for qualitative analysis of seasonal and vertical patterns in permafrost thaw. Site information and soil characteristics are summarized in Table 2.
3.1 Simulated talik onset in the 21st century
Our simulations show widespread talik formation throughout Siberia and northern North America over the period 2010–2300 (Fig. 1b), impacting ∼ 14.5 million km2 of land in NHLs (55–80∘ N) assuming a freeze–thaw threshold of −0.5 ∘C and RCP8.5 and ECP8.5 warming scenarios. In Europe, southwest Asia, and North America (below 60∘ N), 10.6 million km2 of land either formed talik prior to the start of our simulation in 2010 in regions already experiencing degraded permafrost (e.g., Fig. 1d, permafrost extent < 90 % in southwest Siberia and southern North America) or did not have permafrost to begin with. A small amount of land along northern coastal regions (∼ 1.6 million km2) shows no talik formation prior to 2300.
The long-term trend and decadal variability of talik formation are quantitatively and qualitatively similar for freeze–thaw thresholds at or below −0.5 ∘C (Fig. 1a). Peak formation generally occurs over the period 2050–2150, accelerating rapidly early in the 21st century, and leveling off in the late 22nd century. The timing and location of talik formation correlates with the annual mean temperature of permafrost at 3 m (Tsoil-3 m) (Fig. 1c) and observed permafrost state (Fig. 1d, from Brown et al., 2001) at the start of our simulation; we see earlier talik formations in sub-Arctic regions (< 66∘ N) with warm simulated permafrost (Tsoil-3 m > 0 ∘C) and permafrost extent less than 90 % and later formation in northern regions with cold permafrost (Tsoil-3 m < 0 ∘C) and continuous permafrost. Talik formation progresses northward from the sub-Arctic to the Arctic over time, starting in the warm, discontinuous permafrost zone in the 21st century then to the cold, continuous permafrost zone the 22nd century. This suggests a shift in permafrost state across the pan-Arctic from continuous to discontinuous over the next 2 centuries.

Figure 2Patterns showing the progression of soil thaw in the decades surrounding talik onset. Individual lines represent averages across the subset of talik-forming regions for each decade from the 2050s (darkest red) to the 2250s (darkest blue). (a) Integrated soil thaw volume, where the vertical solid line represents the mean timing of initial thaw at depth and late into the cold season (January–April). Note that the upper limit to the thaw volume metric in panel (a) is an artifact of the arbitrary maximum soil depth of 45.1 m in CLM4.5. Other panels show (b) date of spring surface thaw in the uppermost layer, (c) annual maximum active layer thickness, and (d) annual subsurface drainage (solid) and volumetric soil moisture averaged over the soil column (dashed). Grey shaded areas show the standard deviation of results for individual talik formation decades. Mean behavior exhibits a characteristic pattern: gradual increase in thaw volume and active layer depth prior to talik onset, abrupt shift in thaw volume, and active layer depth, followed by stabilization to constant thaw volume as soil drying and subsurface drainage increases.
Our simulations demonstrate consistent patterns of changing thaw volume leading up to and following initial talik formation, independent of the decade of talik onset. Time series of thaw volume as a function of decade relative to talik onset (Fig. 2a) show a steady rise in thaw volume of 1–2 m month yr−1 in the decades prior to talik formation, with thaw limited primarily to shallow soils (< 1.5 m) and summer–early fall. Thaw volume accelerates to 10–20 m month yr−1 within 1–4 decades of talik onset, coinciding with thaw penetration at depth (∼ 2 m on average, Fig. 2b) and deeper into the cold season (∼ January–April). Thaw penetration into the January–April period occurs for the first time at 2.6 ± 0.9 decades prior to talik onset (vertical grey lines in Fig. 2a). At talik onset, thaw volume jumps from mean values of 60 ± 10.7 to 377 ± 44 m month yr−1 at a mean depth of 4.1 m. Thaw volume levels out within 1 decade following initial talik formation and accelerated thaw of all soil layers; this leveling is an artifact of the maximum depth of soils in CLM4.5 (equal to 45.1 m) and represents the complete transition from permafrost to seasonally frozen ground in the model. The transition to deep cold-season thaw and rapidly increasing thaw volume represent key threshold signaling imminent talik onset.
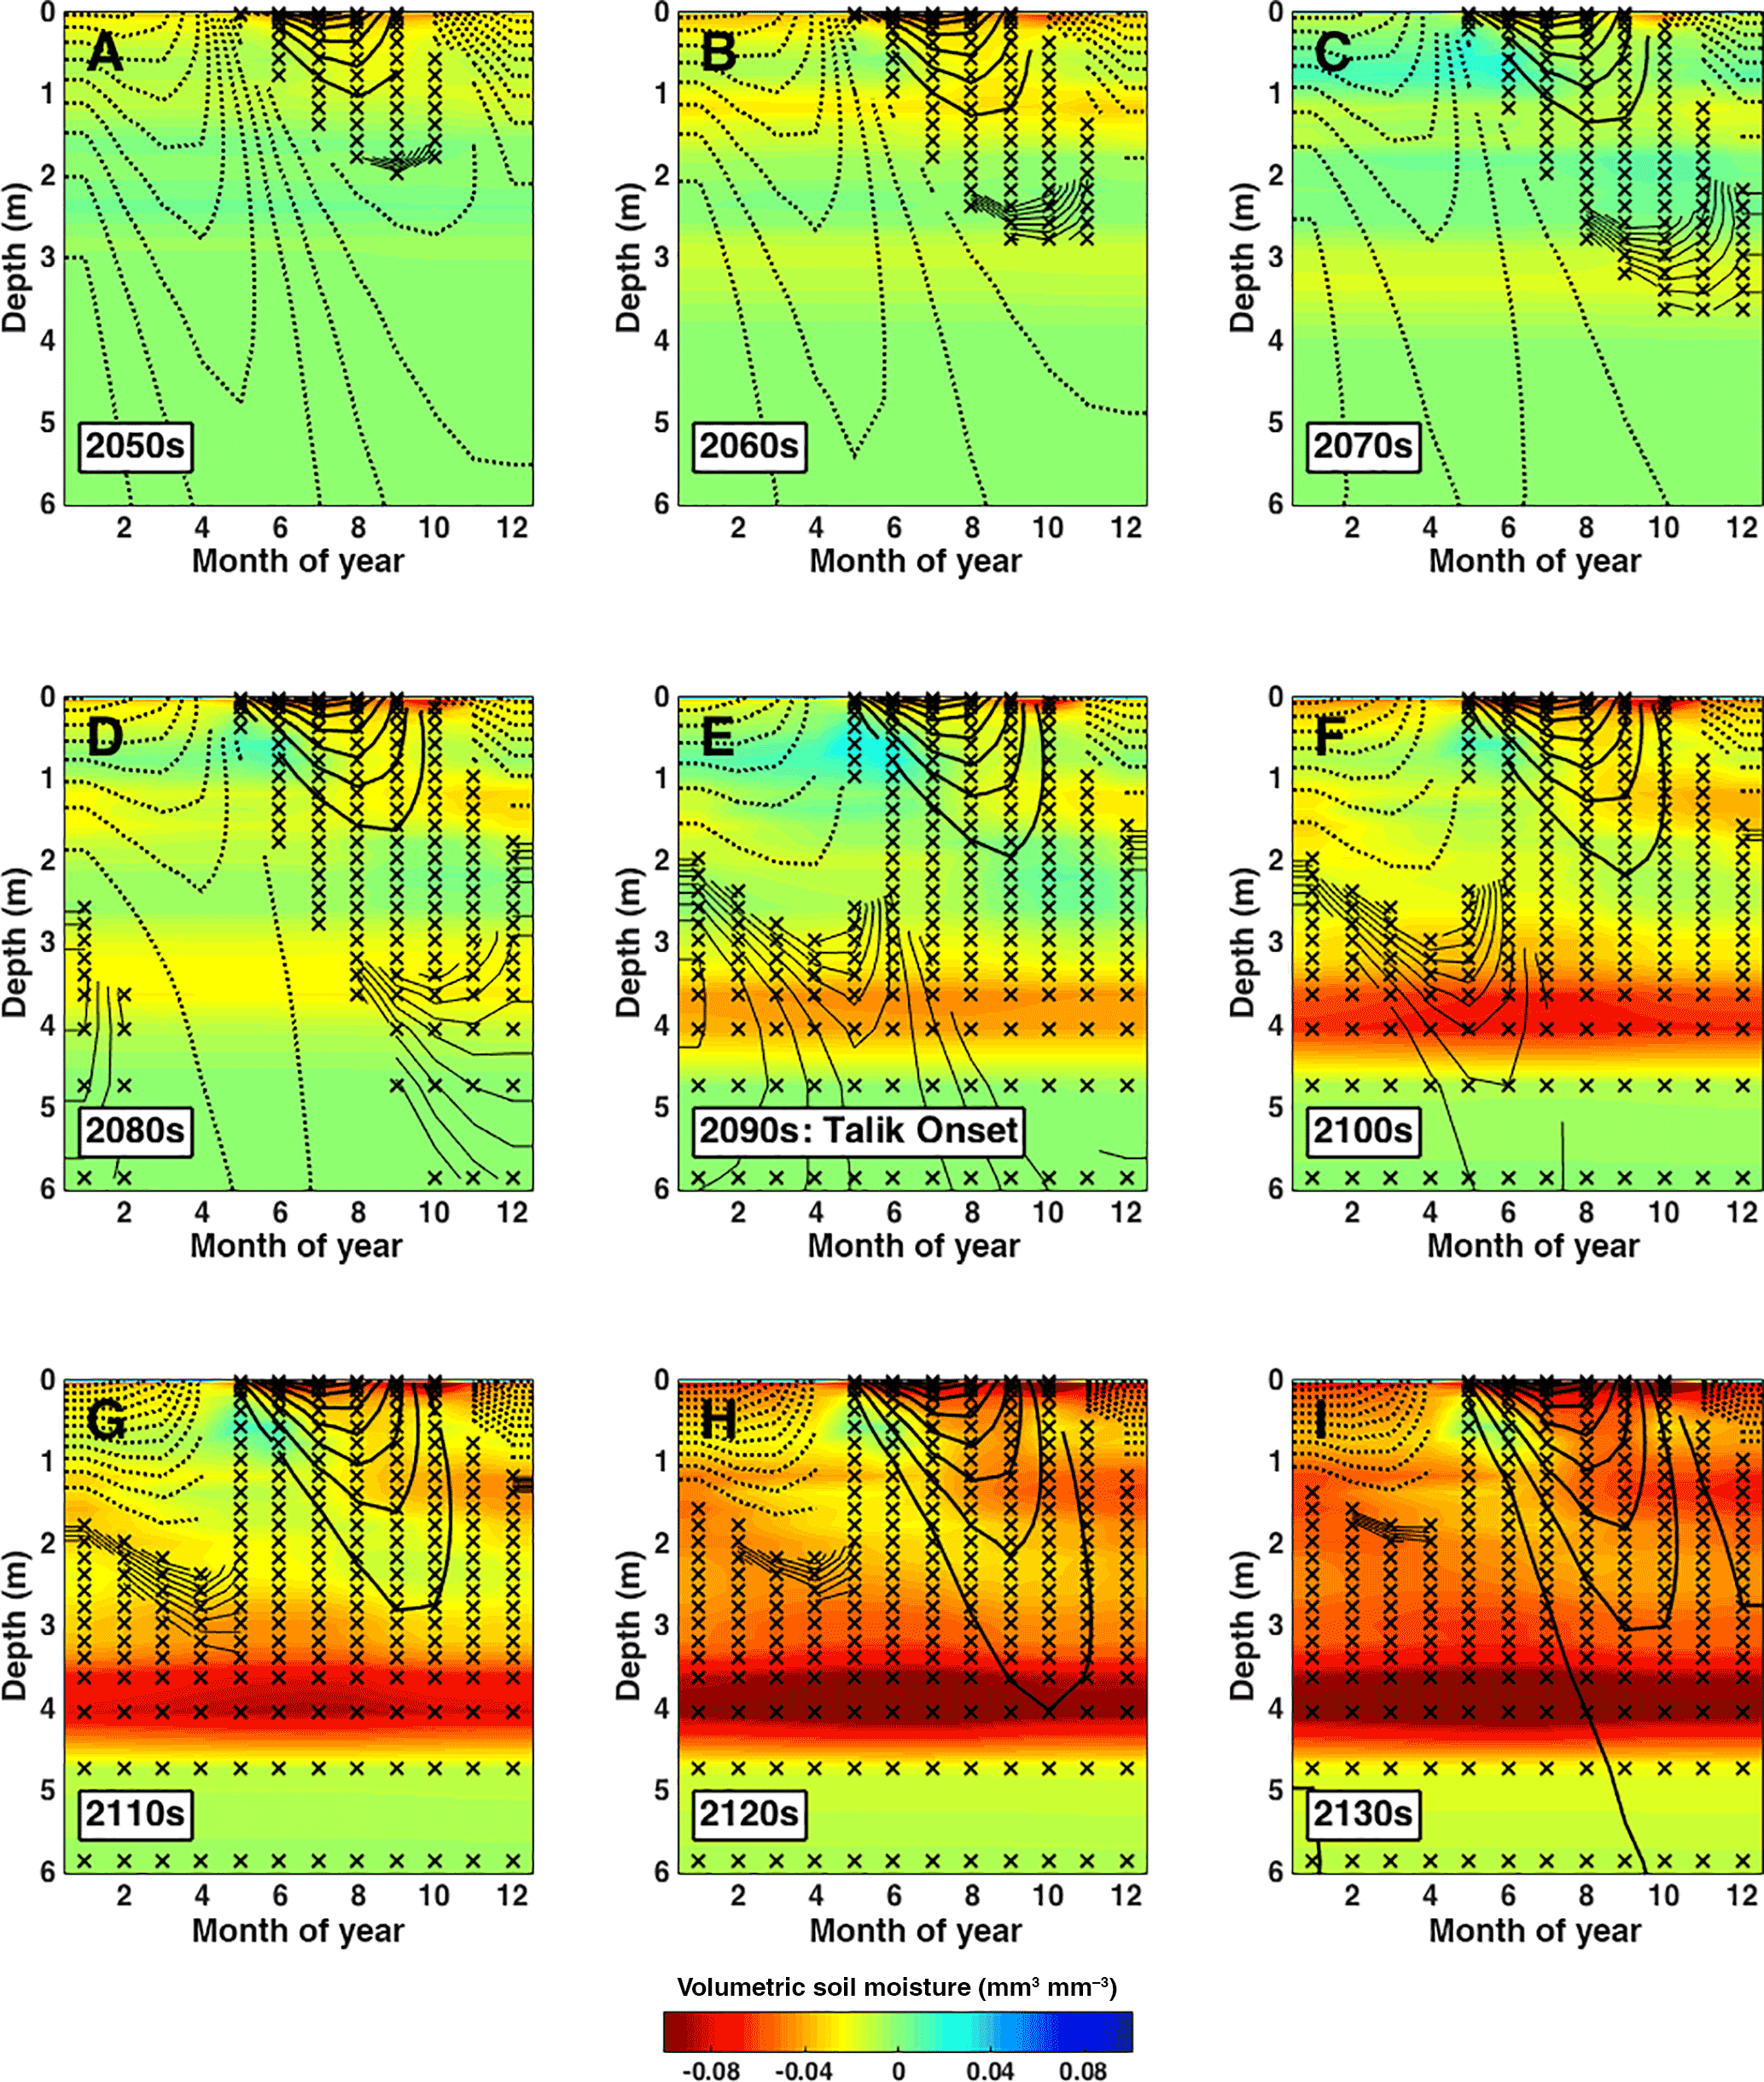
Figure 3Evolution of simulated decadal thermal and hydrological state as functions of month and depth averaged across talik-forming regions in the 2090s. Each panel presents decadal average seasonal profiles in the decades surrounding talik onset from the 2050s (a) to the 2130s (i). Contours are soil temperature in 0.5 ∘C intervals, with solid (dashed) lines denoting temperature above (below) a freeze–thaw threshold of −0.5 ∘C. Stars indicate “thaw” months where soil temperature exceeds −0.5 ∘C. Color shading is volumetric soil moisture anomalies relative to the 2040s, where red indicates drying. Note that soil depth on the y axis is plotted on a nonlinear scale. The soil thaw profile exhibits a shift from predominantly frozen and wet to perpetually thawed and drying conditions at depth while remaining seasonally frozen near the surface.
Onset of surface thaw in the uppermost soils during the spring freeze–thaw transition provides another reliable predictor for talik onset. In particular, we find consistent dates and trends of spring thaw in the surface soil layer in the decades leading up to talik onset (Fig. 2c), shifting by about 1 week over 4 decades from day of year (DOY) 134 ± 2.8 (∼ mid-May) to DOY 127 ± 3.5 during talik formation (∼ early May).
Changes in total column soil water and subsurface drainage following talik onset may provide clues a posteriori that talik is already present. Lawrence et al. (2015) show that deepening of the active layer and thawing of permafrost allows water to drain deeper into the soil column, which dries out near surface soils. Our simulations show a similar, but very slight, drying pattern in shallow layers in the 4 decades prior to talik onset (1.3 % loss of soil moisture over 0–1 m depth; Fig. 2d), accounting for about half of total water storage loss in the column. More significant changes in water balance occur following talik onset, including more rapid drying in shallow layers (∼ 10 % over 4 decades) and in the column (∼ 16 %), and a substantial increase in subsurface drainage, as discussed below.
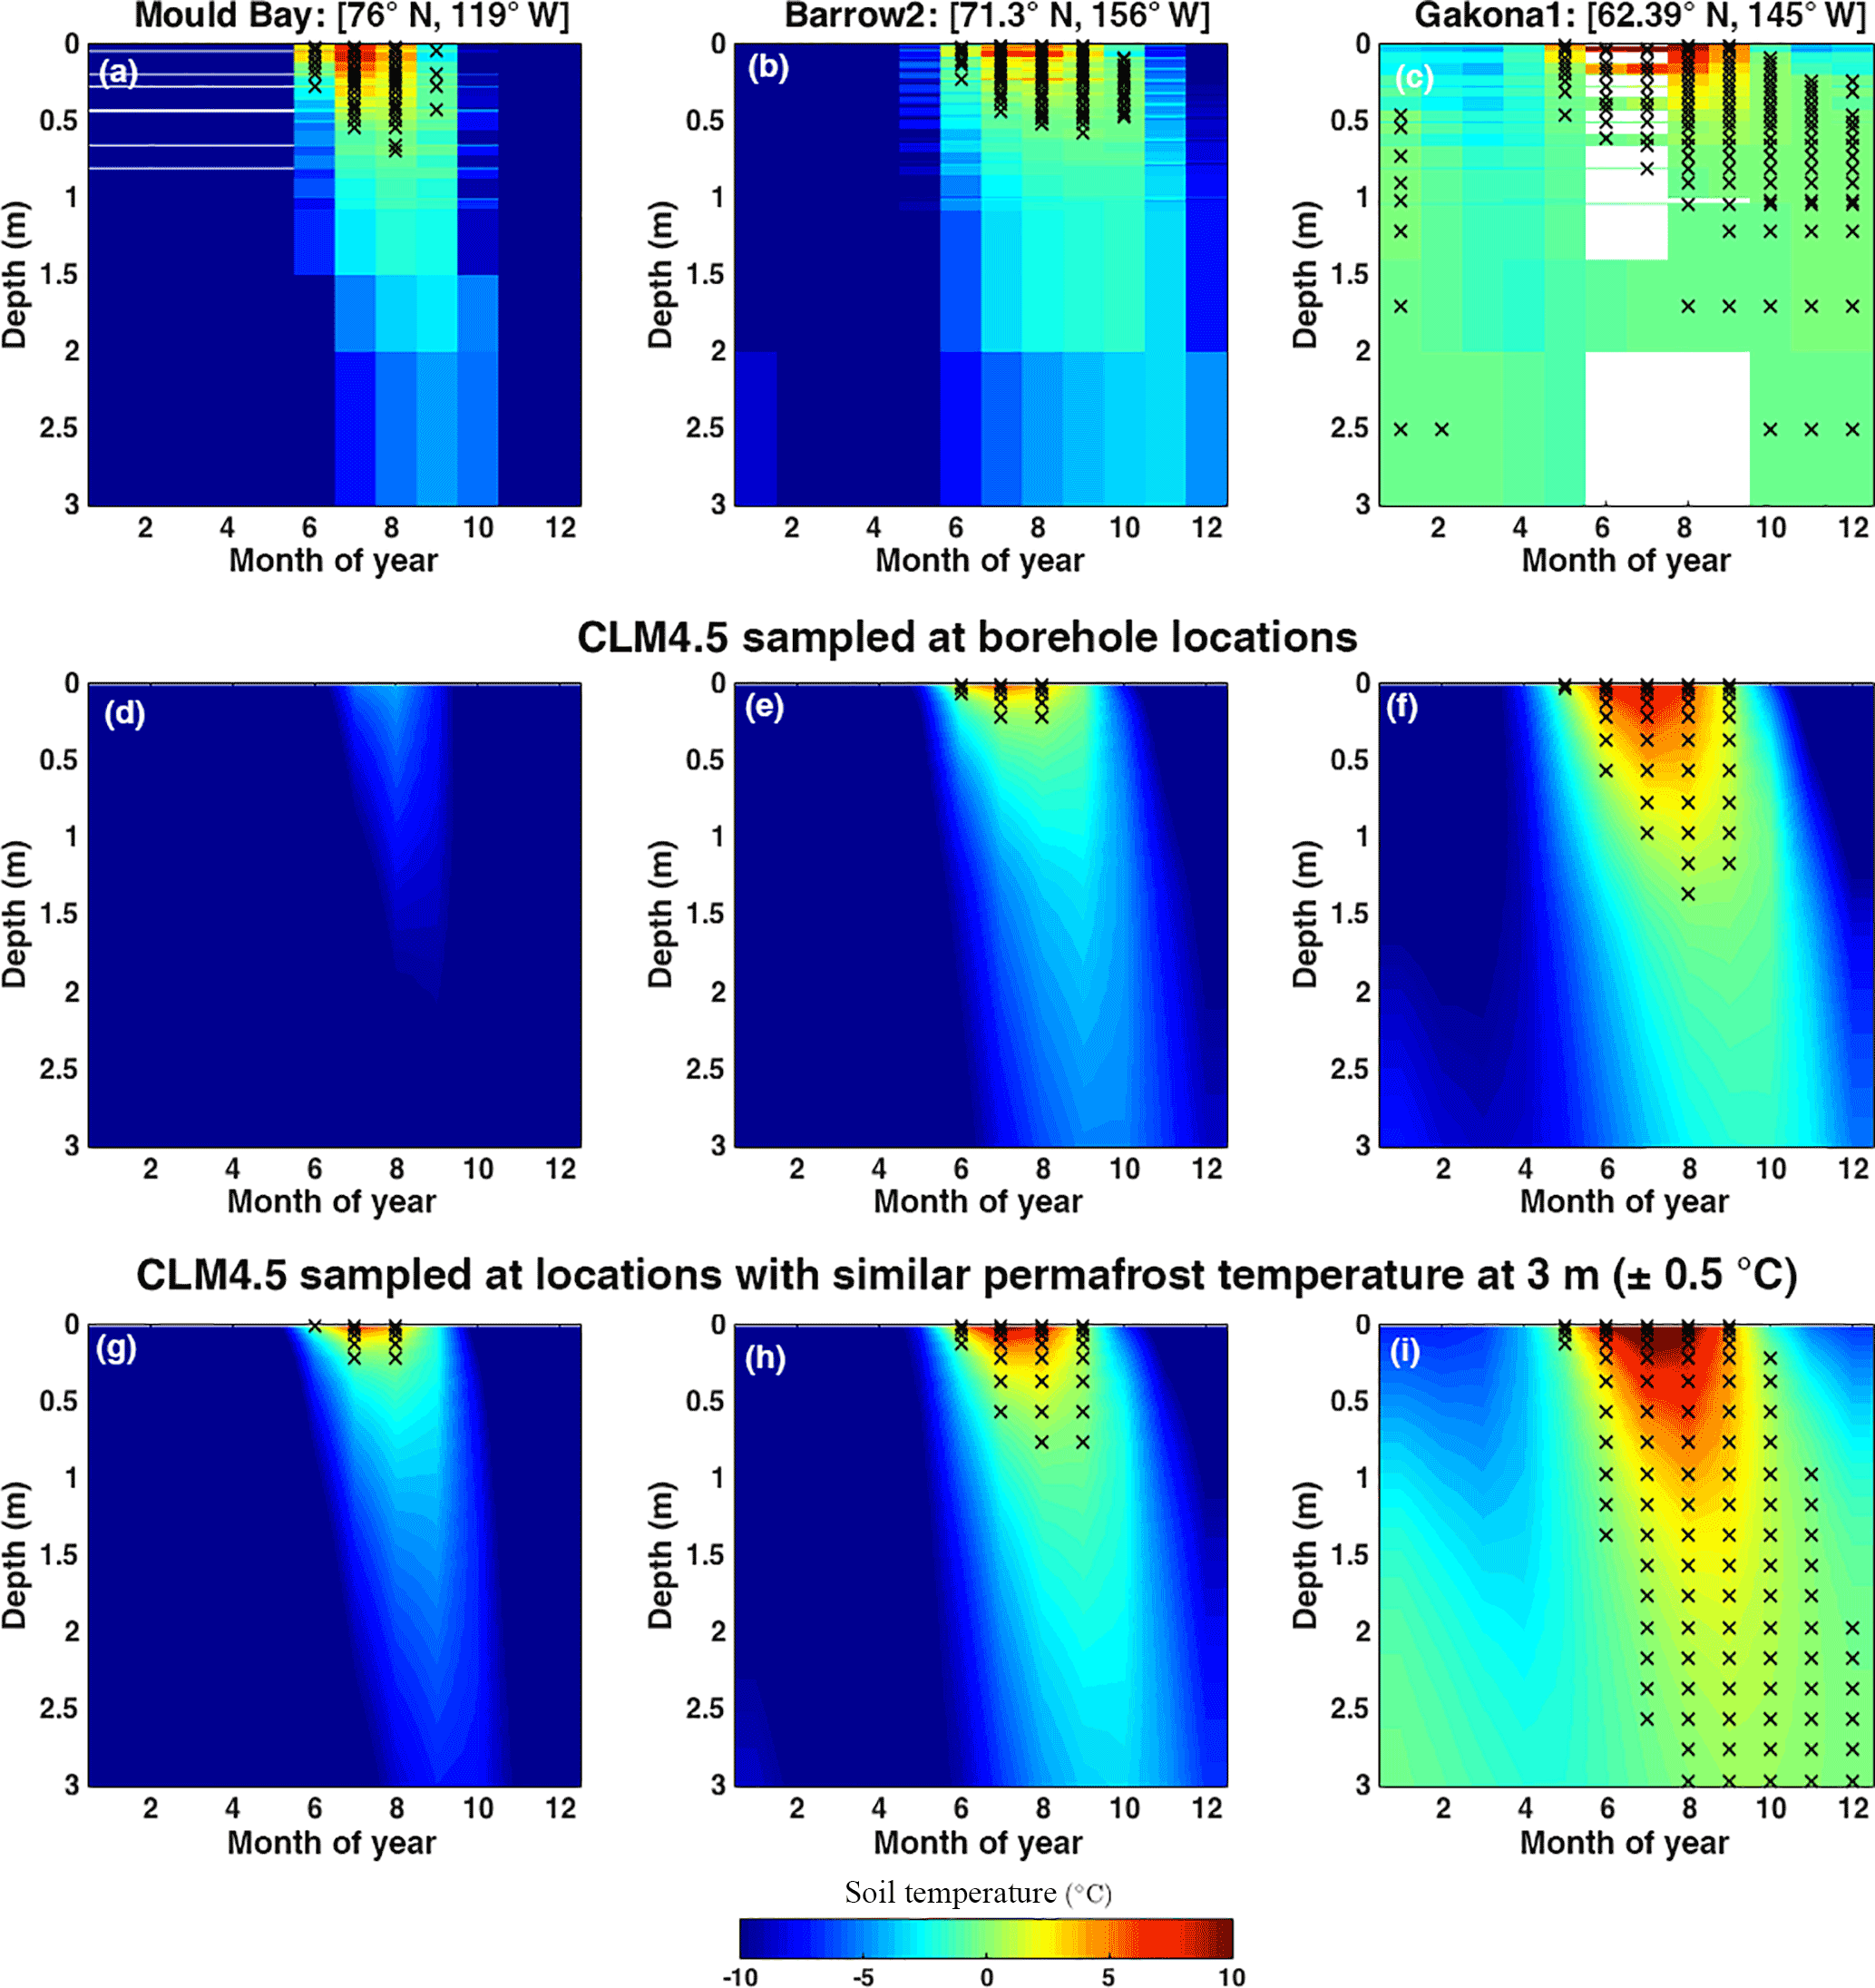
Figure 4Observed and simulated early 21st century soil thermal state as a function of month and depth for the North American Transect boreholes (black circles, Fig. 1). (a–c) Observed multi-year means for Mould Bay, Canada (2004–2012), Barrow, Alaska (2006–2013), and Gakona, Alaska (2009–2013). The color scale shows the mean temperature and the stars mark the months when each layer is thawed (T > −0.5 ∘C). Simulated soil thermal state from 2006 to 2010 for borehole locations (d–f) and regions with 3 m permafrost temperature within 0.5 ∘C of observed (g–i) show similar north-to-south spatial gradient to observations, especially for similar permafrost temperature. Note that the thaw state at Gakona, Alaska, persists at depths of 1–3 m into the deep cold season (January–February), perhaps signaling the threshold for rapid talik formation (see Fig. 3d).
The time evolution of soil vertical thermal and hydrological structure for the subset of grid cells that form talik in the 2090s is shown in more detail in Fig. 3. Here, we have subtracted the thermal and hydrological profiles in the 2040s to show relative change. The 4 decades prior to talik onset are shown in Fig. 3a–d (2050s–2080s), the decade of talik onset in Fig. 3e (2090s), and the 4 decades following talik onset in Fig. 3f–i (2100s–2130s). CLM4.5 represents the process of soil thawing as passage of a “thaw front” in space and time through soil layers, penetrating and warming colder, deeper layers, and bringing the frozen soil environment at depth closer to thermodynamic equilibrium with the warming atmosphere. At 4 decades prior to talik onset (Fig. 3a), our simulated thawed layer exhibits a tilted time–depth profile with earlier thaw and longer thaw duration (∼ 4–5 months) in the near surface (< 1 m) compared to later thaw and reduced thaw duration (1–2 months) at maximum thaw depth (∼ 2 m). In the 3 decades leading up to talik onset, we find gradual deepening of the thawed layer to 3–4 m and penetration of thaw period into January–February.
Our simulations indicate an increased rate of heat transfer and thawing at depth following talik onset, leading to rapid subsequent thawing, drying, and decrease in the thickness of the seasonally frozen layer above talik (Fig. 3e–i). This rapid thawing is depicted in Fig. 2a as the large jump in thaw volume, and in Fig. 2d as enhanced drying and drainage, with drying peaking at 3.5–4.5 m depth. In our simulations, talik onset effectively pulls the “bath plug” that was the ice-filled pore space at depth, with year-round ice-free conditions allowing soil water to percolate and be diverted to subsurface drainage (Lawrence et al., 2015). We note that bedrock soil is not hydrologically active in CLM4.5, and thus the rate of thawing and drainage in response to permafrost thaw may be overestimated in deeper CLM4.5 layers near bedrock due to reduced heat capacity.
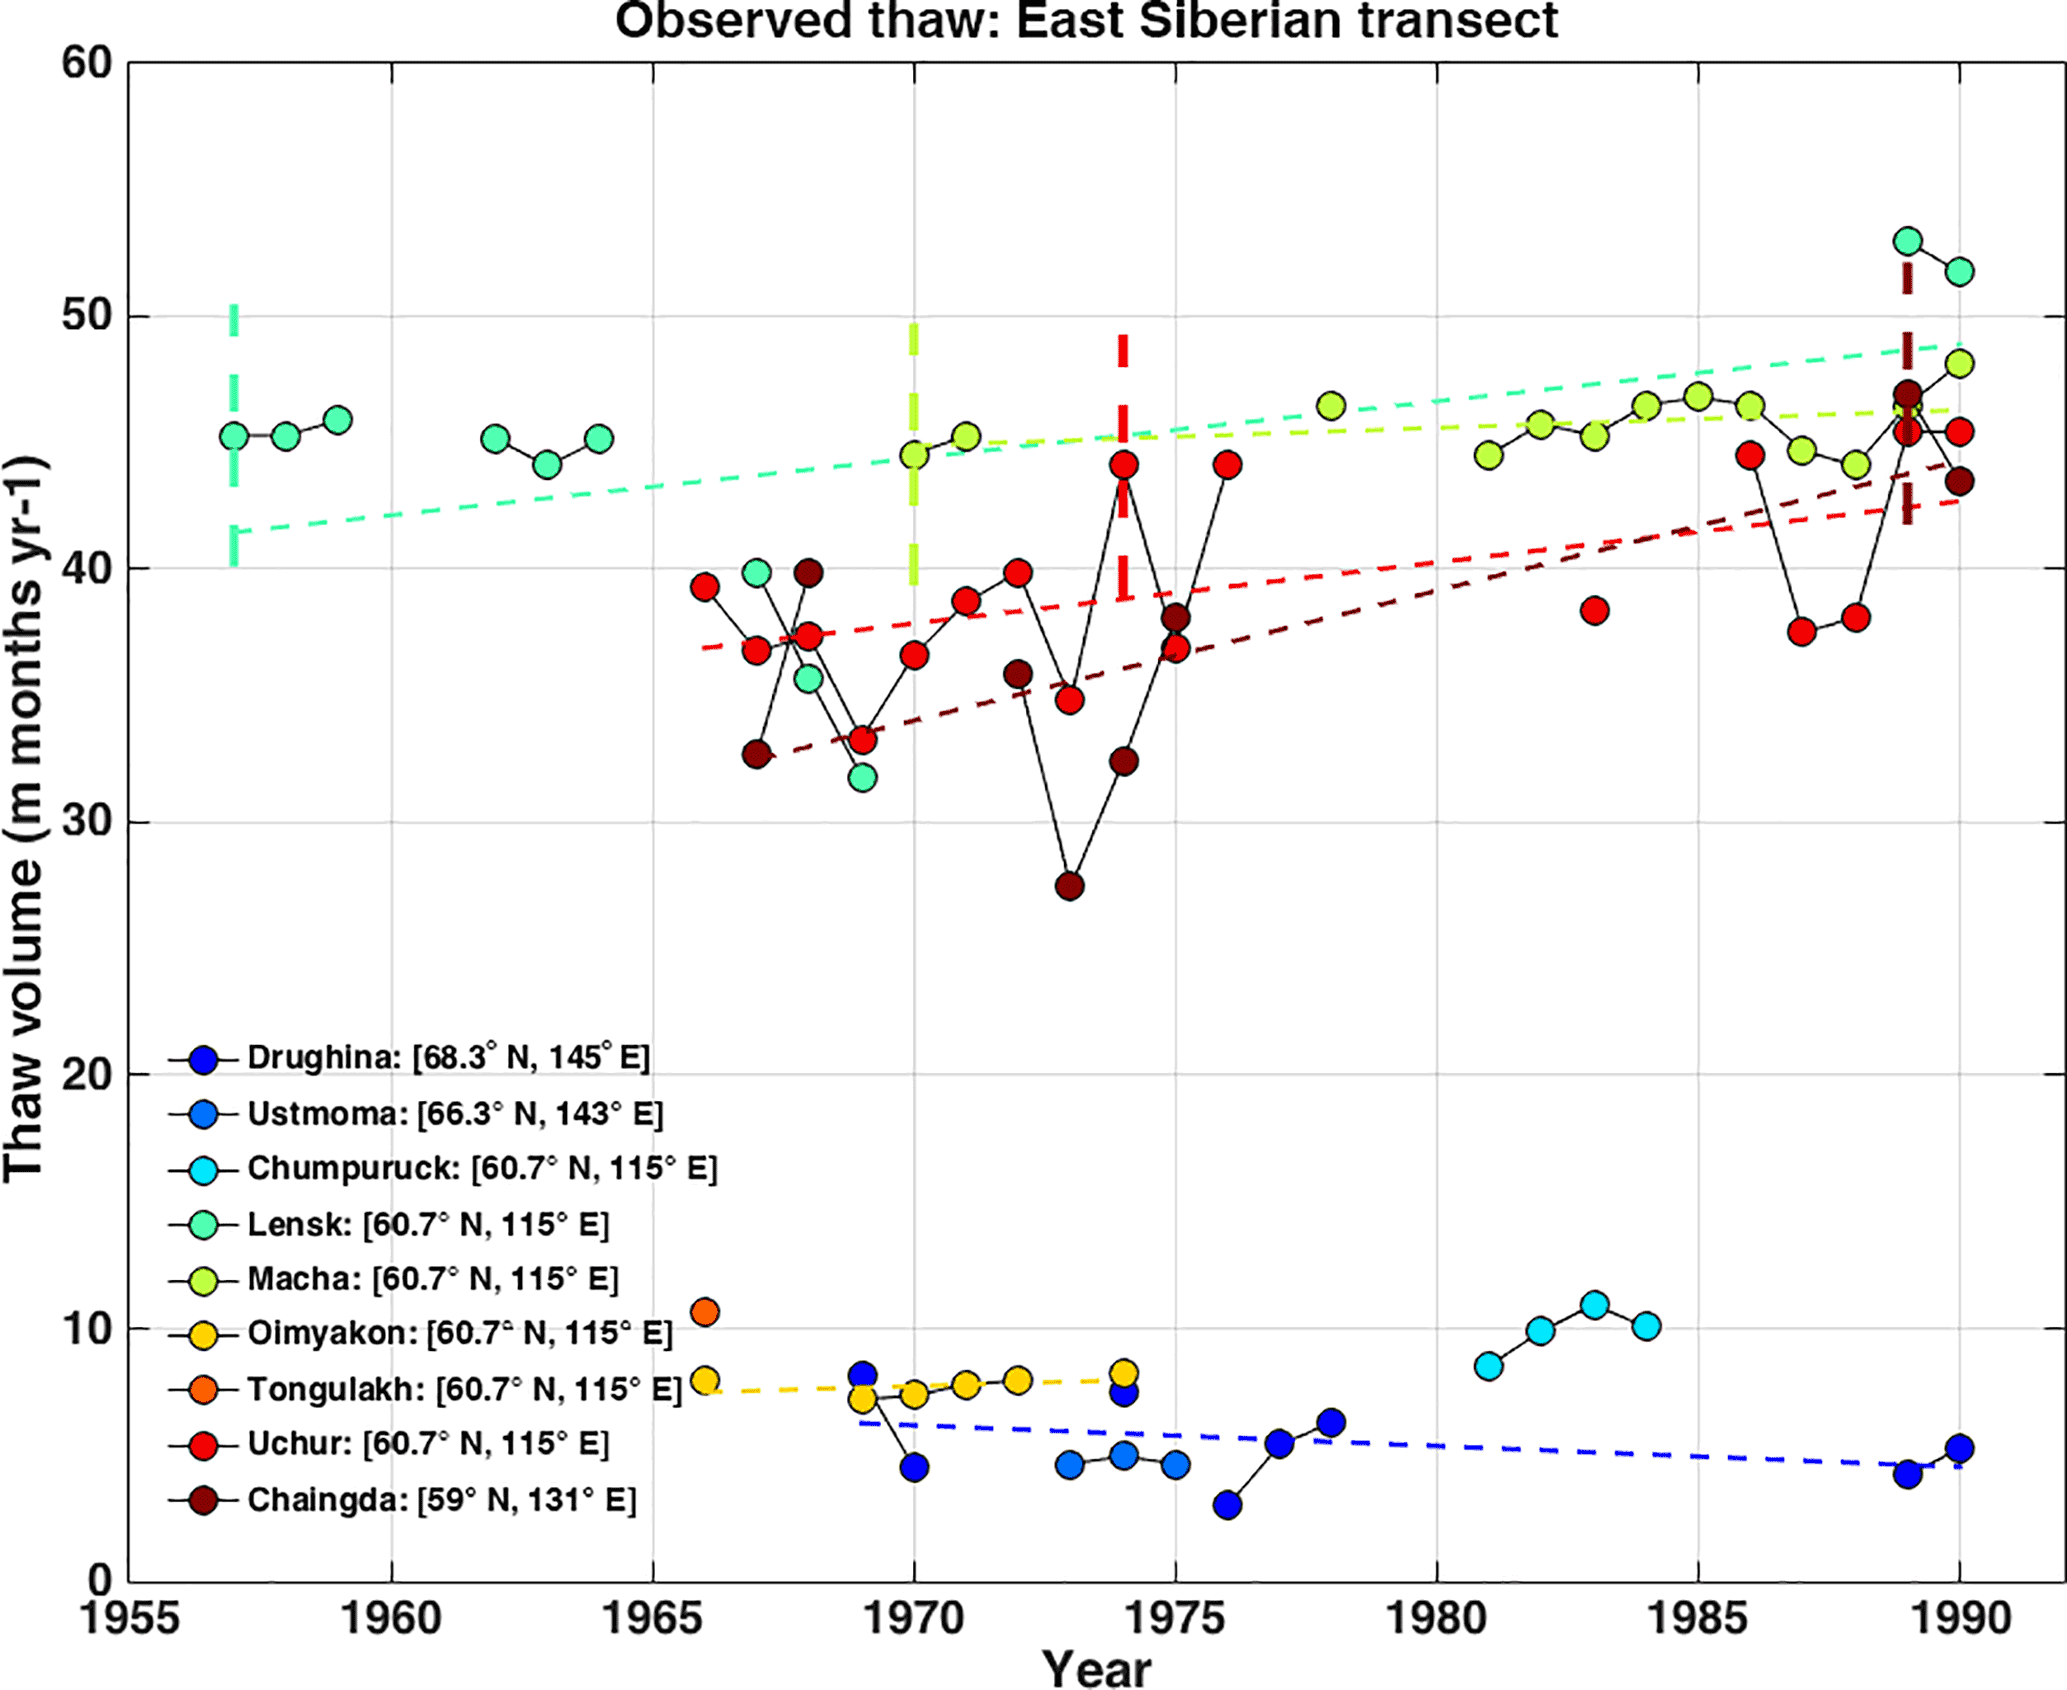
Figure 5Soil thaw observation time series from borehole measurements of soil temperature at sites along the East Siberian Transect over various periods from 1957 to 1990. Site coordinates are provided in the legend and plotted as crosses on the map provided in Fig. 1. Thaw trends are derived from estimates of thawed volume over a depth of 3.2 m for sites with > 55 months of data over multiple decades: Drughina, Lensk, Macha, Uchur, and Chaingda. Trend values are reported in Table 1. Vertical dashed lines mark the onset of talik formation at Lensk (1957), Macha (1970), Uchur (1974), and Chaingda (1989). Sites in southern Siberia show significant negative thaw volume trends over the 20th century, representing net increases in soil thaw. The trend at Drughina is not statistically significant, indicating that soil thaw is unchanged in northern Siberia.
Our simulated pattern of phase lag for heat transfer to depth mimics observed thaw profiles in North America (Fig. 4), which are sensitive to latitude and ecosystem, but with more “vertical” time–depth tilt in CLM4.5 compared to observations. Borehole data show shallow (∼ 0.5 m) and seasonally short (∼ 3–4 months from June to September) thaw at the northernmost tundra site in the Canadian Archipelago (Fig. 4a; 76∘ N, Mould Bay), shallow but longer thaw (5 months from June to October) moving slightly south to Alaska North Slope (Fig. 4b; 71.3∘ N, Barrow), and deep (∼ 3 m) and seasonally long (May–February) thaw at the low-latitude continental boreal site in southeastern Alaska (Fig. 4c; 62.4∘ N, Gakona). CLM4.5 shows reduced depth and seasonal duration of thaw when sampled at these specific geographical points, although the north–south gradient of increasing thaw moving south is preserved (Fig. 4d–f). Given the challenging task of comparing point locations with grid cell means, we also examine the mean behavior of CLM4.5 at locations where soil temperature at depth is similar to that observed. Accounting for permafrost temperature at 3 m (by sampling all locations with Tsoil-3 m within 0.5 ∘C of the observed temperature) better reproduces thaw depth, but with reduced seasonal duration throughout the soil column (Fig. 4g–i). These results suggest the current ensemble CLM4.5 run overestimates the rate of soil refreeze in early fall.
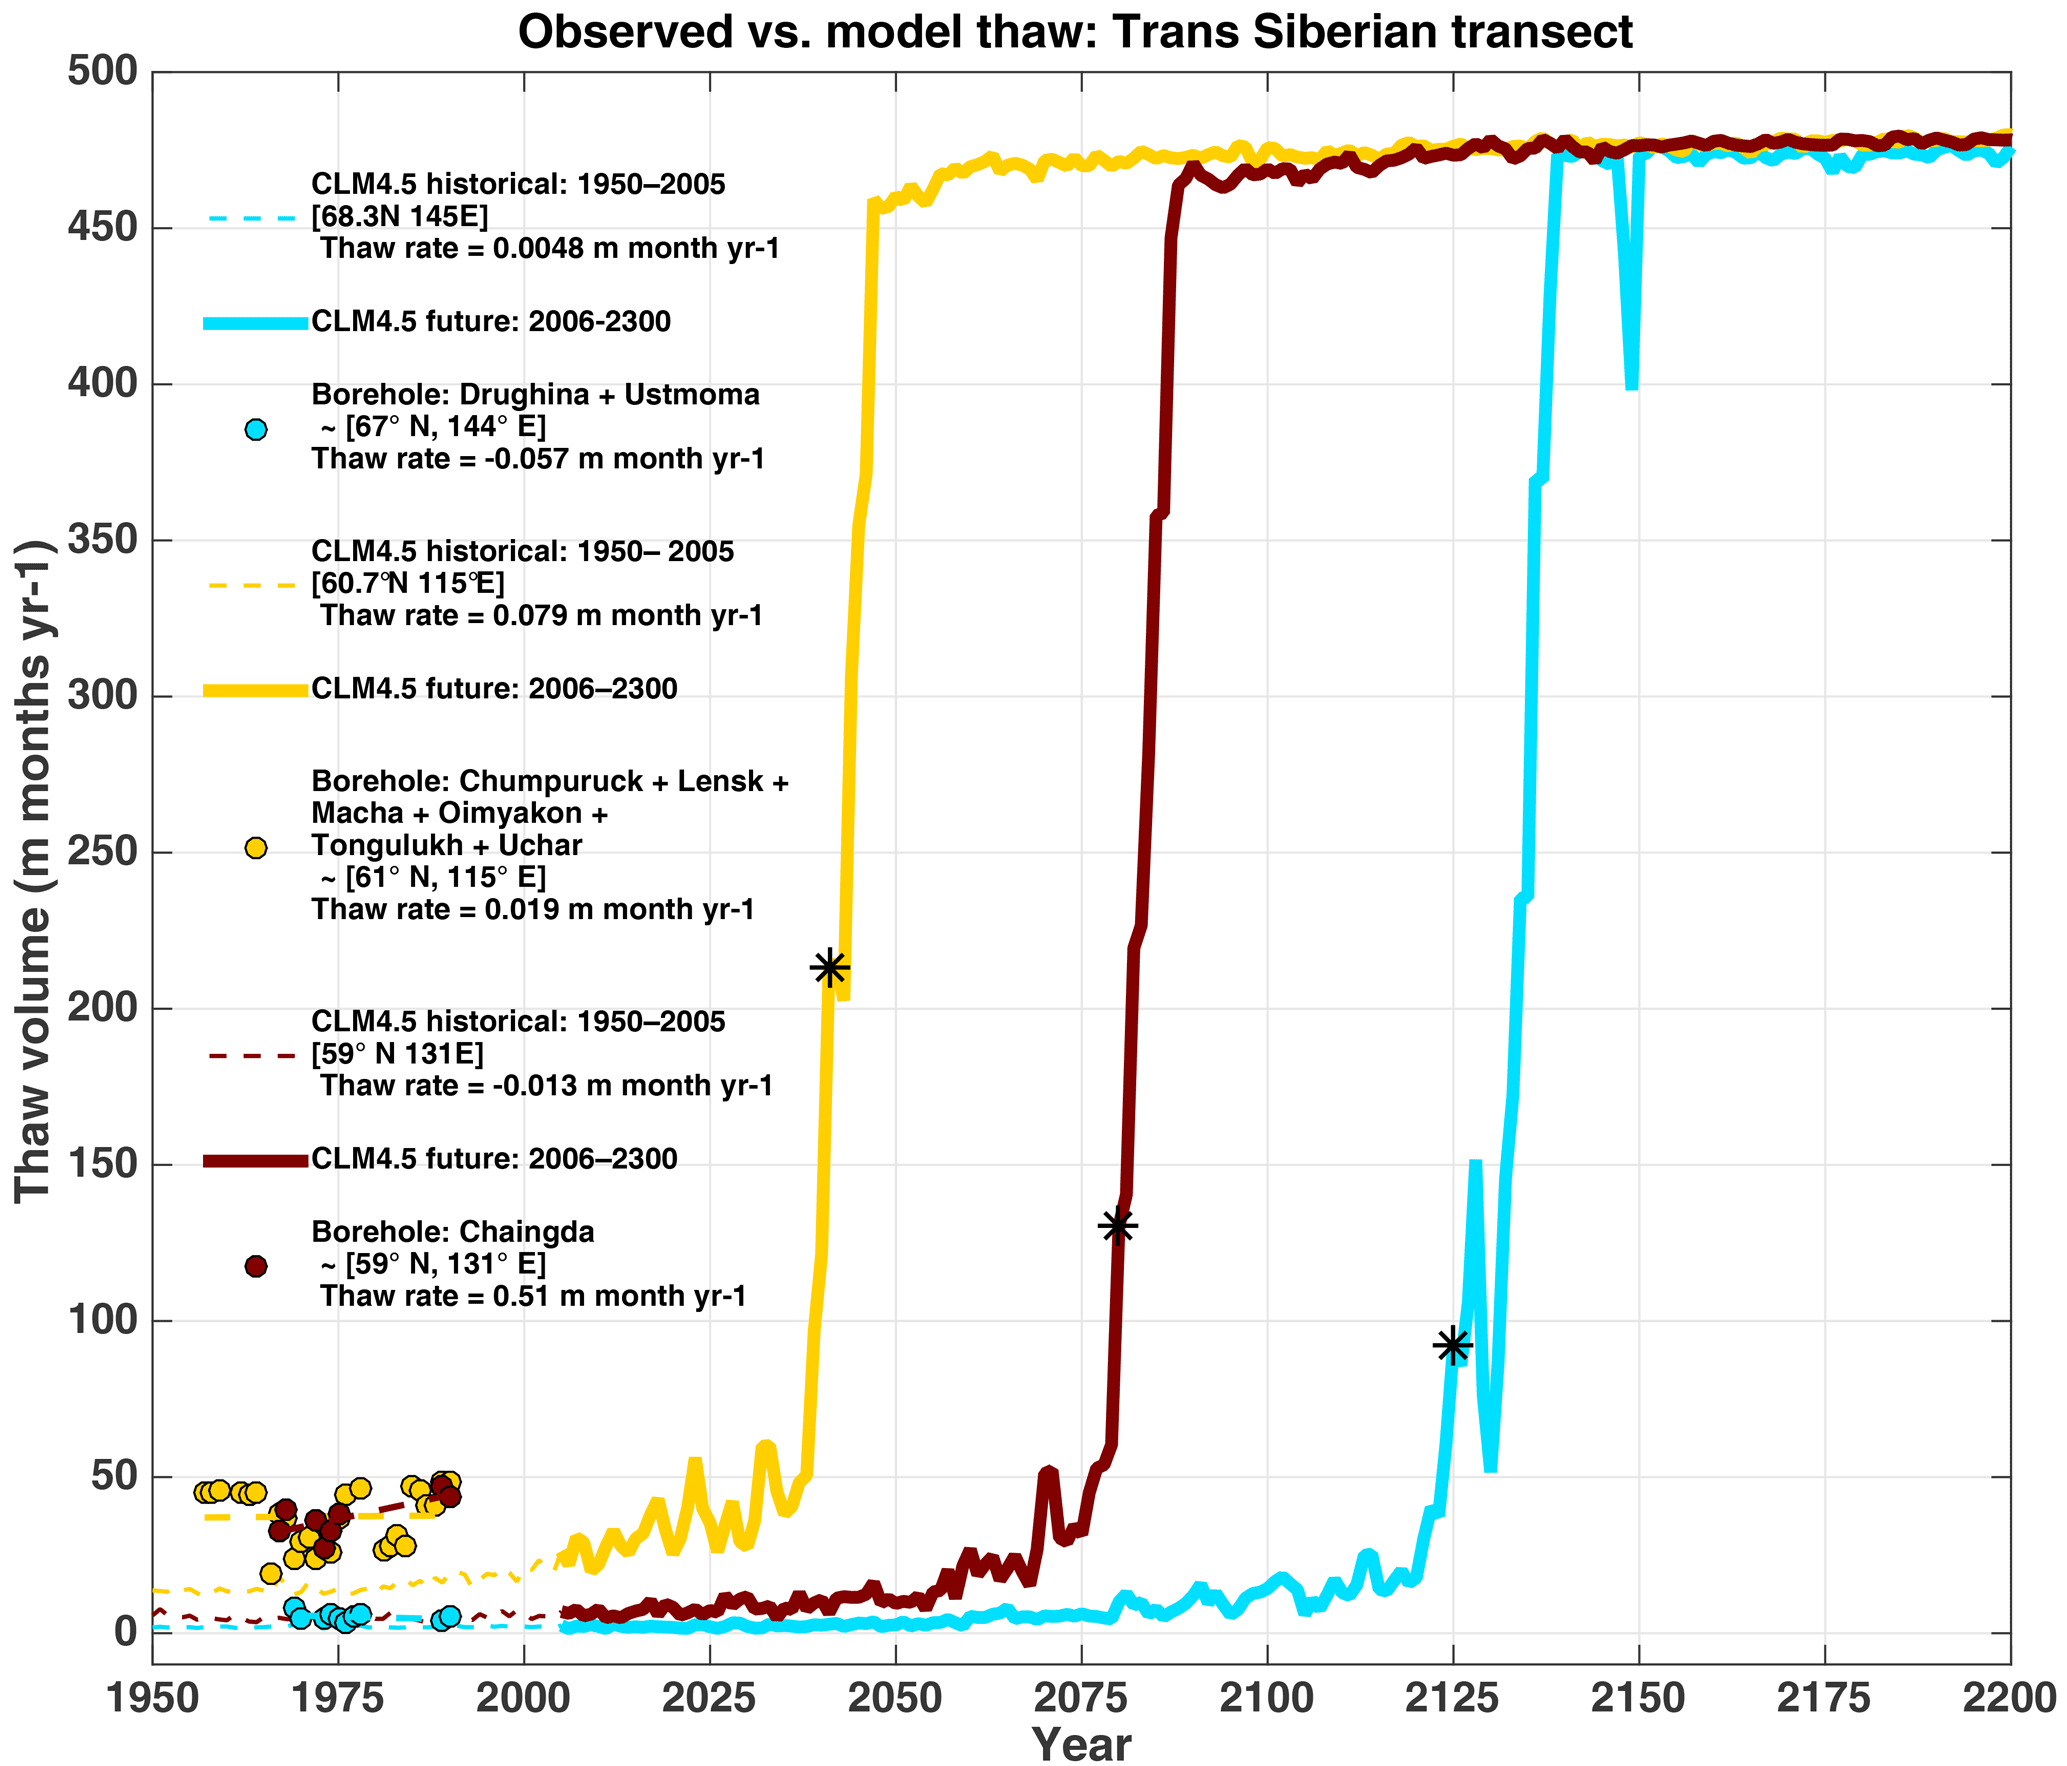
Figure 6Comparison of observed soil thaw to historical and future simulations at sites along the East Siberian Transect (crosses in Fig. 1). Observed thaw (filled circles) from 1955 to 1990 is based on soil thaw data in Fig. 5 and on the inter-site average at three locations: northern Siberia (blue), southwestern Siberia (yellow), and southeastern Siberia (brown). Simulated thaw from 1950 to 2200 is derived from CLM4.5 and sampled at the nearest grid cell of three above locations. Asterisks show simulated talik onset. Observed and simulated thaw trends are derived from soil thaw volume and estimated over the same period 1955–1990. We note a key discrepancy between observed and simulated thaw volume: simulated thaw volume is integrated over depths from 0 to 40 m; observed thaw volume is integrated from 0 to 3.6 m. The effect of this selection bias is a potential low bias in observed thaw volume. In general, soil thaw is projected to remain stable in northern Siberia but become increasingly unstable in southern Siberia.
Based on the pattern of January and February freeze–thaw dynamics observed at Gakona in the 2010s and the time lag of 1–3 decades from this occurrence to talik onset in our simulations, we project that Gakona will form talik as early as the 2020s, assuming the atmosphere continues to warm as prescribed in CLM4.5. Talik onset in CLM4.5 is variable in the region containing Gakona (southeastern Alaska) with earliest onset by mid-century (∼ 2050s, Fig. 1a); however, our comparison to borehole temperatures at Gakona suggests that simulated thaw rates in southwestern Alaska and across pan-Arctic regions with similar permafrost temperatures are underestimated and that earliest onset may occur sooner than predicted. Overall, we find that simulated patterns of permafrost thermal state change are consistent with available observations but that the exact thaw rates are uncertain. Although there are many possible explanations for differences in observed and simulated thaw rates, we can attribute high observed thaw rates in part to a combination of (1) relatively dry upper soil at Gakona and Mould Bay and (2) low surface organic layer and high conductivity of the Barrow and Mould Bay soils. We keep these uncertainties in mind as we examine patterns of change and talik formation simulated into 2300.
3.2 Evaluation of simulated thaw rates and talik onset against Siberian borehole data
The Siberian borehole locations have similar permafrost extent (> 50 %) to the North American locations according to the Circumpolar Permafrost Map (Brown, 2001) and similar mean annual air temperature (∼ −13.6 ∘C) in the 2000s according to CLM4.5. However, air temperature is more seasonal in Siberia, including colder winters (4 ∘C colder) and warmer summers (6 ∘C warmer). Spring thaw for the Siberian sites occurs 2 weeks earlier on average than for the North American sites in the 2000s, but follows the same pattern of later thaw date moving north along the borehole transect.
Next we examine thaw trends observed from borehole soil temperature data in Siberia in the 20th century and evaluate patterns of CLM4.5 projected trends in the 21st century. We note several caveats in these comparisons: (1) model simulations are based on only one realization (i.e., model ensemble member) of historic and future warming and projected permafrost thaw, (2) availability and access of long-term records in Siberia is limited, and (3) there is significant variability in space and time in simulated and observed thaw rates, making direct comparisons challenging. These comparisons thus serve primarily as a first benchmark for future model analysis and development.
We focus first on site-specific long-term historical trends by analyzing the six Siberian borehole sites which recorded at least 55 months and 5 years of temperature data spanning multiple decades: Drughina, Lensk, Macha, Oimyakon, Uchur, and Chaingda. Records at these locations show an increase in thaw volume with an average positive trend of 0.19 m month yr−1 from 1955 to 1990 (Table 1, Fig. 5). All sites except Drughina show positive trends, with larger trends in southern locations, ranging from 0.51 m month yr−1 from 1957 to 1990 at Chaingda in southern Siberia, to a statistically insignificant trend of −0.083 months yr−1 from 1969 to 1990 at Drughina in northeastern Siberia, suggesting a more or less constant thermal state at this site. Further examination indicates that active layer thickness at Drughina actually decreased to 0.8 m from 1989 to 1990 compared to 1.2 m in the 1970s (data not shown). Drughina also shows smaller average thaw volume magnitude compared to other sites, consistent with shallower thaw. Together, these findings indicate that active layer thickness is decreasing at Drughina.
There is considerable spatial variability in thaw volume and trends, but in general thaw trends increase from west (0.18 m month yr−1) to east (0.51 m month yr−1). Talik forms at several sites, at different times between 1957 and 1990 (shown by vertical dashed lines on Fig. 5), with earlier talik to the west consistent with higher mean initial thaw volumes. We acknowledge the difficulty in identifying talik onset due to discontinuities in the dataset and limited vertical information; however, we note that the 15–30-year gap between talik formation in the western site cluster vs. Chaingda 15∘ east is geographically consistent with model simulations of later talik formation in eastern Siberia in the 21st century (Fig. 1b) and thus may represent a gradual expansion of warming into the east. In general, permafrost appears to be degrading more rapidly at the southern locations compared to the northern location.
We recompute observed thaw trends at regional clusters using combined records at the two sites in northern Siberia (blue), six sites in southwest Siberia (yellow), and one site in southeast Siberia (brown, Table 1) and compare to historical and projected thaw volume trends in CLM4.5 (Fig. 6). Northern locations show a consistent pattern of low thaw volume (< 10 m month yr−1) and negligible thaw trend (∼ 0 m month yr−1) in the historical simulations and observed record from 1950 to 2000. Thaw projections in northern Siberia indicate an unchanged trend and continued stability of permafrost through the early 22st century, followed by a shift to accelerated soil thaw in the early 2120, marked by onset of deep soil thaw late in the cold season.
Southern locations show a systematic underestimate of mean thaw volume (< 20 m month yr−1) compared to observations (∼ 40 m month yr−1) from 1950 to 2000. Simulated thaw trends are negligible prior to 2000, but these likely represent an underestimate given low simulated thaw volumes and significant positive observed trends in both southeast and southwest Siberia beginning in the 1960s following talik onset (Fig. 5). Thaw projections show more abrupt shifts in thaw volume in the early 21st century in the southwest (∼ 2025) and in the mid-21st century (∼ 2050) in the southeast. The strong discrepancy between observed and simulated thaw and talik onset in southern Siberia warrants close monitoring and continued investigation of this region through sustained borehole measurements and additional model realizations of potential future warming.
3.3 Carbon cycle responses to changing ground thermal regime

Figure 7Projected decade when permafrost regions shift to long-term C sources over the period 2010–2300, and relation to talik onset, soil C, and fire emissions. (a) Map of the decade of transition to C source, reflected in the color code, showing earlier transitions in cold northern permafrost. (b) The area of land that transitions peaks in the late 21st century and is driven by regions where the C source leads talik onset (dashed). (c) The decadal time lag from talik onset to C source transition shows positive lags in warm southern permafrost (C source lags talik) and negative lags in cold norther permafrost (C source leads talik). (d) Histogram shows trimodal distribution of permafrost area as a function of decadal time lag, with negative lags related to high soil organic matter (green bars and map in e) and large positive lags related to fires (red bars and map in f) but delayed by high productivity. See text for details. These results assume a Representative Pathway 8.5 warming scenario through 2100 and an Extended Concentration Pathway 8.5 through 2300.
Figure 7a plots the decade in which NHL ecosystems are projected to transition to long-term C sources over the next 3 centuries (2010–2300). A total of 6.8 million km2 of land is projected to transition, peaking in the late 21st century, with most regions transitioning prior to 2150 (4.8 million km2 or 70 %; Fig. 7b, solid black). C source transitions which occur in the permafrost zone, accounting for 6.2 million km2 of land (91 % of all C source transitions), also form talik at some time from 2006 to 2300 (Fig. 7c). The remaining C source transitions (0.6 million km2, or 9 %) occur outside the permafrost zone, primarily in eastern Europe.
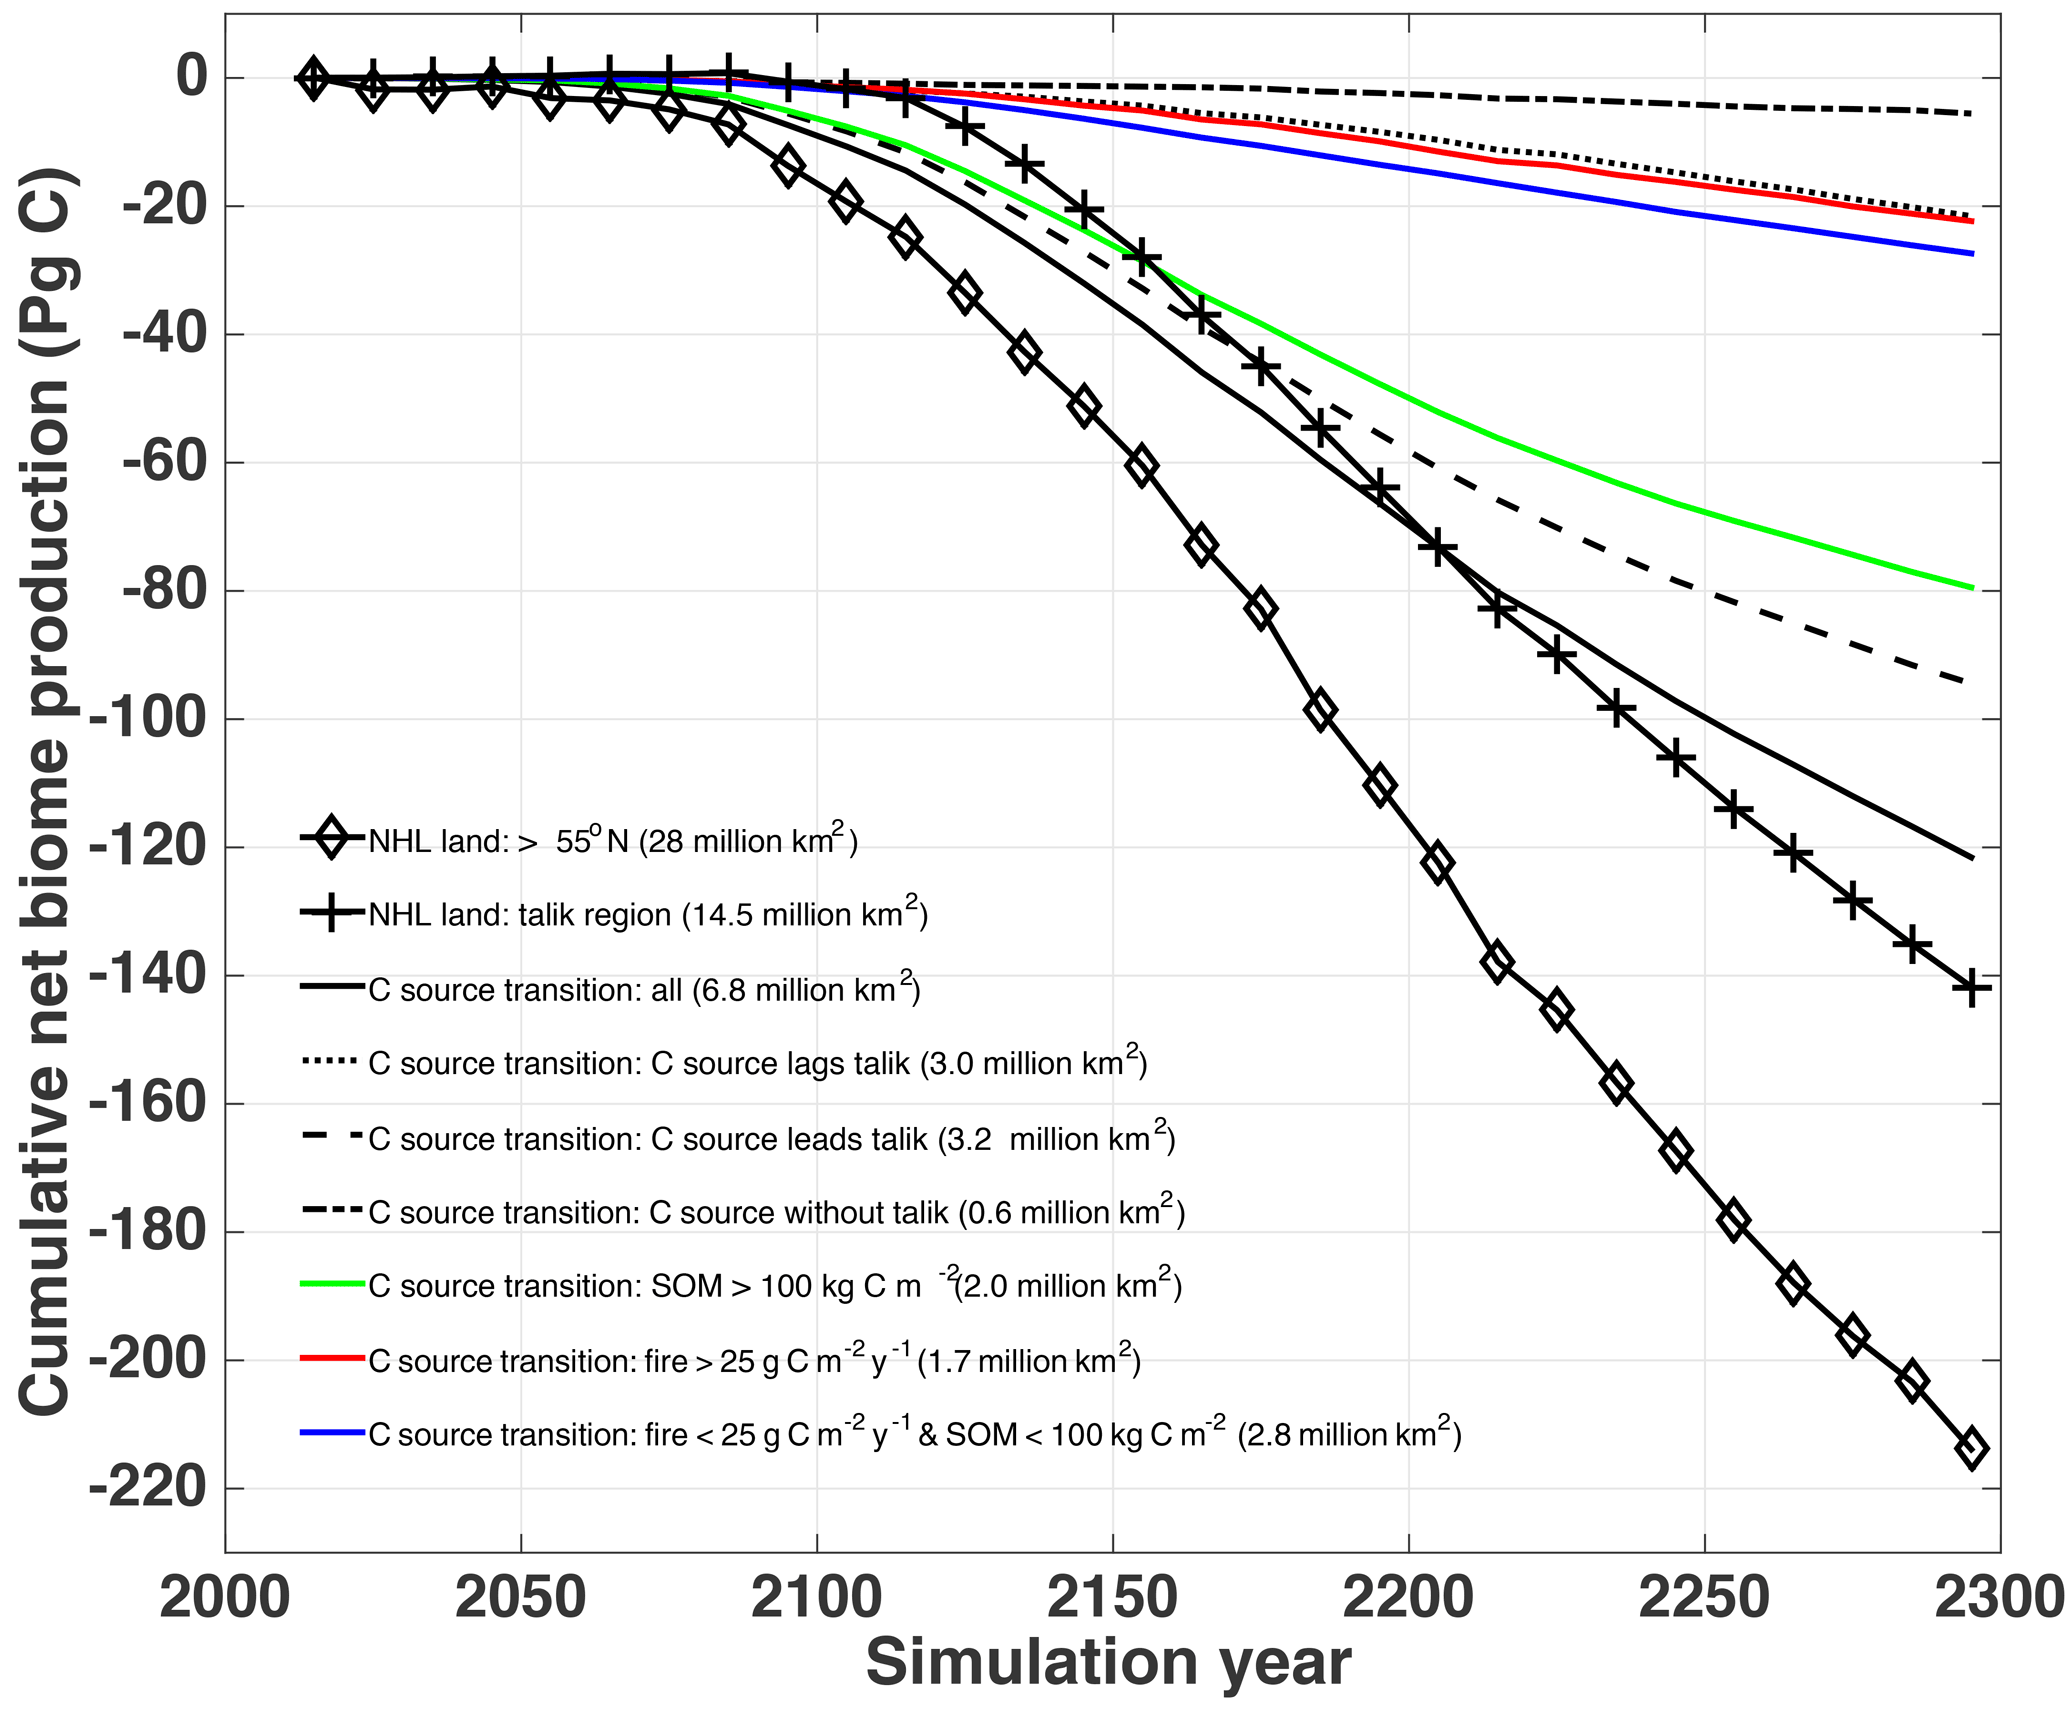
Figure 8Cumulative net biome production (NBP) over northern high-latitude (NHL) regions (> 55∘ N) from 2010 to 2300. NBP < 0 represents a net C source. NHL regions are divided into the following categories: all NHL land (diamonds), NHL land regions which form talik from 2010 to 2300 (crosses), and regions which transition to long-term C sources from 2010 to 2300 (black solid). C source transition regions are further broken down based on the lag relationship between talik onset and C source transition as follows: regions where the C source transition lags talik onset (dotted), leads talik onset (dashed), and occurs in the absence of talik (dashed dotted). C source transition regions also divided by soil C content and fire activity: regions where soil organic matter (SOM) exceeds 100 kg C m−2 (green), fire emissions exceed 25 (red), and SOM and fires do not exceed these thresholds (blue). Regions which transition to C sources prior to talik formation make up half of the total C source area but account for most of the cumulative C source (∼ 80 %) in large part due to high soil C.
Net C emissions from C source transition regions are a substantial fraction of the total NHL C budget over the next 3 centuries (Fig. 8). The cumulative pan-Arctic C source increases slowly over the 21st century, reaching 10 Pg C by 2100 with RCP8.5 warming, then increases more rapidly to 70 Pg C by 2200 and 120 Pg by 2300 with sustained ECP8.5 warming (Fig. 8, solid black). This pan-Arctic source represents 86 % of cumulative emissions in 2300 from the larger NHL talik region (crosses), despite the 2-fold smaller land area, and exceeds the talik region through 2200 due to mitigating widespread vegetation C gains (Koven et al., 2015). Cumulative emissions over all NHL land regions (diamonds, > 55∘ N) increase in similar fashion to the talik region, reaching 120 Pg C by 2200 and 220 by 2300, with no sign of slowing.
The geographic pattern of C sink-to-source transition date is reversed compared to that of talik formation, with earlier transitions at higher latitudes (the processes driving these patterns are discussed in detail below). Overall, the lag relationship between talik onset and C source transition exhibits a trimodal distribution (Fig. 7d), with peaks at negative time lag (C source leads talik onset, median lag = −5 to −6 decades), neutral time lag (C source synchronized with talik onset; median lag = −2 to 1 decade), and positive time lag (C source lags talik; median lag = 12 decades; red shading in Fig. 7c), each of which is associated with a distinct process based on soil C and fire emissions as discussed below. Roughly half of these regions (3.2 million km2) show neutral or positive time lag (lag ≥ 0). This pattern, characteristic of the sub-Arctic (< 65∘ N), represents the vast majority of C source transitions after 2150 (Fig. 7b, dotted), but only accounts for 17 % of cumulative emissions (20 Pg C by 2300; Fig. 8, dotted). The remaining regions (3.0 million km2) in the Arctic and high Arctic (> 65∘ N) show negative time lag and account for most of late 21st century sources and cumulative emissions (95 Pg C by 2300, or 79 %; Fig. 8, dashed). C sources in regions not identified as talik (0.63 million km2) either show talik presence at the start of our simulation or are projected to transition in the absence of permafrost or in regions of severely degraded permafrost (Fig. 7c, dash dotted). This region contributes only 5 Pg C (4 %) of cumulative C emissions in 2300.
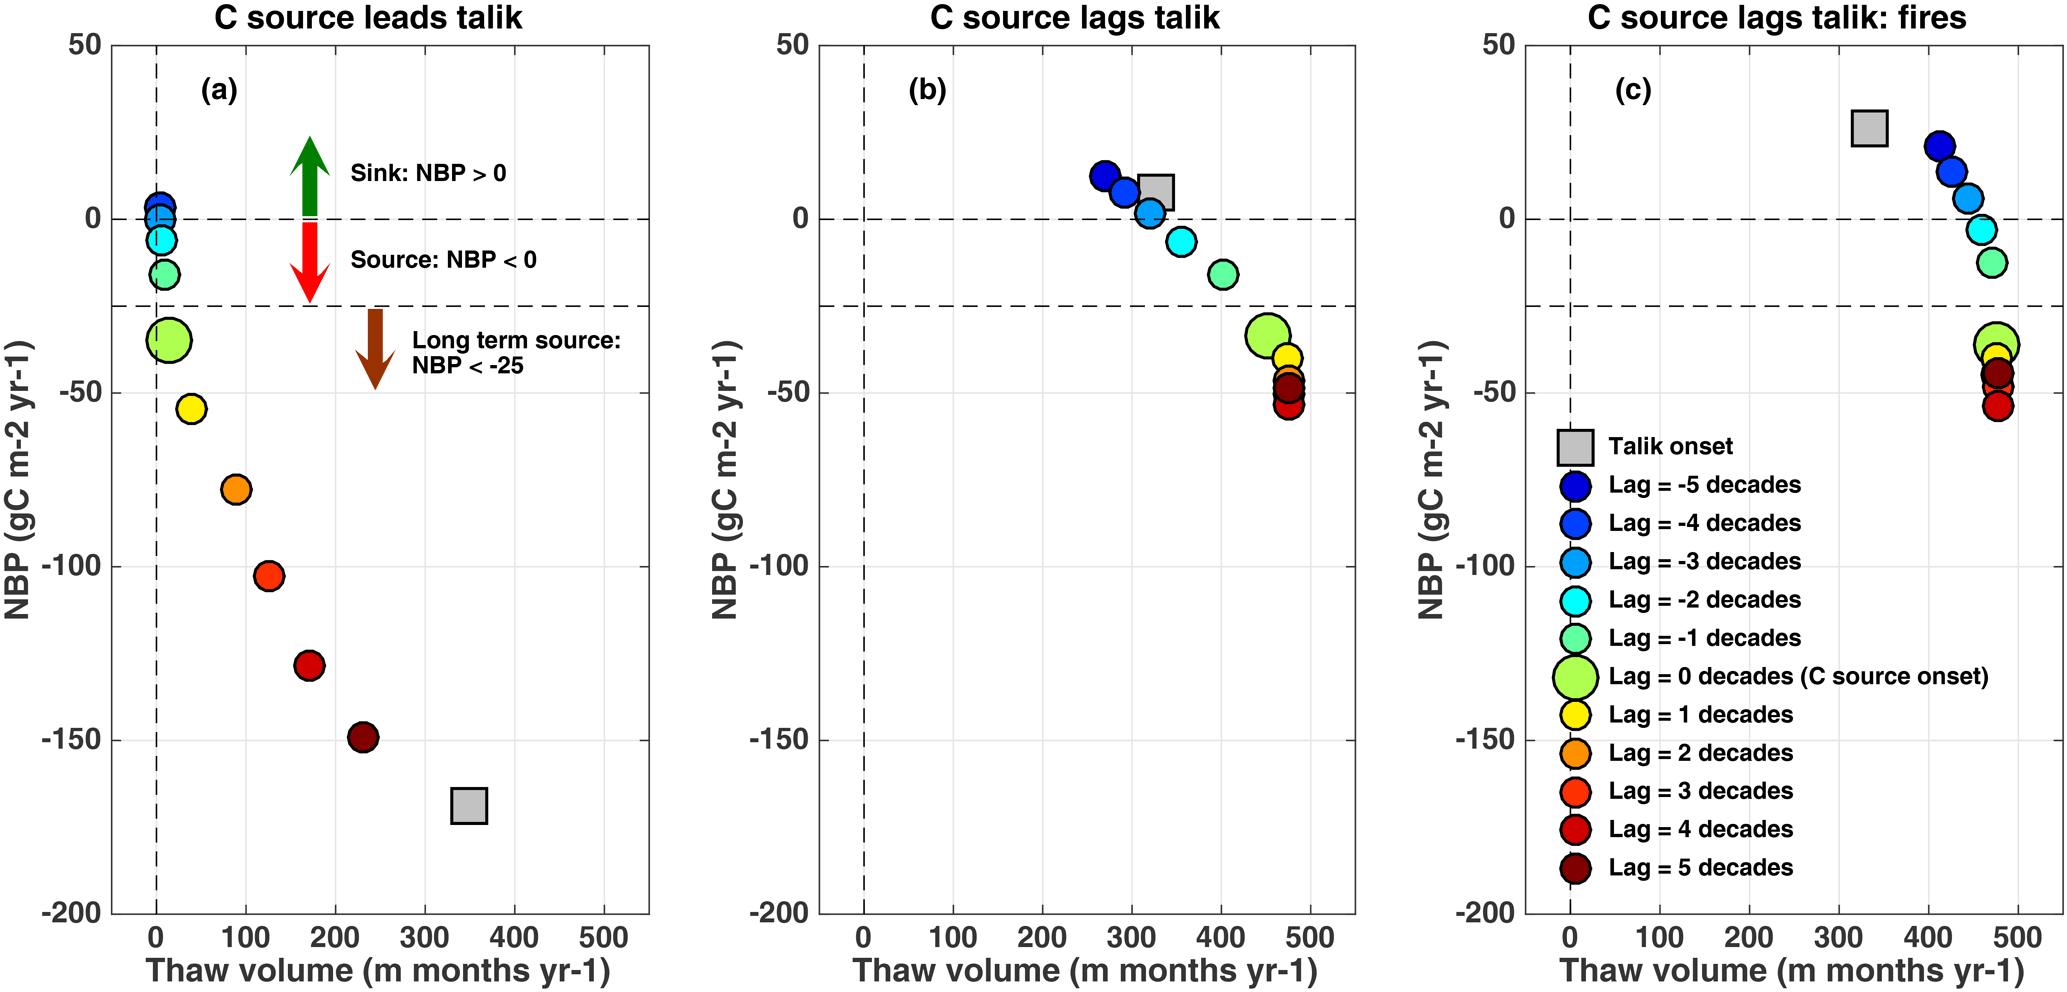
Figure 9Net biome production (NBP) as a function of thaw volume. Symbols represent NBP and thaw volume values averaged over regions which transition to long-term C source from 2060 to 2140, binned into regions where the decade of C source transition (a) leads talik onset, (b) lags talik onset, and (c) lags talik onset AND where fires exceed 25 . Colors indicate decade relative to C source transition, denoted by the large green marker, which occurs when NBP exceeds −25 (grey horizontal dashed line). The grey square marker indicates the mean NBP and thaw volume values during talik onset. Cases where C source leads talik (a) show small thaw volumes during C source transition and amplified C sources during talik onset. Cases where C source lags talik (b)–(c) show large thaw volumes during C source transition and C sinks during talik onset.
Here, we investigate biological and soil thermal processes driving these relationships, focusing first on regions where C source transition leads talik onset (blue shading in Fig. 7c). In these regions, thaw volume is low (< 50 m month yr−1) and shows a weak relationship to NBP (NBP decreases much faster than thaw volume) prior to C source onset (indicated by large green circle in Fig. 9a). By the time thaw volume reaches 300 m month yr−1 and talik formation occurs, these regions are already very strong sources (NBP > 150 ). This suggests that C sources in these regions are not driven by respiration of old C from deep soil thaw, and thus alternative explanations are needed.

Figure 10Evolution of simulated soil thermal and hydrological state, plotted as a function of month and depth, for regions which transition to long-term C sources in the 2060s but do not form talik for another 3 decades (≥ 2090s). This represents cases where C source leads talik (e.g., Fig. 9b). Each panel presents decadal average seasonal profiles in the decades leading up to C source transition. Shading and contour details are explained in Fig. 3. These profiles exhibit shifts in thaw period (October), depth (> 1.5 m), and soil moisture (drying) in the transition decade.
Closer examination of thermal and moisture dynamics in shallow soils reveals three potential indicators of C source transition: (1) seasonal duration of thaw, (2) depth of thaw, and (3) soil drying. For example, vertical profiles of soil temperature and moisture (Fig. 10) in regions which transition to C sources in the 2090s show deeper seasonal penetration of soil thaw, a jump in active layer growth, and enhanced year-round soil drying during the C source transition decade (Fig. 10d). A broader analysis of soil thaw statistics over all regions and periods indicates that most C source transitions (∼ 2.3 million km2, or 77 % of land where C source leads talik) occur at active layer depths below 3 m and thaw season penetration into November.
Further examination of ecosystem biogeochemistry also shows high initial C stocks in these regions (red shading in Fig. 7e). The median initial state of SOM, 109 kg C m−2, is nearly a factor of 2 larger than the median value in regions where C source lags talik onset (SOM = 59 kg C m−2). These regions also show 40 % less gross primary production (median GPP = 755 vs. 1296 ) and higher over saturation prior to C source onset (water-filled pore space at 0.5 m depth at 10, 5, and 2 decades prior = 0.63, 0.59, and 0.57 mm3 mm−3 for cold permafrost vs. a near constant value of 0.57 mm−3 in warm permafrost). The total area of land in which SOM exceeds 100 kg C m−2 represents two-thirds of all land where C sources lead talik onset (2.0 million km2) and peaks at a negative time lag of −5 to −6 decades (Fig. 7d, green bars), which perfectly aligns with the peak distribution of negative time lags. Cumulative C emissions from regions of SOM > 100 kg C m−2 are also two-thirds of total C emissions (80 Pg C; Fig. 8, green). These results indicate peat-like conditions characterized by saturated soils, high C stocks, and low annual productivity, which allow low thaw volumes (active layer depth < 2 m and peak thaw month of October, on average) and rapid soil drying to produce early C losses in colder environments in the absence of talik.
In regions where C source transitions lag talik onset (red shading in Fig. 7c), NBP is strongly sensitive to changes in thaw volume until C source onset occurs (Fig. 9b), and talik formation occurs when these regions are weak sinks (NBP > 0 ). In general, C source onset under high thaw volume indicates these regions are more sensitive to C emissions from deep soil thaw. However, as noted above, neutral and positive time lags show a bimodal distribution peaking near 0 and 15 decades, and thus additional explanations are needed. Further examination shows high fire activity in these regions at the time of C source onset (red shading in Fig. 7f). The regions where fire C emissions exceed 25 , representing our threshold for C source transition, are exclusively boreal ecosystems, account for one-third of all land with negative lags (∼ 1.1 million km2) and align perfectly with the peak distribution of positive time lags (Fig. 7d, red bars) and cumulative C emissions (20 Pg C in 2300, Fig. 8, red). NBP is less sensitive to thaw volume in regions where fire dominates the C balance, which are strong C sinks at talik onset (Fig. 9c), where soil C respiration is 13 % less than non-fire regions (median SOMHR = 331 vs. 382 ), and productivity is 25 % more (median GPP = 1548 vs. 1216 ). Fire regions are also 28 % drier on average in the surface layer than non-fire regions (volumetric soil moisture = 0.28 vs. 0.39 mm−3 in summer (May–September) in the upper 10 cm of soil). These results suggest that soil thermal processes and talik formation are significant factors driving C source transition in regions with reduced productivity, but fire activity, spurred by soil drying, drives C source transition in higher productivity regions.
The decadal time lag between talik onset and C source transition is more normally distributed in the remaining region, represented by the residual grey bars visible in Fig. 7d, which occurs predominantly in cold northern permafrost in northwestern Siberia, where low SOM (< 100 kg m−2) and fire emission (< 25 ) prevail. This region has a mean lag of 1 decade from talik onset to C source, with high standard deviation of lags (±8 decades) reflecting a skewed distribution of GPP; low productivity in cold permafrost (GPP = 385 ) increases the likelihood that soil thaw will lead to C source transition prior to talik onset, and high productivity in warm permafrost (GPP = 1111 ) increases the likelihood of a transition after talik onset. Cumulative C emissions from this region are on the low end (27 Pg C by 2300; Fig. 8, blue) due to low soil C (SOM = 59 kg C m−2).
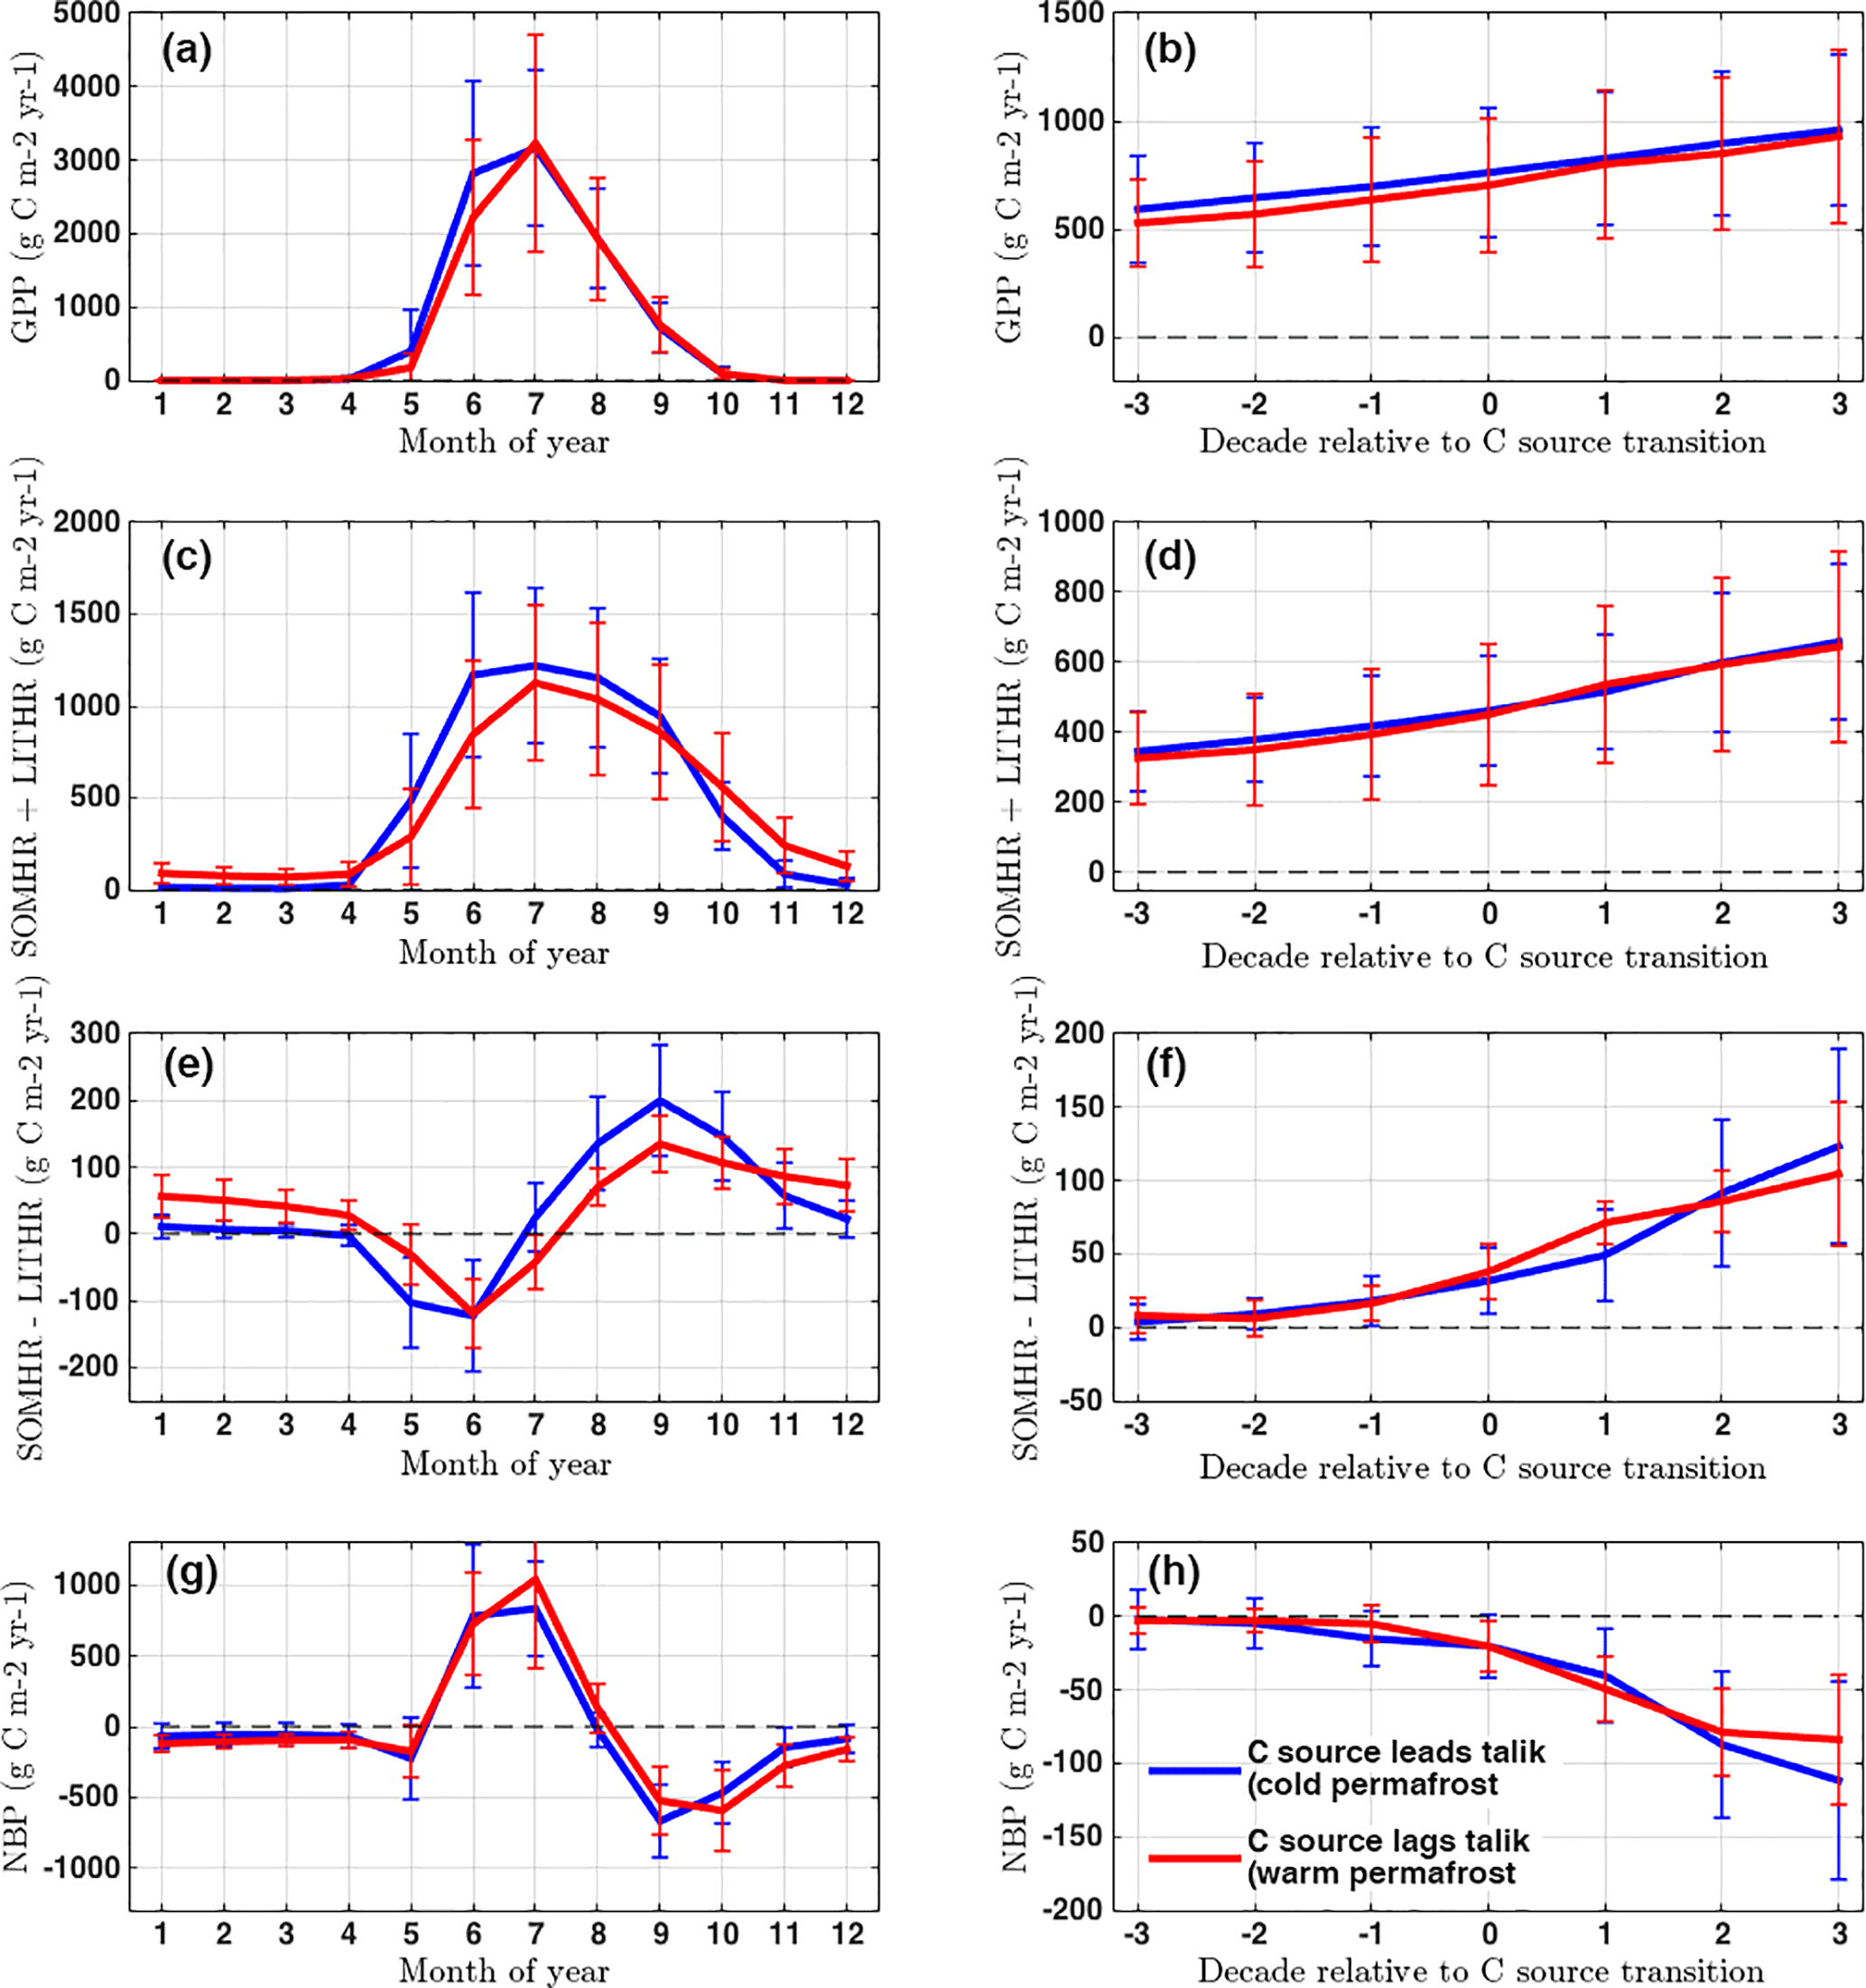
Figure 11Time series of ecosystem C fluxes showing seasonal and decadal patterns during C source transition. This presents mean and standard deviations over the period 2040–2270 for (a–b) gross primary production (GPP), (c–d) sum of respiration from soils (SOMHR) and litter (LITHR), (e–f) difference of respiration from soils and litter, and (g–h) net biome production (NBP) where NBP < 0 indicates source. The left columns show seasonal fluxes during the decade of C source transition. The right column shows the evolution of decadal mean fluxes in the 3 decades preceding and following C source transition. Regions where C source transition leads talik (blue) show similar patterns to regions where transition lags talik (red), most notably a jump in soil vs. litter respiration during C source transition (f) corresponding in time and magnitude to decreasing NBP (h). The primary difference between regions is the seasonal distribution of SOMHR vs. LITHR (e), which shows a large soil respiration source throughout the cold season in cases where C sources lag talik. This indicates an annual source of deep old C.
Independent of the presence of talik, a key effect of an increasing number of thaw months is an increasing rate of respiration from soil C pools. Warming and CO2 fertilization increase the rate of photosynthetic C uptake, increasing soil respiration mainly from younger near-surface C pools; whereas deeper thawing affects both young and old C pools, so that the depth of thaw dictates the timing and dominant C age of the net respiration flux. Figure 11 illustrates this with a comparison of decadal respiration trends for SOM (SOMHR) and litter (LITHR) C pools for C source transitions in the mid-21st century, for scenarios where C source leads talik onset (blue line, cold permafrost) and lags talik (red lines, warm permafrost). Here, we examine combined respiration (SOMHR + LITHR) and respiration difference (SOMHR − LITHR) from soil and litter C pools.
GPP and combined respiration increase by ∼ 15 % decade−1 for each permafrost regime surrounding the decade of C source transition with peak fluxes in the growing season (Fig. 11a–d). Combined respiration in cold permafrost is systematically larger than in warm permafrost in the growing season (May–September) and smaller in the cold season (October–April). In particular, combined respiration is effectively zero for the late cold season (January–April) in cold permafrost and significantly positive in warm permafrost over the same period. The respiration difference also increases surrounding the C source transition (Fig. 11e–f), but with two key differences from combined respiration: (1) the decadal increase is exponential, starting from a value near zero just 3 decades prior to C source transition, and (2) peak respiration difference occurs in late summer and early fall. Because litter respiration in the model is mainly drawing from C pools with short turnover times, the litter respiration flux equilibrates rapidly to changes in productivity and thus its change primarily reflects changes to inputs rather than decomposition rates. Conversely, soil C pools, which have much longer turnover times, equilibrate much more slowly to the productivity changes and thus primarily reflect changes to the turnover times.
The trend in the respiration difference in warm and cold permafrost, which increase by similar amounts (∼ 100 ), thus reflects an increasing dominance of respiration from younger and older soil C pools, respectively. These trends are identical to the corresponding NBP trends, which decrease by 100 over the same period from neutral to net source (Fig. 11g–h), such that the differences between GPP and respiration driving the NBP trends are explained almost entirely by the increasing fraction of soil vs. litter respiration. Furthermore, warm permafrost shows sustained dominance of soil respiration during the entire cold season. These results are consistent with an increasing thaw effect on C budgets during C source transitions, but where shallow thaw of young soil C dominates in cold permafrost and where talik formation and deep thaw of old soil C dominate warm permafrost.
These results suggest that where talik forms, soil respiration increases throughout the year as talik and perennial thaw mobilize deeper old soil C to respiration. In the absence of talik in colder environments, soil respiration increases primarily in the non-frozen season due to increased availability of thawed shallow soil C. The lower GPP in colder regions suggests that increased availability of substrate for respiration due to plant growth and soil C accumulation has less impact on C source transition in our simulations than soil thaw dynamics and the initial state of soil C. Thus, cold permafrost locations become C sources due only to thaw-season dynamics while warmer permafrost locations transition to C sources due largely to changes in cold-season dynamics.
Talik formation is widespread in our simulations, affecting half of all NHL land (∼ 14.5 million km2) from 2010 through 2300. Simulations of the vertical thermal structure of soil thaw leading to talik in CLM4.5 qualitatively reproduce deep soil temperature data from borehole measurements in Siberia and western North America, although rates of thaw at these and similar permafrost locations are underestimated. Space-for-time comparisons along the north–south borehole transect in Alaska and the Canadian Archipelago show a pattern of deepening and seasonal expansion of thaw moving from the coldest location of the transect in northern Canada (Mould Bay) to the warmest location in southeastern Alaska (Gakona). Gakona shows the characteristic late cold-season thaw penetration into February at 2–3 m depth which in our simulations signals imminent talik onset (in the case of Gakona, as soon as the 2020s). Likewise, projected soil thaw trends in east Siberia are in line with long-term borehole measurements along the East Siberian Transect, but the rate of talik formation here is also underestimated.
These comparisons indicate stable permafrost conditions in the colder sites in Siberia and North America through the 21st century, where thaw is generally slow, seasonally short, and stable. This suggests talik formation in the northern Arctic is decades to centuries away, but potentially sooner than the early 22nd century, as projected by the CLM4.5 simulation. Our analysis finds more unstable permafrost conditions to the south, with observed talik in the late 20th century although simulated talik is delayed until the early 21st century.
Due to the potential for early 21st century talik and discrepancy between observed and simulated trends in warm permafrost, continued model investigation of factors controlling the rate of soil thaw is critically needed. In particular, large-scale drying as projected in CLM4.5 near the surface (Lawrence et al., 2015) may be restricting heat penetration and active layer growth in the growing season, especially in organic-rich soils which have very low thermal conductivity (O'Donnell et al., 2009; Lawrence et al., 2011, 2012). Controlled experiments demonstrating the sensitivity of talik to parameters that control soil drying such ice impedance or baseflow scalars (e.g., Lawrence et al., 2015), and the effect of organic content and mineral soil texture (Lawrence and Slater, 2008), could provide key insight on soil thermal dynamics in frozen or partially frozen conditions. Other factors affecting soil hydrology and carbon cycling not considered in our CLM4.5 simulations include high spatial resolution in discontinuous permafrost, shifts in vegetation community, lateral flow representation, thermokarst activity and other thaw-related changes to the ground surface, surface slope and aspect, soil heterogeneity, and potentially several other factors (see Jorgenson and Osterkamp, 2005, for discussion of some of the many complexities to be considered).
Our simulations show increasing C emissions over time across the talik region (Fig. 1b), as cumulative NBP becomes increasingly negative (NBP < 0 equals a net C source), reaching a net source of 140 Pg C by 2300 (Fig. 8, crosses), consistent with previous estimates of net C balance across the larger pan-Arctic region from CLM4.5 (∼ 160 Pg C; Koven et al., 2015; Lawrence et al., 2015). Ecosystems which transition from net C sinks to net C sources represent less than half the total talik area (6.8 of 14.5 million km2; Fig. 7a) but account for most (∼ 85 %) of the cumulative emissions, reaching 10 Pg C in 2100, 70 Pg C in 2200, and 120 Pg C by 2300 (Fig. 8, solid black). Removing the effect of vegetation C gain (∼ 20 Pg C in 2100 and 40 Pg C in 2200 and 2300 according Koven et al., 2015), we estimate a cumulative permafrost emission for C source transition regions of 30 Pg C in 2100, 110 Pg C in 2200, and 160 Pg C in 2300. These numbers are on the low end but consistent with estimates of permafrost C emissions summarized by Schuur et al. (2015), which range from 37 to 174 Pg C by 2100 and 100 to 400 Pg C by 2300.
About half of this region (3.2 million km2) shows a pattern of accelerated soil C respiration following talik onset, which shifts the surface C balance of photosynthetic uptake and litter respiration from net C sinks to long-term net sources totaling 20 Pg C by 2300. The pattern of C source transition following talik formation is most evident in warm permafrost in the sub-Arctic, suggesting increased microbial decomposition with warming soils. We also find evidence of talik-driven soil drying near the surface associated with increased active layer thickness and higher available water storage, which can lead to enhanced decomposition rates by causing soils to be less frequently saturated or anoxic (Lawrence et al., 2015). At the same time, these regions show high ecosystem productivity which increases roughly in proportion to respiration and thus may be driven by combination of warming and increased nitrogen availability resulting from permafrost thaw (Mack et al., 2004; Natali et al., 2012; Koven et al., 2015). As such, the transition time to sustained net ecosystem C source is delayed by 1–2 centuries following talik onset as productivity continues to outpace respiration as currently observed (Belshe et al., 2013; Mack et al., 2004), with C balance transitions peaking in the mid- to late 22nd century. In nearly one-third of these regions, an estimated 2 million km2 of land, fires are a primary mechanism triggering C source onset, rather than talik. Consequently, in regions of very high productivity, talik appears to serve more as an indirect driver of long-term C sources through accelerated soil drying rather than as a direct driver through accelerated respiration of deep soil C.
Our estimate of C emissions following talik onset (∼ 20 Pg C) is low compared to the cumulative emissions from all long-term C source transitions (120 Pg C), but likely strongly underestimated. Soil C is not permitted below 3.5 m in CLM4.5, or in most analogous models, such that potential decomposition of the ∼ 350 Pg soil organic C in deep permafrost (yedoma C, > 3 m) is not accounted for (Hugelius et al., 2014; Jackson et al., 2017). This is significant for our simulations, which show frequent talik formation and accelerating thaw volumes below 3 m (e.g., Fig. 3). We therefore caution the reader in the interpretation of the timing and magnitude of permafrost C emissions following talik onset in our simulations, which represent a lower bound of potential emissions based on the current formulation of CLM4.5.
We identify an equally large region of land in the high Arctic, representing ∼ 3.0 million km2, which is projected to transition to a long-term C source much sooner than the sub-Arctic in the absence of talik and emit 5 times as much C by 2300 (∼ 95 Pg C). This region, distributed across northern Siberia and North America, resembles peatlands and is characterized by cold permafrost, high soil C stocks and soil moisture, and low productivity. Thawing in this cold northern permafrost is limited to young, shallow soils with significantly reduced contributions from deeper, older C than warm permafrost, but with a factor of 2 higher C stocks. These C rich soils become increasingly vulnerable to decomposition as they are exposed to increased warming and drying as active layers deepen and persist deeper into the cold season. The transition to long-term C sources in this region peak is expected to peak between 2050 and 2100, nearly a century prior to talik-driven sources in warm permafrost and decades to centuries prior to talik onset, which eventually amplifies C sources in this region.
These results have important implications for designing an Arctic monitoring system to simultaneously detect changes in the soil thermal state and C state. In particular, C observations should not be limited to warm permafrost regions of the sub-Arctic, since cold northern permafrost regions are projected to become C sources much sooner and emit more C even without forming talik. Our analysis of the seasonal dynamics and vertical structure of permafrost thaw and soil C emissions provides a general strategy for concurrent observing warm and cold permafrost based on time of year and depth of thaw.
Observing warm permafrost will require year-round measurements of ground thermal state to detect precursors to talik onset including thaw penetration at depth (∼ 2–3 m) and late into the cold season (∼ January–February), as well as sustained cold-season C flux observations to detect changes in C balance associated decomposition and respiration of deep, old soil C. Continued monitoring of these depths will require sustained long-term measurements from deep boreholes and increasing reliance on remote sensing technologies such as electromagnetic imaging (EMI). In particular, EMI surveys along the continuous/discontinuous permafrost transition zones during the cold season from November to March are likely to provide key thermal state diagnostics. Systematic radiocarbon (14C) measurements, which can be used to partition respiration into autotrophic and heterotrophic young and old soil components (Hicks Pries et al., 2015), would provide a valuable tool to help disentangle and track future C emissions from deep permafrost, especially during the long cold season when talik enables the microbial decomposition of deep old C and is the primary source of C emissions.
Observing cold permafrost in the high Arctic is both more urgent, due to earlier shifts in C balance and larger emissions, and more complicated, due to challenging observing conditions (remote, cold, and dark) and less detectable signals in thermal state (e.g., talik) and C age (e.g., depleted in radiocarbon) change. Our results suggest that sustained observation of year-round soil thermal and hydrological profiles (soil drying; depth and duration of thaw at 1–2 m depth) using boreholes and EMI surveys and cold-season net CO2 exchange (September–October) using atmospheric CO2 sensors and eddy covariance towers can help detect changes in soil thaw and soil vs. litter respiration driving annual C balance changes. We also recommend an observing network focused on regions rich in soil organic matter, where our simulations indicate increased sensitivity of soil decomposition to warming.
Greening trends driven by high-latitude warming and CO2 fertilization have led to amplification of the contemporary C cycle, characterized by increasing photosynthetic C uptake during the short growing season and increasing respiration of recent labile soil C during the cold season (Mack et al., 2004; Piao et al., 2008; Randerson et al., 1999; Graven et al., 2013; Forkel et al., 2016; Wenzel et al., 2016; Webb et al., 2016). Our simulations of C–climate feedbacks with interactive terrestrial biogeochemistry and soil thaw dynamics indicate this trend continues mostly unabated in NHL ecosystems. However, sustained warming over the next 300 years drives accelerated permafrost degradation and soil respiration, leading to widespread shifts in the C balance of Arctic ecosystems toward long-term net C source by the end of the 23rd century. Also, 6.8 million km2 of land impacted in Siberia and North America will produce an integrated C source of 90 Pg C by 2100 and 120 Pg C by 2200. Our projected permafrost C feedback is comparable to the contemporary land use and land use change contribution to the annual C cycle.
Our main results emphasize an increasingly important impact of NHL cold-season warming on earlier spring thaw, longer non-frozen seasons, and increased depth and seasonal duration of soil thaw. Our simulations are consistent with soil thaw patterns observed from borehole time series in Siberian and North American transects during the late 20th and early 21st centuries. Patterns of deeper and longer thaw drive widespread talik and expose Arctic soils to increased warming and drying, which accelerates decomposition and respiration of deep, old C and shifts ecosystem C balance to a state increasingly dominated by soil respiration.
The timing with which Arctic ecosystems transition to long-term net C sources depends on a number of factors including talik onset, vegetation productivity, permafrost temperature, soil drying, and organic matter. The timing is most sensitive to talik onset in warm permafrost regions in the sub-Arctic, which account for a total of 3.2 million km2 of land, representing ∼ 50 % of our simulated permafrost region. These regions are also the most productive, which can delay the transition to net C source by decades or even centuries. As such, warm permafrost regions typically do not transition to net C sources until the mid-22nd century.
The cold permafrost region in the northern Arctic, which accounts for an additional 3.0 million km2 of land, transitions to net C source in the late 21st century, much earlier than warm permafrost and in the absence of talik. High decomposition rates, driven by warming and drying of shallow, young C in organic-rich soils, and low annual productivity make this region perhaps the most vulnerable to C release and subject to further amplification with future talik onset. This result is surprising given the region is dominated by tundra and underlain by deep, cold permafrost that might be thought impervious to such changes.
Rather than thinking of the permafrost feedback as being primarily driven by a single coherent geographic front driven by talik formation along the retreating boundary of the permafrost zone, this analysis suggests multiple modes of permafrost thaw with a mosaic of processes acting in different locations. C sink-to-source transitions are caused by active layer deepening in some regions, talik-driven permafrost loss in others, fire-driven changes in other places, and thaw-led hydrologic change in yet others. Our results reveal a complex interplay of amplified contemporary and old C cycling that will require detailed monitoring of soil thermal properties (cold-season thaw depth, talik formation), soil organic matter content, soil C age profiles, systematic CO2 flux, and atmospheric 14CO2 measurements to detect and attribute future C sources. Further investigation of soil thermal properties and thaw patterns is required to understand C balance shifts and potential further amplification of emissions from high northern latitudes.
All model projections of soil and vegetation properties used in this study are available at http://portal.nersc.gov/archive/home/c/cdkoven/www/clm45_permafrostsims/permafrostRCN_modeldata/.
The authors declare that they have no conflict of interest.
David M. Lawrence is supported by US Department of Energy, Office of
Biological and Environmental Research grant DE-FC03-97ER62402/A0101.
Charles D. Koven is supported by the Director, Office of Science, Office of
Biological and Environmental Research of the US Department of Energy (DOE)
under Contract DE-AC02-05CH11231 as part of their Regional and Global Climate
Modeling (BGC-Feedbacks SFA), and Terrestrial Ecosystem Science Programs
(NGEE-Arctic), and used resources of the National Energy Research Scientific
Computing Center, also supported by the Office of Science of the US
Department of Energy, under Contract DE-AC02-05CH11231. National Center for
Atmospheric Research (NCAR) is sponsored by the National Science Foundation
(NSF). The CESM project is supported by the NSF and the Office of Science
(BER) of the US Department of Energy. Computing resources were provided by
the Climate Simulation Laboratory at NCAR's Computational and Information
Systems Laboratory, sponsored by NSF and other agencies. Some of the research
described in this paper was performed for CARVE, an Earth Ventures (EV-1)
investigation, under contract with NASA. A portion of this research was
carried out at JPL, California Institute of Technology, under contract with
NASA.
Edited by: Moritz Langer
Reviewed by: two anonymous referees
Abbott, B. W., Jones, J. B., Schuur, E. A. G., et al.: Biomass offsets little or none of permafrost carbon release from soils, streams, and wildfire: an expert assessment, Environ. Res. Lett., 11, 34014, https://doi.org/10.1088/1748-9326/11/3/034014, 2016.
Barichivich, J., Briffa, K. R., Myneni, R. B., Osborn, T. J., Melvin, T. M., Ciais, P., Piao, S., and Tucker, C.: Large-scale variations in the vegetation growing season and annual cycle of atmospheric CO2 at high northern latitudes from 1950 to 2011, Glob. Change Biol., 19, 3167–3183, https://doi.org/10.1111/gcb.12283, 2013.
Belshe, E. F., Schuur, E. A. G., and Bolker, B. M.: Tundra ecosystems observed to be CO2 sources due to differential amplification of the carbon cycle, Ecol. Lett., 16, 1307–1315, https://doi.org/10.1111/ele.12164, 2013.
Brown, J., Ferrians Jr., O. J., Heginbottom, J. A., and Melnikov, E. S.: Circum-Arctic map of permafrost and ground-ice conditions, National Snow and Ice Data Center/World Data Center for Glaciology, Boulder, CO, digital media, available at: http://nsidc.org, 2001.
Christensen, J. H., Krishna Kumar, K., Aldrian, E., An, S.-I., Cavalcanti, I. F. A., de Castro, M., Dong, W., Goswami, P., Hall, A., Kanyanga, J. K., Kitoh, A., Kossin, J., Lau, N.-C., Renwick, J., Stephenson, D. B., Xie, S.-P., and Zhou, T.: Climate Phenomena and their Relevance for Future Regional Climate Change, in: Climate Change 2013: The Physical Sci- ence Basis. Contribution of Working Group I to the Fifth Assessment Report of the Intergovernmental Panel on Climate Change, edited by: Stocker, T. F., Qin, D., Plattner, G.-K., Tignor, M., Allen, S. K., Boschung, J., Nauels, A., Xia, Y., Bex, V., and Midgley, P. M., Cambridge University Press, Cambridge, UK, New York, NY, USA, 2013.
Ciais, P., Sabine, C., Bala, G., Bopp, L., Brovkin, V., Canadell, J., Chhabra, A., DeFries, R., Galloway, J., Heimann, M., Jones, C., Le Quéré, C., Myneni, R. B., Piao, S., and Thornton, P.: Carbon and Other Biogeochemical Cycles, in: Climate Change 2013: The Physical Science Basis. Contribution of Working Group I to the Fifth Assessment Report of the Intergovernmental Panel on Climate Change, edited by: Stocker, T. F., Qin, D., Plattner, G.-K., Tignor, M., Allen, S. K., Boschung, J., Nauels, A., Xia, Y., Bex, V., and Midgley, P. M., Cambridge University Press, Cambridge, UK, New York, NY, USA, 2013.
Commane, R., Lindaas, J., Benmergui, J., Luus, K. A., Chang, R. Y., Daube, B. C., Euskirchen, E. S., Henderson, J. M., Karion, A., Miller, J. B., and Miller, S. M.: Carbon dioxide sources from Alaska driven by increasing early winter respiration from Arctic tundra, P. Natl. Acad. Sci. USA, 1–6, https://doi.org/10.1073/pnas.1618567114, 2017.
Euskirchen, E. S., Bret-Harte, M. S., Scott, G. J., Edgar, C., and Shaver, G. R.: Seasonal patterns of carbon dioxide and water fluxes in three representative tundra ecosystems in northern Alaska, Ecosphere, 3, 1–9, https://doi.org/10.1890/ES11-00202.1, 2012.
Forkel, M., Carvalhais, N., Rödenbeck, C., Keeling, R., Heimann, M., Thonicke, K., Zaehle, S., and Reichstein, M.: Enhanced seasonal CO2 exchange caused by amplified plant productivity in northern ecosystems, Science, 351, 6274, https://doi.org/10.1126/science.aac4971, 2016.
Fraser, R. H., Lantz, T. C., Olthof, I., Kokelj, S. V., and Sims, R. A.: Warming-induced shrub expansion and lichen decline in the western Canadian Arctic, Ecosystems, 17, 1151–1168, https://doi.org/10.1007/s10021-014-9783-3, 2014.
Goulden, M. L.: Sensitivity of boreal forest carbon balance to soil thaw, Science, 279, 214–217, https://doi.org/10.1126/science.279.5348.214, 1998.
Graven, H. D., Keeling, R. F., Piper, S. C., Patra, P. K., Stephens, B. B., Wofsy, S. C., Welp, L. R., Sweeney, C., Tans, P. P., Kelley, J. J., and Daube, B. C.: Enhanced seasonal exchange of CO2 by northern ecosystems since 1960, Science, 341, 1085–1089, https://doi.org/10.1126/science.1239207, 2013.
Hicks Pries, C. E., Logtestijn, R. S., Schuur, E. A., Natali, S. M., Cornelissen, J. H., Aerts, R., and Dorrepaal, E.: Decadal warming causes a consistent and persistent shift from heterotrophic to autotrophic respiration in contrasting permafrost ecosystems, Glob. Change Biol., 21, 4508–4519, https://doi.org/10.1111/gcb.13032, 2015.
Hugelius, G., Tarnocai, C., Broll, G., Canadell, J. G., Kuhry, P., and Swanson, D. K.: The Northern Circumpolar Soil Carbon Database: spatially distributed datasets of soil coverage and soil carbon storage in the northern permafrost regions, Earth Syst. Sci. Data, 5, 3–13, https://doi.org/10.5194/essd-5-3-2013, 2013.
Hugelius, G., Strauss, J., Zubrzycki, S., Harden, J. W., Schuur, E. A. G., Ping, C.-L., Schirrmeister, L., Grosse, G., Michaelson, G. J., Koven, C. D., O'Donnell, J. A., Elberling, B., Mishra, U., Camill, P., Yu, Z., Palmtag, J., and Kuhry, P.: Estimated stocks of circumpolar permafrost carbon with quantified uncertainty ranges and identified data gaps, Biogeosciences, 11, 6573–6593, https://doi.org/10.5194/bg-11-6573-2014, 2014.
Jackson, R. B., Lajtha, K., Crow, S. E., Hugelius, G., Kramer, M. G., and Piñeiro, G: The ecology of soil carbon: pools, vulnerabilities, and biotic and abiotic controls, Annu. Rev. Ecol. Evol. S., 48, 419–445, https://doi.org/10.1146/annurev-ecolsys-112414-054234, 2017.
Jorgenson, M. T. and Osterkamp, T. E.: Response of boreal ecosystems to varying modes of permafrost degradation, Can. J. Forest Res., 35, 2100–2111, https://doi.org/10.1139/x05-153, 2005.
Jorgenson, M. T., Romanovsky, V., Harden, J., Shur, Y., O'Donnell, J., Schuur, E. A., Kanevskiy, M., and Marchenko, S.: Resilience and vulnerability of permafrost to climate change, Can. J. Forest Res., 40, 1219–1236, https://doi.org/10.1139/X10-060, 2010.
Koven, C., Friedlingstein, P., Ciais, P., Khvorostyanov, D., Krinner, G., and Tarnocai, C.: On the formation of high-latitude soil carbon stocks: effects of cryoturbation and insulation by organic matter in a land surface model, Geophys. Res. Lett., 36, 1–5, https://doi.org/10.1029/2009GL040150, 2009.
Koven, C. D., Ringeval, B., Friedlingstein, P., Ciais, P., Cadule, P., Khvorostyanov, D., Krinner, G., and Tarnocai, C.: Permafrost carbon-climate feedbacks accelerate global warming, P. Natl. Acad. Sci. USA, 108, 14769–74, https://doi.org/10.1073/pnas.1103910108, 2011.
Koven, C. D., Riley, W. J., and Stern, A.: Analysis of permafrost thermal dynamics and response to climate change in the CMIP5 earth system models, J. Climate, 26, 1877–1900, https://doi.org/10.1175/JCLI-D-12-00228.1, 2013.
Koven, C. D., Lawrence, D. M., and Riley, W. J.: Permafrost carbon-climate feedback is sensitive to deep soil carbon decomposability but not deep soil nitrogen dynamics, P. Natl. Acad. Sci. USA, 112, 3752–7, https://doi.org/10.1073/pnas.1415123112, 2015.
Lawrence, D. M. and Slater, A. G.: Incorporating organic soil into a global climate model, Clim. Dynam., 30, 145–160, https://doi.org/10.1007/s00382-007-0278-1, 2008.
Lawrence, D. M., Slater, A. G., Romanovsky, V. E., and Nicolsky, D. J.: Sensitivity of a model projection of near-surface permafrost degradation to soil column depth and representation of soil organic matter, J. Geophys. Res.-Earth, 113, https://doi.org/10.1029/2007JF000883, 2008.
Lawrence, D. M., Oleson, K. W., Flanner, M. G., Thornton, P. E., Swenson, S. C., Lawrence, P. J., Zeng, X., Yang, Z.-L., Levis, S., Sakaguchi, K., Bonan, G. B., and Slater, A. G.: Parameterization improvements and functional and structural advances in Version 4 of the community land model, J. Adv. Model. Earth Syst., 3, M03001, https://doi.org/10.1029/2011MS00045, 2011.
Lawrence, D. M., Slater, A. G., and Swenson, S. C.: Simulation of present-day and future permafrost and seasonally frozen ground conditions in CCSM4, J. Climate, 25, 2207–2225, https://doi.org/10.1175/JCLI-D-11-00334.1, 2012.
Lawrence, D. M., Koven, C. D., Swenson, S. C., Riley, W. J., and Slater, A.G.: Permafrost thaw and resulting soil moisture changes regulate projected high-latitude CO2 and CH4 emissions, Environ. Res. Lett., 10, 94011, https://doi.org/10.1088/1748-9326/10/9/094011, 2015.
Mack, M. C., Schuur, E. A., Bret-Harte, M. S., Shaver, G. R., and Chapin, F. S.: Ecosystem carbon storage in arctic tundra reduced by long-term nutrient fertilization, Nature, 431, 440–443, https://doi.org/10.1038/nature02887, 2004.
McGuire, A. D., Christensen, T. R., Hayes, D., Heroult, A., Euskirchen, E., Kimball, J. S., Koven, C., Lafleur, P., Miller, P. A., Oechel, W., Peylin, P., Williams, M., and Yi, Y.: An assessment of the carbon balance of Arctic tundra: comparisons among observations, process models, and atmospheric inversions, Biogeosciences, 9, 3185–3204, https://doi.org/10.5194/bg-9-3185-2012, 2012.
Natali, S. M., Schuur, E. A. G., and Rubin, R. L.: Increased plant productivity in Alaskan tundra as a result of experimental warming of soil and permafrost, J. Ecol., 100, 488–498, https://doi.org/10.1111/j.1365-2745.2011.01925.x, 2012.
Natali, S. M., Schuur, E. A. G., Webb, E. E., Hicks Pries, C. E., and Crummer, K. G.: Permafrost degradation stimulates carbon loss from experimentally warmed tundra, Ecology, 95, 602–608, 2014.
O'Donnell, J. A., Romanovsky, V. E., Harden, J. W., and McGuire, A. D.: The effect of moisture content on the thermal conductivity of moss and organic soil horizons from black spruce ecosystems in interior Alaska, 174, 646–651, 2009.
Oechel, W. C., Laskowski, C. A., Burba, G., Gioli, B., and Kalhori, A. A.: Annual patterns and budget of CO2 flux in an Arctic tussock tundra ecosystem, J. Geophys. Res.-Biogeo., 19, 323–339, 2014.
Olefeldt, D. and Roulet, N. T.: Permafrost conditions in peatlands regulate magnitude, timing, and chemical composition of catchment dissolved organic carbon export, Glob. Change Biol., 20, 3122–3136, 2014.
Oleson, K. W.: Technical description of version 4.5 of the Community Land Model (CLM), Natl. Cent. Atmos., Res Tech. Note NCAR/TN-503 + STR, 2013.
Parazoo, N. C., Commane, R., Wofsy, S. C., Koven, C. D., Sweeney, C., Lawrence, D. M., Lindaas, J., Chang, R. Y. W., and Miller, C. E.: Detecting regional patterns of changing CO2 flux in Alaska, P. Natl. Acad. Sci. USA, 113, 7733–7738, 2016.
Piao, S., Ciais, P., Friedlingstein, Pi., Peylin, P., Reichstein, M., Luyssaert, S., Margolis, H., Fang, J., Barr, A., Chen, A., Grelle, A., Hollinger, D. Y., Laurila, T., Lindroth, A., Richardson, A. D., and Vesala, T.: Net carbon dioxide losses of northern ecosystems in response to autumn warming, Nature, 451, 49–52, doi:10.1038/nature06444, 2008.
Ping, C. L., Jastrow, J. D., Jorgenson, M. T., Michaelson, G. J., and Shur, Y. L.: Permafrost soils and carbon cycling, SOIL, 1, 147–171, https://doi.org/10.5194/soil-1-147-2015, 2015.
Randerson, J. T., Thompson, M. V., Conway, T. J., Fung, I. Y., and Field, C. B.: The contribution of terrestrial sources and sinks to trends in the seasonal cycle of atmospheric carbon dioxide, Global Biogeochem. Cy., 11, 535–560, 1997.
Riley, W. J., Subin, Z. M., Lawrence, D. M., Swenson, S. C., Torn, M. S., Meng, L., Mahowald, N. M., and Hess, P.: Barriers to predicting changes in global terrestrial methane fluxes: analyses using CLM4Me, a methane biogeochemistry model integrated in CESM, Biogeosciences, 8, 1925–1953, https://doi.org/10.5194/bg-8-1925-2011, 2011.
Romanovsky, V. E. and Osterkamp, T. E.: Effects of unfrozen water on heat and mass transport processes in the active layer and permafrost, Permafrost Periglac., 11, 219–239, 2000.
Romanovsky, V. E., Sazonova, T. S., Balobaev, V. T., Shender, N. I., and Sergueev, D. O.: Past and recent changes in air and permafrost temperatures in eastern Siberia, Global Planet. Change, 56, 339-413, 2007.
Schuur, E. A., Vogel, J. G., Crummer, K. G., Lee, H., Sickman, J. O., and Osterkamp, T. E.: The effect of permafrost thaw on old carbon release and net carbon exchange from tundra, Nature, 459, 556–559, https://doi.org/10.1038/nature08031, 2009.
Schuur, E. A. G., McGuire, A. D., Schädel, C., Grosse, G., Harden, J. W., Hayes, D. J., Hugelius, G., Koven, C. D., Kuhry, P., Lawrence, D. M., and Natali, S. M.: Climate change and the permafrost carbon feedback, Nature, 520, 171–179, https://doi.org/10.1038/nature14338, 2015.
Slater, A. G. and Lawrence, D. M.: Diagnosing present and future permafrost from climate models, J. Climate, 26, 5608–5623, 2013.
Swenson, S. C., Lawrence, D. M., and Lee, H.: Improved simulation of the terrestrial hydrological cycle in permafrost regions by the Community Land Model, J. Adv. Model. Earth Syst., 4, M08002, https://doi.org/10.1029/2012MS000165, 2012.
Veraverbeke, S., Rogers, B. M., Goulden, M. L., Jandt, R. R., Miller, C. E., Wiggins, E. B., and Randerson, J. T.: Lightning as a major driver of recent large fire years in North American boreal forests, Nat. Clim. Change, 7, 529–534, https://doi.org/10.1038/nclimate3329, 2017.
Webb, E. E., Schuur, E. A., Natali, S. M., Oken, K. L., Bracho, R., Krapek, J. P., Risk, D., and Nickerson, N. R.: Increased wintertime CO2 loss as a result of sustained tundra warming, J. Geophys. Res.-Biogeos., 121, 249–265, 2016.
Wenzel, S., Cox, P. M., Eyring, V., and Friedlingstein, P.: Projected land photosynthesis constrained by changes in the seasonal cycle of atmospheric CO2, Nature, 538, 499–501, doi:10.1038/nature19772, 2016.
Yi, S., Wischnewski, K., Langer, M., Muster, S., and Boike, J.: Freeze/thaw processes in complex permafrost landscapes of northern Siberia simulated using the TEM ecosystem model: impact of thermokarst ponds and lakes, Geosci. Model Dev., 7, 1671–1689, https://doi.org/10.5194/gmd-7-1671-2014, 2014.
Zhang, K., Kimball, J. S., Kim, Y., and McDonald, K. C.: Changing freeze–thaw seasons in northern high latitudes and associated influences on evapotranspiration, Hydrol. Process., 25, 4142–4151, https://doi.org/10.1002/hyp.8350, 2011.