the Creative Commons Attribution 4.0 License.
the Creative Commons Attribution 4.0 License.
 | 15 Jun 2018
Bathymetric controls on calving processes at Pine Island Glacier
Robert D. Larter
Peter Friedl
Karsten Gohl
Kathrin Höppner
the Science Team of Expedition PS104
Pine Island Glacier is the largest current Antarctic contributor to sea-level rise. Its ice loss has substantially increased over the last 25 years through thinning, acceleration and grounding line retreat. However, the calving line positions of the stabilising ice shelf did not show any trend within the observational record (last 70 years) until calving in 2015 led to unprecedented retreat and changed the alignment of the calving front. Bathymetric surveying revealed a ridge below the former ice shelf and two shallower highs to the north. Satellite imagery shows that ice contact on the ridge was likely lost in 2006 but was followed by intermittent contact resulting in back stress fluctuations on the ice shelf. Continuing ice-shelf flow also led to occasional ice-shelf contact with the northern bathymetric highs, which initiated rift formation that led to calving. The observations show that bathymetry is an important factor in initiating calving events.
- Article
(3115 KB) -
Supplement
(16991 KB) - BibTeX
- EndNote


Ice loss from Pine Island Glacier (PIG) currently provides the largest contribution to sea-level rise from any single Antarctic glacial outlet (Shepherd et al., 2012). Ice losses from PIG and neighbouring outlets in the eastern Amundsen Sea embayment, which collectively drain about a third of the West Antarctic Ice Sheet, now account for about 5–10 % of current global mean sea-level rise (Shepherd et al., 2012; Rignot et al., 2008; Lee et al., 2012). Remote sensing data show that ice loss in this sector has increased greatly over the past 25 years through ice thinning and flow acceleration, which is triggered by thinning of the floating ice shelves at rates between 3.9 and 5.3 m yr−1 (Rignot, 2008; Rignot et al., 2008, 2014; Pritchard et al., 2009; Wingham et al., 2009). Integration of remote sensing data with oceanographic observations shows that this thinning results from enhanced basal melting driven by incursion of relatively warm Circumpolar Deep Water (CDW) onto the continental shelf (Jacobs et al., 1996, 2011; Pritchard et al., 2012; Nakayama et al., 2013; Dutrieux et al., 2014a). Precise dating of changes in sediment cores recovered beneath the PIG ice shelf indicates that the present phase of thinning and retreat was initiated in the 1940s (Smith et al., 2017), which is consistent with the hypothesis that CDW incursion increased at this time, driven by wind stress changes associated with a large El Niño event between 1939 and 1942 (Steig et al., 2012). In the 1990s the grounding line of PIG was located on a ridge in the bed which rises to 700–800 m below sea level along its crest (Rignot et al., 2014; Joughin et al., 2016). Between 1992 and 2011 the grounding line retreated 31 km at the centre of PIG, migrating to a position on the bed 400 m deeper than in 1992 (Rignot et al., 2014), after which the retreat stagnated (Konrad et al., 2018). Upstream of this grounding line position the bed steadily increases in depth for more than 200 km (Fig. S3 in the Supplement, Fretwell et al., 2013). Glaciological theory and ice sheet models imply that grounding lines are unstable on these upstream-deepening beds (Favier et al., 2014; Katz and Worster, 2010; Weertman, 1974; Schoof, 2007), raising the prospect of runaway retreat along the trunk of PIG. Ice shelves downstream of the grounding line have a buttressing effect on the grounded portion of marine-based ice streams and, therefore, are an important factor in maintaining the upstream glacier stability (Schoof, 2007; Gudmundsson, 2013). Fürst et al. (2016) showed that 87.9 % of the ice shelf at the downstream end of PIG provides back stress to the upstream glacier, highlighting that even small changes in calving behaviour may affect the upstream glacier here.
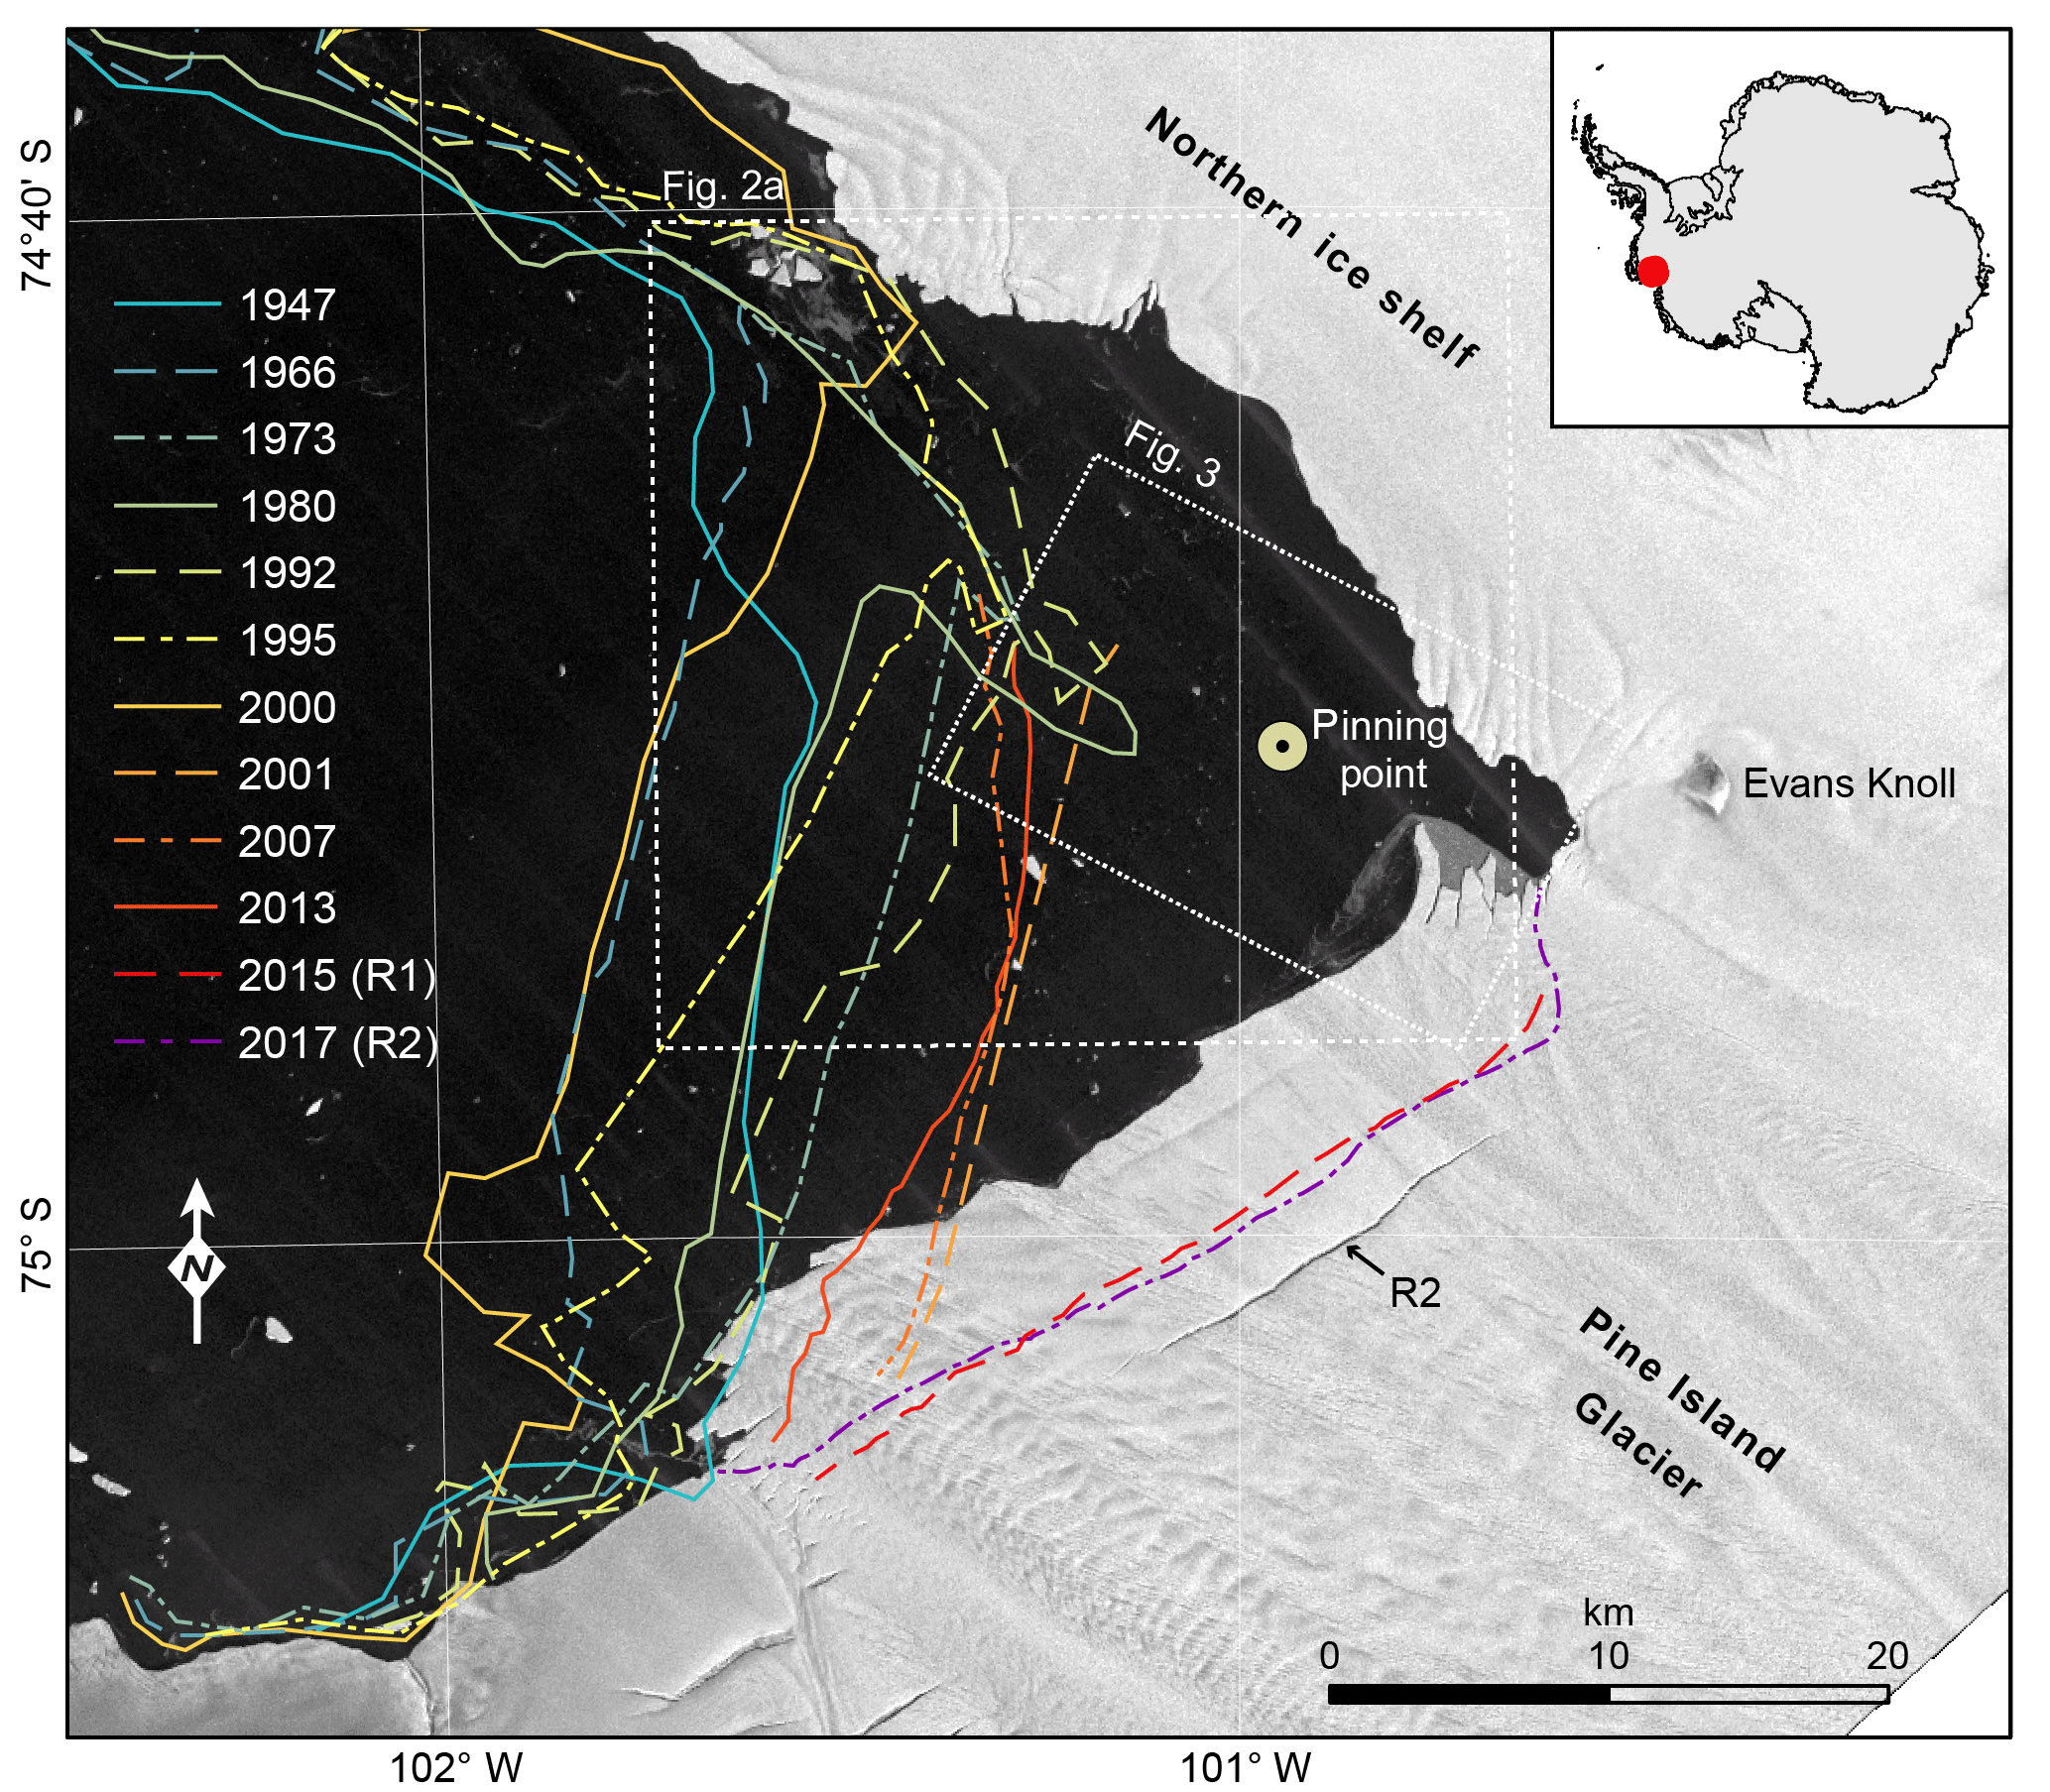
Figure 1Study area at the time of bathymetric data acquisition and past calving front positions. Satellite image (TanDEM-X ScanSAR L1b product, © DLR2017) of Pine Island Bay from 17 February 2017 at 09:36 UTC and calving front positions over the last 70 years (1947–2001 taken from Rignot, 2002, later positions are from this study). Note the reoriented calving fronts in 2015 and 2017 that were produced along rifts R1 (not visible in the satellite image) and R2, previously described by Jeong et al. (2016). The dot denotes the location of the former pinning point at which a bathymetry survey during RV Polarstern expedition PS104 revealed a ridge (see Fig. 2). Inset map marks the location in Antarctica.
Despite the thinning and flow acceleration of PIG and sustained, rapid thinning of the ice shelf over at least the past 25 years, the position of the ice front had not shown any clear trend over 68 years of observations prior to 2015 (Bindschadler, 2002; MacGregor et al., 2012; Rignot, 2002; Fig. 1). In 2011 a rift developed that 2 years later, in November 2013, resulted in calving of the 720 km2 iceberg B-31 (Bigg et al., 2014). This calving front remained in an orientation similar to that of calving fronts throughout previous decades, which were consistently aligned 10–30∘ east of north (Rignot, 2002; MacGregor et al., 2012). Less than 2 years later, in August 2015, another major calving event (580 km2 area) resulted in retreat of the northern part of the ice front to a position a further ∼ 15 km upstream of where it had been after the 2013 calving, representing the most retreated ice front position observed up until that time (Jeong et al., 2016). The August 2015 event occurred along rift R1, which had first been identified together with another, parallel rift, R2, in 2013–2014 (Jeong et al., 2016) and also resulted in a realignment of the calving front to 55∘ east of north. This new retreated and realigned calving line location has been recently reconfirmed by a calving event in September 2017 (280 km2 area) that resulted in a calving front location nearly identical to the one in 2015 (Fig. 1).
The recent retreat of the calving front presented an opportunity during the research cruise PS104 on RV Polarstern in February 2017 to survey the bathymetry of a ∼ 370 km2 area that had previously been covered by the ice shelf throughout the period for which observational records exist. This area included a bathymetric high on which the northern part of the PIG ice shelf was pinned in the past, as previously recognised (Bindschadler, 2002; Rignot, 2002). Although the existence of the pinning point was recognised, details of the bathymetry beneath the ice shelf remained poorly known, hampering the investigation of the relation between ice-shelf cavity bathymetry and calving. This is a more widespread problem as until recently the only reliable way of determining bathymetry beneath ice shelves was by seismic sounding, which requires considerable logistical investment even to obtain soundings at a spacing of several kilometres (e.g. Brisbourne et al., 2014). Two expeditions over the past decade have collected bathymetry data beneath Pine Island Glacier from autonomous underwater vehicles, but the data are limited to the vicinity of widely spaced survey lines and only cover a small fraction of the cavity area (Jenkins et al., 2010; Davies et al., 2017). Here we present continuous multibeam bathymetry data from the newly exposed area at the front of PIG together with satellite synthetic aperture radar (SAR) and optical imagery and use this unique combination of highly resolved data to investigate the role of the pinning point and other bathymetric features in the calving development of the PIG ice shelf.
2.1 Swath bathymetry
Swath bathymetric data of RV Polarstern research cruise PS104 have been acquired with the hull-mounted Teledyne Hydrosweep DS3 system. This system uses a transmitting frequency of 15.5 kHz and has 0.2 % of the water depth vertical measurement accuracy in the centre beam and up to 0.5 % of the water depth for the outer beams. The data were processed, sound-velocity corrected and edited for outliers with the CARIS HIPS and SIPS software. The sound velocity profile used was obtained from a conductivity-temperature-depth cast carried out nearby shortly before the survey. Data gridding was performed at 25 m resolution with a weighted moving average gridding algorithm in the software QPS Fledermaus.
2.2 Remote sensing
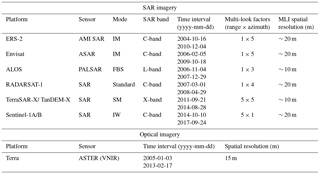
Satellite data acquired with different SAR sensors on board the European Remote Sensing Satellite 2 (ERS-2), RADARSAT-1, the Advanced Land Observing Satellite 1 (ALOS-1), Envisat, TerraSAR-X, TanDEM-X and Sentinel-1A/B as well as data from the optical Advanced Spaceborne Thermal Emission and Reflection Radiometer (ASTER) were used in order to derive a time series of images from 2002 to 2017 over the region near the bathymetric ridge (Table 1). For the SAR data, intensity images were extracted from data acquired in single-look complex (SLC) format. In order to obtain roughly square pixels on the ground and to reduce speckle noise, multi-looking was performed by applying sensor-dependent multi-look factors to the range and azimuth direction (Table 1). The resulting multi-look intensity (MLI) images were radiometrically calibrated, geocoded and orthorectified. For orthorectification the Bedmap2 digital elevation model (Fretwell et al., 2013) resampled to a 100 m spatial resolution served as a source of topographic information.
2.3 Ice thickness data
We considered trying to estimate the time of ice-shelf contact loss with the bathymetric high by comparing the bathymetry data to ice-shelf thickness measurements. However, thickness estimates from radar surveys (Vaughan et al., 2012) and those calculated from the ice-shelf freeboard measured by satellite altimetry (Chuter and Bamber, 2015; Griggs and Bamber, 2011) show differences up to ∼ 100 m. These differences probably result largely from uncertainties in the appropriate firn depth corrections and flexural effects that cause some areas of the ice shelf to deviate from hydrostatic equilibrium, but regardless of their cause, they show that ice-shelf thickness estimates are too uncertain to determine the timing of ice contact loss. Furthermore, we checked the Operation IceBridge database for ice thickness data at the location of the former pinning point, but all available flight tracks were off for some kilometres. Hence, we have not used these data in our study as ice thicknesses of the PIG ice shelf are highly variable within short distances (Dutrieux et al., 2014b).
3.1 Bathymetry
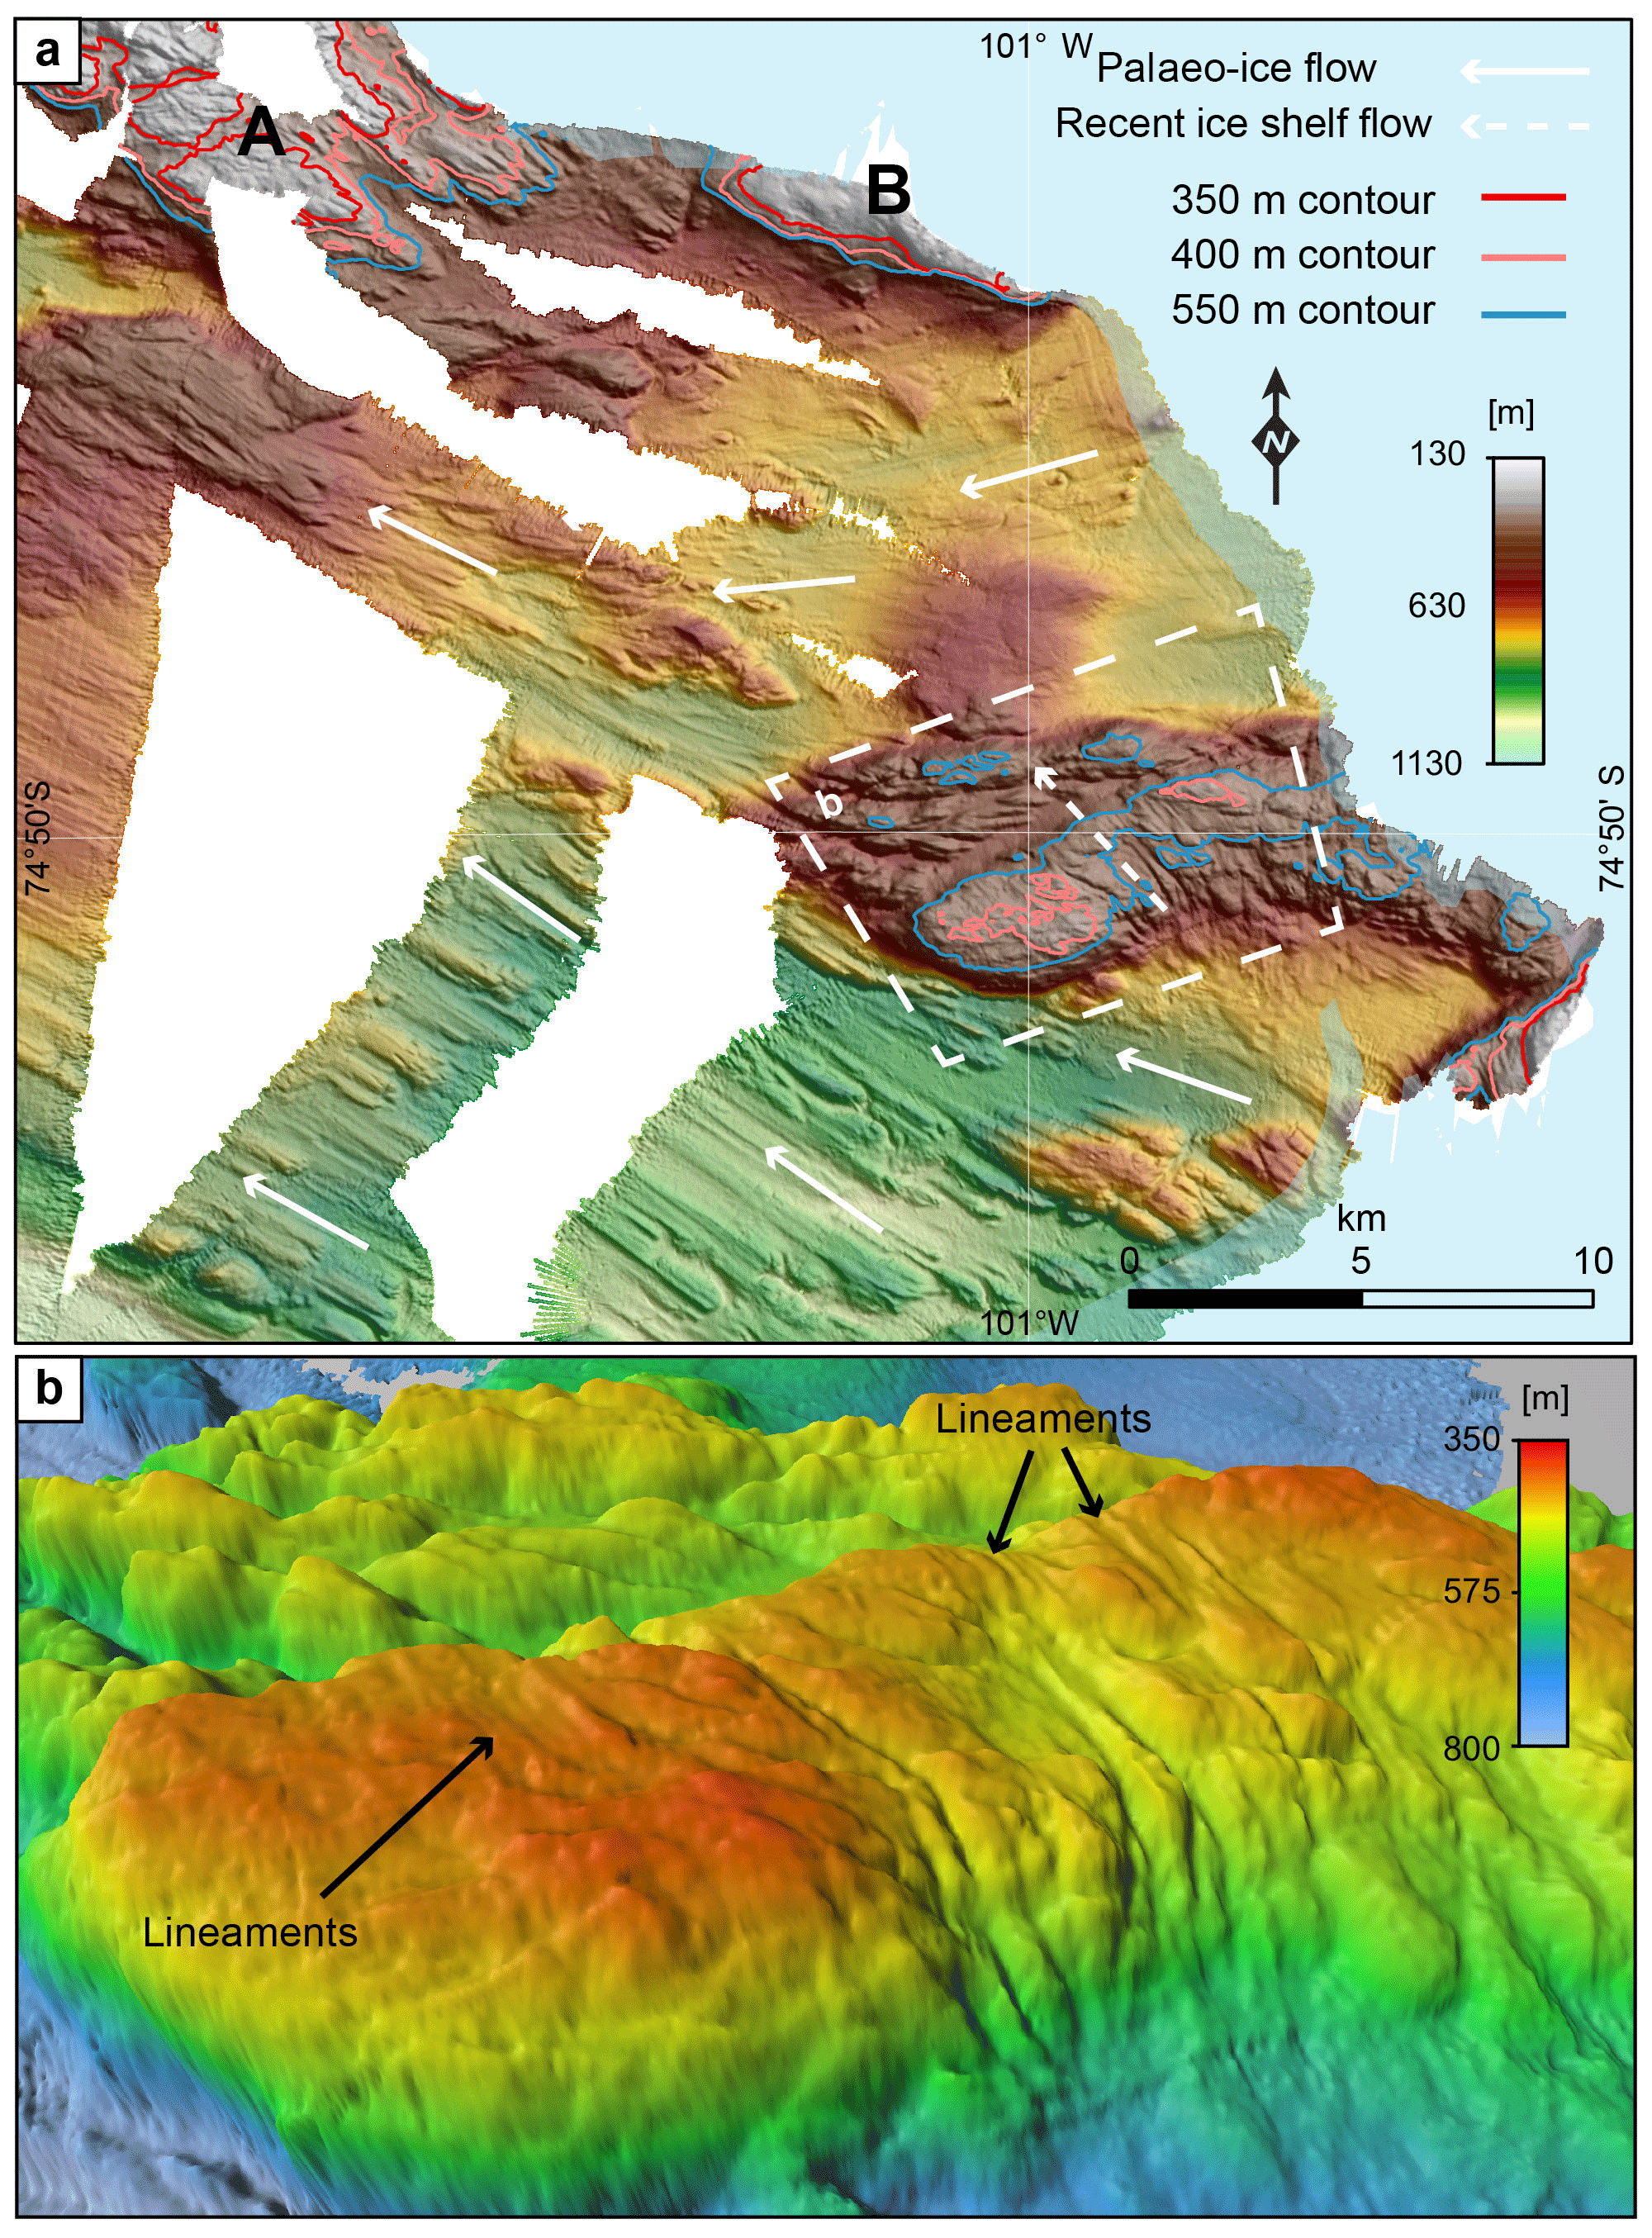
Figure 2Bathymetry of submarine ridge and adjacent sea floor at 25 m grid resolution. (a) Hill-shaded plan view with 350, 400 and 450 m contours. Note the shoal areas in the north-west, labelled A and B. Palaeo-ice flow inferred from drumlins and lineations are shown by white arrows, and direction of recent ice-shelf flow is shown by dashed arrows. Light blue area delineates ice-covered area at time of data acquisition as shown in Fig. 1. (b) 3-D view of submarine ridge showing subtle lineaments oriented in the same direction as recent ice-shelf flow on its crest.
The high-resolution bathymetry of the previously ice-shelf-covered area reveals an ENE-to-WSW-trending ridge that extends 10 km from underneath the northern ice shelf into Pine Island Bay (Figs. 2 and S3 in the Supplement). While water depths in the bay are up to 1080 m in its centre, the shallowest point on the ridge is at a water depth of only 375 m. The deepest section of the crest of the ridge is at 440 m water depth. On its edges, the ridge drops abruptly within a few hundred metres down to more than 700–800 m water depth. Sets of streamlined sea-floor landforms are visible in Pine Island Bay south of the ridge, north of the ridge and locally on the ridge itself. The orientations of these streamlined landforms are different in each of the locations. South of the ridge, their orientation is from ESE to WNW throughout the surveyed area. North of the ridge, their orientation is ENE to SWS, changing to ESE to WNW farther to the west. The streamlined features on the ridge itself are oriented SE to NW, resembling the direction of modern-day satellite-observed ice-shelf movement (Jeong et al., 2016; Rignot et al., 2011). Two other bathymetric highs are located 15 km north and 20 km north-west of the bathymetric ridge (Fig. 2a). The western bathymetric high A reaches depths shallower than 350 m. The eastern bathymetric high B has the lowest measured depth, of less than 250 m, and likely continues to the north, where a grounded portion of the northern ice shelf is present.
3.2 Ice-shelf contact with the bathymetric ridge
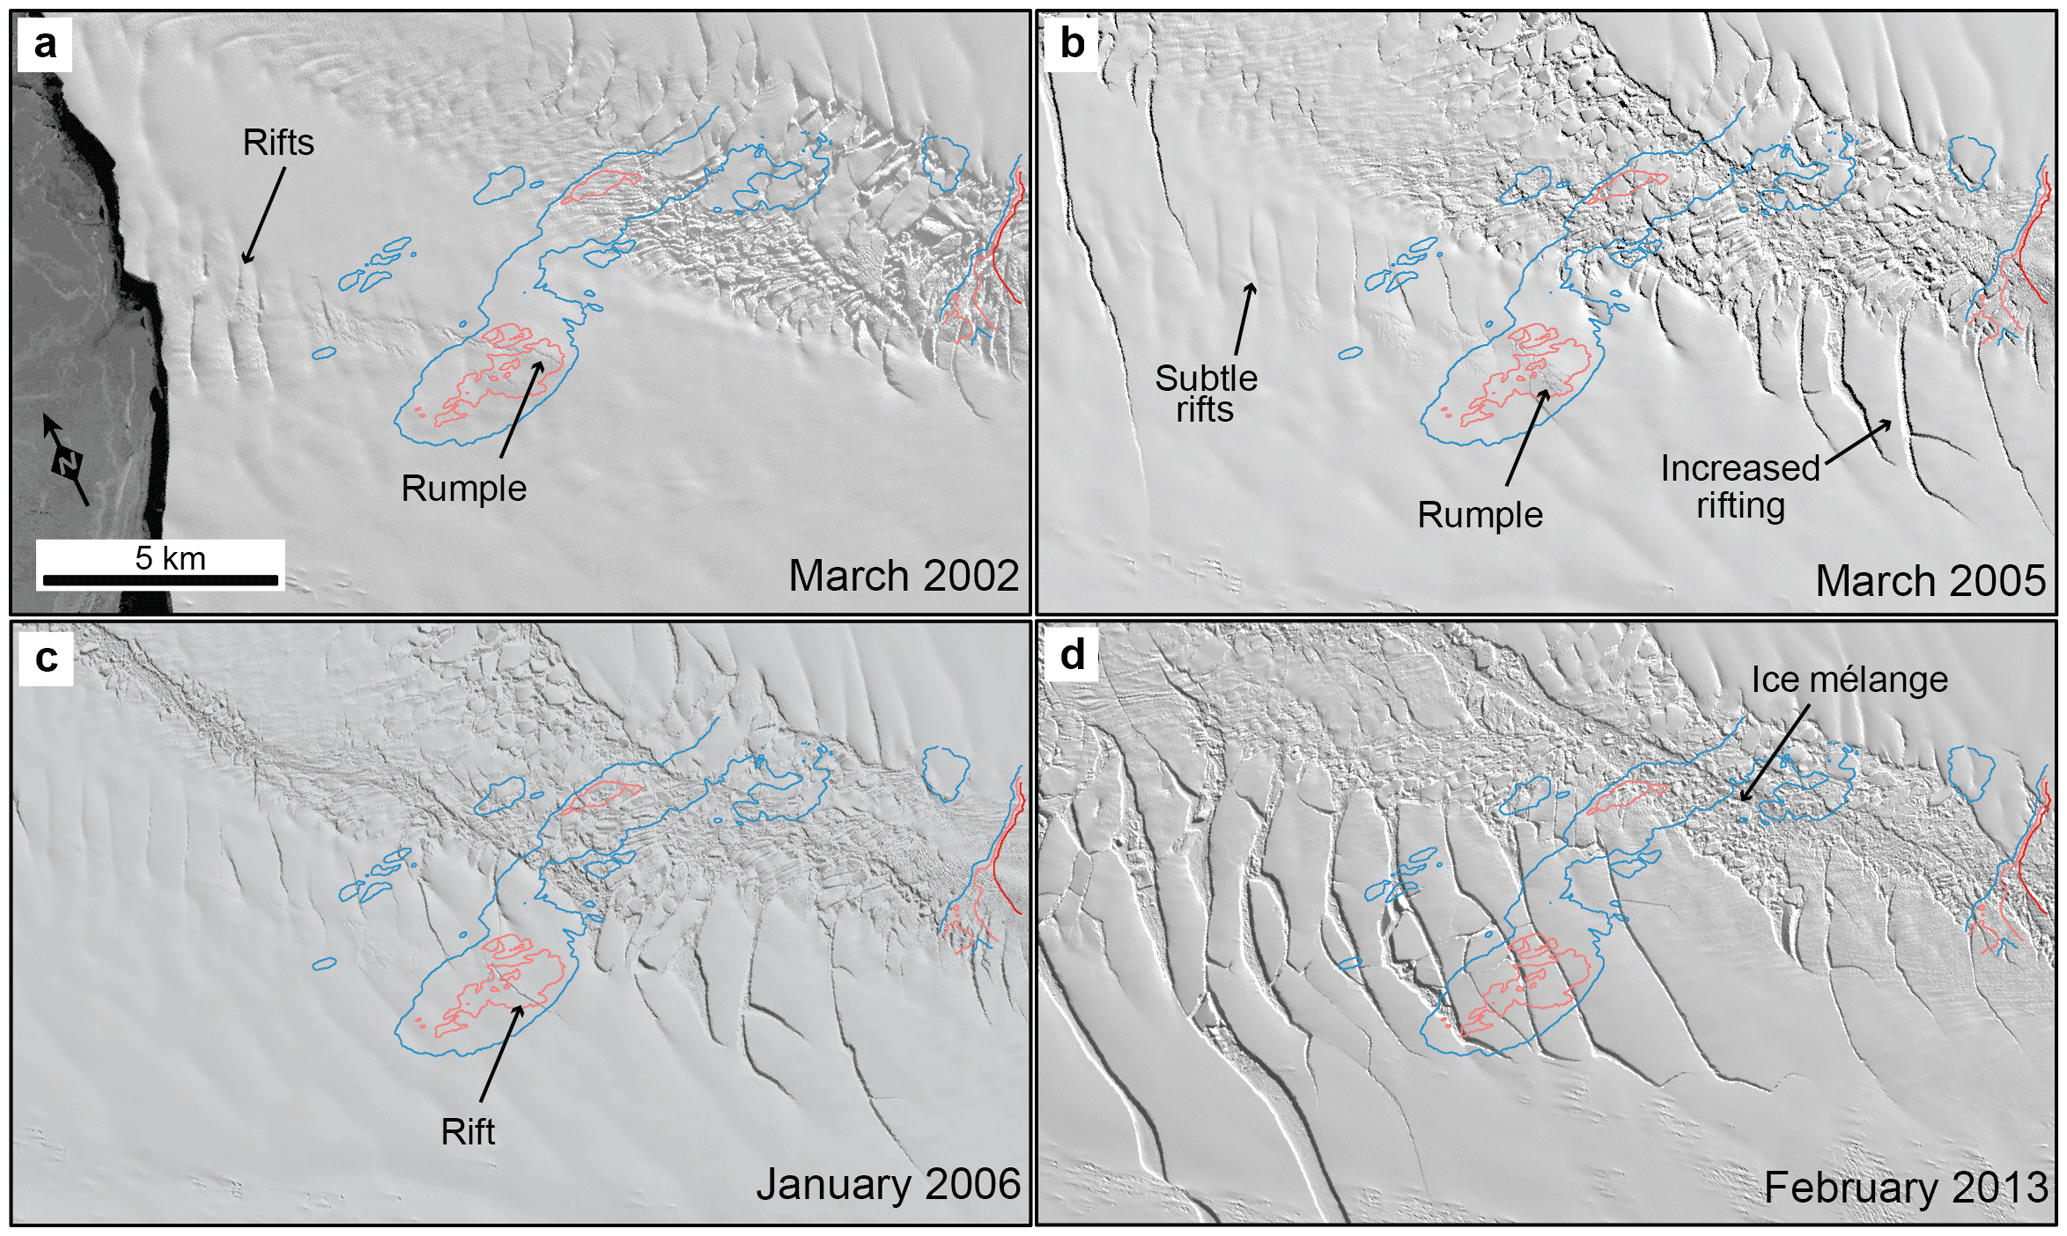
Figure 3Time series of ASTER satellite images taken from the area of the submarine ridge. Lines indicate depth contours of 350 m (dark red), 400 m (light red) and 450 m (blue). (a) Taken on 28 March 2002; note the ice rumple on top of the ridge. (b) Taken on 1 March 2005; note continued ice rumple and increased rifting in the east. (c) Taken on 18 January 2006; note the rift forming on top of the ridge. (d) Taken on 10 February 2013; note the absence of ice irregularities on top of the ridge, continuous intense rifting to its east and ice mélange to its north.
Analysis of the satellite data shows that an ice rumple was present at the location of the shallowest part of the bathymetric ridge in the past (Fig. 3; see also Movie S1 in the Supplement). These rumples were previously observed in Landsat images between January 1973 and January 2001 by Bindschadler (2002), who also described rifts oriented perpendicular to ice-shelf flow forming immediately downstream of the rumple. Three of these ∼ 3 km long rifts are still observed about 5 km downstream in an image collected in March 2002 (Fig. 3a), but since then no intense rifting has been observed and only more subtle rifts are detected downstream of the rumple. However, in images collected over the following 3 years, the ice rumple continues to be observed above the bathymetric ridge and irregularities in the ice surface originating there are carried downstream, indicating continued ice-shelf contact. The ice rumple is observed for the last time in March 2005 (Fig. 3b). A rift oriented in a NNW–SSE direction above the bathymetric ridge is visible in January 2006 (Fig. 3c). Similar rifting is not visible on younger satellite images. Therefore, this indicates that the ice shelf thinned sufficiently so that either ice contact became too light to produce imprints on the ice surface or that the ice shelf did not ground at all any more.
In the time since reduced ice contact was documented, ice rifting increasingly took place further to the east near Evans Knoll with rifts predominantly being oriented in the N–S direction. In the last years before the 2015 calving event, the rifted northern margin flowed across the bathymetric ridge with no indication of ice contact at the ice surface (Fig. 3d). However, an iceberg grounded on top of the bathymetric ridge after the calving event indicates that at least weak or intermittent ice contact was active before the calving event.
3.3 Calving events
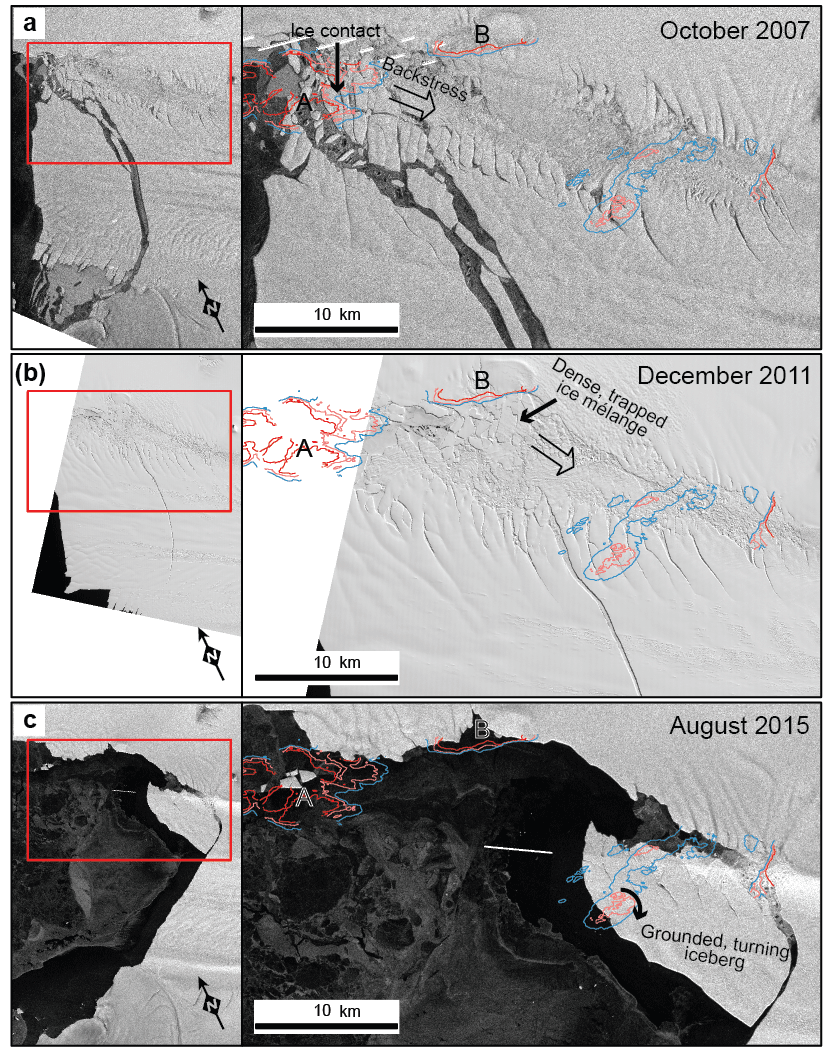
Figure 4Time series of satellite images taken shortly before or after iceberg calving events of Pine Island Glacier that took place after 2006 when last imprints of ice contact with the bathymetric ridge were observed. Lines indicate depth contours of 350 m (dark red), 400 m (light red) and 450 m (blue). (a) ERS image taken on 6 October 2007; note the curved calving line that is induced by back stress affecting the northern part of PIG ice shelf as a result of ice contact with the shallow bathymetry at A. (b) Aster image taken on 22 December 2011; note the curved calving line that is probably induced by dense iceberg mélange being trapped between the northern ice shelf near bathymetric high B and Pine Island Glacier. (c) TanDEM-X-SAR image (© DLR2015) taken on 30 August 2015; note the 1–2 km sized icebergs stuck on shallow bathymetry in top left corner and the stationary large iceberg located on top of the bathymetric ridge.
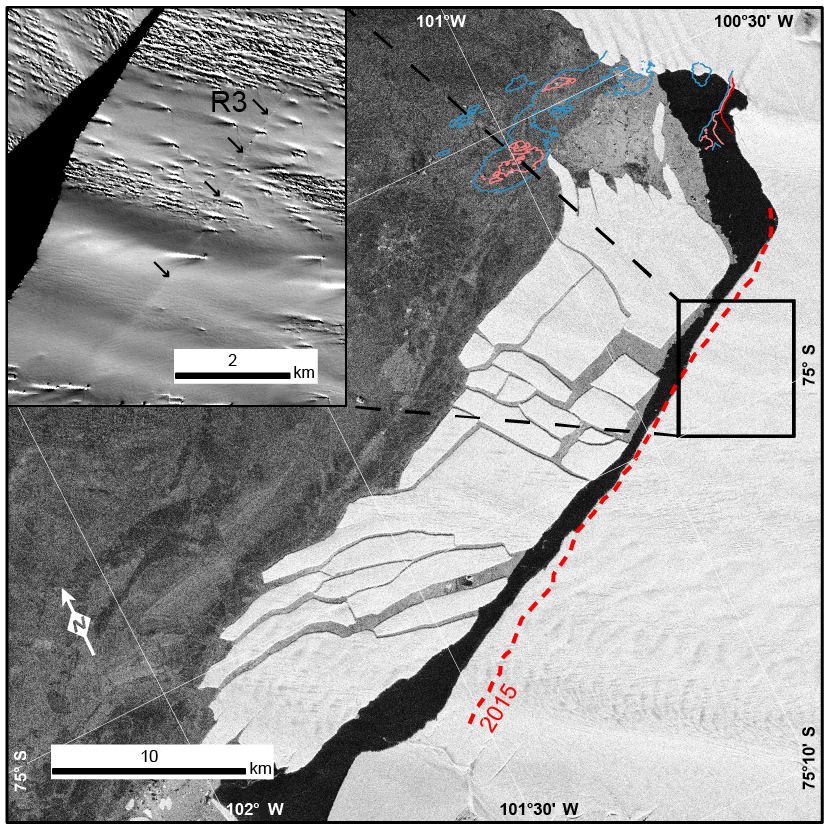
Figure 5Sentinel S1 image taken on 11 November 2017 showing the calved and subsequently fast-disintegrated iceberg after the 2017 calving event that confirmed the 2015 calving front location and orientation (dashed red line), lines indicate depth contours of 350 m (dark red), 400 m (light red) and 450 m (blue). Inset shows a Sentinel S2A image taken at a low sun angle on 13 October 2017, revealing rift R3. For location see black box in main figure.
Since the last evident ice contact between the ice shelf and bathymetric ridge was visible on the ice surface in 2006, four major calving events took place at PIG (Figs. 4 and 5). In 2007, the calving front was located approximately 8 km west of the pinning point and produced a curved calving line (Fig. 4a). At the time of rift initiation, the northern front of the PIG ice shelf moved above bathymetric high A. Four years later, in 2011, a similar rift with a curved shape appeared further to the east, this time only 2 km west of the pinning point (Fig. 4b). At this time, very dense ice mélange consisting of thick fragments of the rifted PIG margin and of the northern ice shelf was present north-west of the rift between bathymetric high B and PIG. The rift further opened from north to south and led to calving of iceberg B-31 in 2013. In the same year, an ice mélange developed north of the bathymetric ridge between PIG ice shelf and the northern ice shelf, along the downstream projection of PIG's lateral shear zone, and remained present until it disintegrated in 2014 and early 2015, immediately prior to the 2015 calving event (Jeong et al., 2016; see also Movie S2 in the Supplement). The calving occurred along one of the pair of rifts (R1) that had appeared in the ice shelf 1–2 years earlier (Jeong et al., 2016) and produced a calving front located east of the former pinning point that was linear and aligned 55∘ east of north (Fig. 4c). The calved iceberg rapidly broke apart within a month. Icebergs originating from the southern part of the ice shelf immediately drifted westward out of the region. The northern iceberg (∼ 115 km2), however, remained above the bathymetric ridge for a year, slowly rotating 90∘ in a clockwise direction around a point on the high during this time (Fig. 4c and Movie S2). Two years later, in September 2017, calving occurred along rift R2 (Fig. 5). The new calving front varied by less than 1 km from the calving line position of the 2015 event. Immediately before the calving, the ice-shelf front was still > 4 km south-east of the bathymetric ridge. The calved iceberg broke apart into > 15 parts (each ≤ 50 km2) within only 2 months. A new rift R3, located approximately 4 km upstream of the calving line with a similar orientation to R1 and R2, became visible for the first time in a satellite image taken on the 13 October 2017 (inset of Fig. 5).
The streamlined morphology visible in the new bathymetry data resembles drumlins and glacial lineations as discovered in other formerly glaciated areas. These features were produced by past ice movement with their orientation indicating the direction of ice flow at the time (Graham et al., 2009). The drumlins and lineations located in the deeper parts adjacent to the ridge show a converging flow of ice west of the ridge (Fig. 2a). In the southern part of the newly surveyed area, ice originated from PIG. In the northern part ice originated from a tributary located north of Evans Knoll. Dated sediment cores located ∼ 100 km downstream of the modern grounding line in inner Pine Island Bay suggests that the grounding line retreated from this position before at least 11.7 cal kyr BP (Hillenbrand et al., 2013). Rapid thinning of PIG at around 8 cal kyr BP has been documented by investigation of cosmogenic exposure ages of rocks from the hinterland (Johnson et al., 2014). Hence, a grounded ice stream setting forming drumlins and lineations in the deep sections of the trough was likely last active before about 8 ka. The lineaments on the bathymetric ridge, however, were likely formed at a later stage, when the ice sheet had further thinned and retreated, as indicated by their slightly different orientation. This angle coincides with the modern-day ice-flow direction of PIG ice shelf and implies that the lineaments probably formed by the ice shelf while it remained grounded on the ridge until the ice shelf sufficiently thinned or retreated. Nevertheless, we cannot rule out that multiple glacial cycles were needed to form these lineaments, as the ridge crest probably consists of resistant bedrock. Therefore, the lineaments alternatively may represent the average ice-flow direction during these glacial cycles.
Pinning point loss probably resulted from rapid thinning of the ice shelf that has occurred over the past two decades, exceeding 5 m yr−1 in recent years (Pritchard et al., 2012; Rignot et al., 2013). The time series of satellite imagery suggests that the ice shelf lost contact with the shallowest part of the bathymetric ridge at some time in 2006, or at least contact was too weak after that to produce a surface expression (Fig. 3). Weak or intermittent ice contact was also still present until the 2015 calving event, when a calved iceberg remained stationary on top of the ridge for about a year (Fig. 4c and Movie S2). These circumstances provide a relatively good timing constraint for the loss of ice-shelf contact. Hence, the glacial lineations located on top of the bathymetric ridge formed, or at least ice covered, until the last decade, making them some of the youngest submarine glacial landforms mapped in Antarctica. In addition, this detailed chronological information makes the bathymetric ridge a possible target to study benthic biological recolonisation (Gutt et al., 2011) in the Pacific realm of West Antarctica.
Since 2006 four major calving events have taken place at PIG in 2007, 2013, 2015 (Fig. 4) and 2017 (Fig. 5). These events were different in comparison to calving events before. The 2007 and 2013 calving events occurred for the first time along curved calving lines, which had not been observed before (Fig. 1). The 2015 event resulted in the most retreated calving position observed and reorientation of the calving front to 55∘ east of north, which is 25 to 45∘ clockwise in comparison to previous calving fronts (Fig. 1). The calving front also reverted to being straight, and this reorientation and straight shape were reconfirmed by the 2017 event. Pinning point loss results in reduced back stress to the ice shelf through reduction of basal drag (Favier et al., 2014) and the topography of an ice-shelf cavity is important for an internal water exchange (De Rydt et al., 2014). Therefore, in the following we evaluate how the bathymetric ridge and the two highs A and B affected the development of the PIG ice shelf.
Less than a year after imprints of ice contact with the bathymetric ridge had been imaged in satellite data for the last time (Fig. 3), a calving event led to an exceptional calving front geometry in 2007 (Figs. 1 and 4a). The satellite images do not reveal a direct link between ice contact loss at the bathymetric ridge and this calving event. However, the coincidence in the timing of arrival of the northernmost part of the PIG ice-shelf front at bathymetric high A and the propagation of the calving rift SSE from the high is evident (Movie S1). The contact of the ice-shelf front with bathymetric high A in the north-west imparted back stress to the northernmost part of the ice shelf and, hence, rift propagation occurred between ice to the SE of the high that was subject to this back stress and ice to its south that was not restrained (Fig. 4a).
In the following years, ice-shelf rifting increasingly took place further to the east (Fig. 3), where it ceases to be constrained by topography around Evans Knoll (Fig. 1), indicating that stresses were increasingly being released here rather than at the bathymetric ridge. The northern part of the large rift that formed in 2011 coincides with the N–S direction of the rifts forming near Evans Knoll (Figs. 3b and 4b). The rift propagated southwards and formed the 2013 calving front, indicating that the stress release played a role in this calving event. In addition, before rift formation the very dense mélange of icebergs north of the bathymetric ridge became trapped between the PIG and the northern ice shelf, which partly rested on bathymetric high B. In a similar way, to direct ice-shelf contact with a bathymetric high observed in 2007, this configuration imposed back stress on the northern section of the PIG ice shelf and influenced the position of the 2011 rift. Hence, the bathymetric highs A and B played an important role in both calving events, which resulted in a curved calving front by inducing sudden back stress to the PIG ice shelf, either directly via ice-shelf contact with the ridge in 2007 or indirectly via trapping a dense ice mélange in 2011.
Before the 2015 calving event, a change in ice-flow velocity and direction from 2013–2014 to 2014–2015 (Jeong et al., 2016) shows that the northern section that later on became the stationary iceberg behaved differently compared to the calved central and southern parts. In the northern section, (1) ice-flow velocity stayed nearly the same instead of increasing and (2) ice-flow direction rotated 2–3∘ clockwise instead of more or less remaining the same. This observation could indicate slight contact of ice with the bathymetric ridge in Fig. 2b, which was located on the northernmost edge of the ice shelf by then. This is supported by the observation of the stationary northern iceberg (Fig. 4c), which can only be explained by bottom contact. Ice contact that occurred even before the calving event, therefore, would explain the observed reduced flow speed in the northern ice-shelf section and the general westward flow direction of the ice shelf would have resulted in clockwise rotation with an anchor point in the north. Radar and upward-looking sonar data showed that the base of PIG ice shelf is highly irregular (Vaughan et al., 2012; Dutrieux et al., 2014b) and, therefore, suggest that the initial loss of ice contact likely would be followed by a phase of intermittent contact. Hence, the irregular ice-shelf thickness likely led to regrounding on the bathymetric ridge and triggered different ice-flow behaviour in the northern part. Furthermore, this asymmetry probably explains the rapid break-up of the calved ice due to the different rotation and forcing in the northern section.
The resulting re-orientated calving line of the 2015 event, however, was predominantly controlled by rift R1 and by the disintegration of ice mélange between PIG and the northern ice shelf as described by Jeong et al. (2016). This is supported by the 2017 calving event, which was controlled by rift R2 (Fig. 1), with the calved part being more than 4 km away from the former pinning point (Fig. S3 in the Supplement). The R1 and R2 rifts were hypothesised by Jeong et al. (2016) to originate from basal crevasses filled by warm ocean waters. Nevertheless, the pinning point loss could have contributed to the formation of these rifts through back stress changes following the initial pinning point loss around 2006 and during the period of intermittent ice contact that we have showed continued until the 2015 calving event. The alignment of these rifts between the new outermost pinning point in the north, near Evans Knoll, and the position from which a tributary glacier flows into the ice shelf in the south is consistent with this hypothesis. This observation will be an important consideration for improved understanding and modelling of the rift formation process.
Due to its morphology, in addition, the bathymetric ridge possibly played a role in clearing the ice mélange. Apart from an open marine gateway for ice into Pine Island Bay, a force is needed to push the ice mélange into the bay. Iceberg trajectories are predominantly steered by currents and wind (Death et al., 2006). Therefore, a water exchange from the ice-shelf cavity across the bathymetric ridge would support flushing the trapped icebergs westward. The ridge, being continuously shallower than 450 m, in combination with the ice shelf and icebergs trapped in the mélange (reaching drafts of hundreds of metres), however, would have limited this kind of water exchange. After sufficient thinning took place, the water column possibly reached a threshold that enabled sufficient circulation of water, allowing ice mélange disintegration.
The current calving front aligns with the new downstream-most pinning point in the north, near Evans Knoll, and where the ice shelf is under pressure from a tributary ice stream flowing into it in the south. In the decades before, when other pinning points further downstream, including the discovered bathymetric ridge, were active, this was also the case (Fig. 1). Even unpinning PIG in the 1970s from the crest of a ridge located 30 km upstream of the former calving line that rises to ∼ 700 m below sea level in the centre of the ice shelf (Jenkins et al., 2010; Smith et al., 2017) did not result in calving line retreat in the following decades (MacGregor et al., 2012) as pinning points further downstream remained active. This correlation suggests that the final pinning/constriction points are an important control on the orientation of the calving line of PIG. However, in a thinner ice shelf, crevasses that developed in the glacier upstream of the grounding line will penetrate a greater fraction of the total thickness, and therefore they are more likely to control calving positions (Yu et al., 2017; Bassis and Jacobs, 2013; Bassis and Walker, 2011). Hence, we cannot exclude that the change in calving line orientation is a result of thinning and ocean melting of basal crevasses as suggested by Jeong et al. (2016). It is possibly enhanced by back stress variations due to intermittent ice contact with the bathymetric ridge between 2006 and 2015, and is not solely constrained by the outermost pinning points.
Konrad et al. (2017) show how changes to the ice shelf and grounding line region of PIG and other Amundsen Sea embayment glaciers propagate upstream on a timescale of a few years. Thus, the recent reduction of back stress can be expected to propagate to the grounded trunk of PIG, causing further acceleration of flow and thus further dynamic thinning. Accordingly, a restabilisation of the ice shelf due to repinning at a ridge, e.g. by a very rapid advance or thickening of the ice shelf, cannot be expected in the foreseeable future, at least for as long as rapid basal melting driven by CDW incursion continues. Instead, the ice-shelf calving line seems to have made an irreversible step to a new position and orientation in 2015, which has been confirmed in 2017, following progressive detachment from the pinning point over the previous decade. We do not expect further significant rapid calving line retreat in the next few years. The northern margin is now stabilised by a pinning point near Evans Knoll, which rises above sea level where the nearby ice-shelf thickness is about 450 m, and the southern margin is stabilised by thick tributary ice inflow (Fretwell et al., 2013). Nevertheless, continued rapid ice-shelf thinning as observed in other studies (Pritchard et al., 2012; Rignot et al., 2013) and as confirmed by our observation of pinning point loss (Fig. 3) will further destabilise the PIG ice shelf in the future and at some stage is expected to lead to calving occurring even further upstream. Rapid iceberg disintegration into smaller sized icebergs after the two most recent calving events took place within 1–2 months (maximum size ∼ 115 km2 in 2015 and ∼ 50 km2 in 2017, Figs. 4 and 5) in contrast to previous calving events that resulted in stable large icebergs, e.g. B-31 (720 km2, Bigg et al., 2014), and possibly reflect this destabilising trend. The newly discovered rift R3 (inset of Fig. 5) will likely trigger the next calving event. In comparison to the 2015 (10–20 km) and 2017 (8 km) calving event, R3 is located only 4 km upstream of the current calving front, therefore indicating that the trend to smaller sized icebergs will persist.
Multibeam bathymetry data from a previously ice-shelf-covered area revealed a bathymetric ridge that rises to 375 m at its shallowest point and two shallower bathymetric highs, A and B, to the north.
The bathymetric ridge acted as a pinning point to the PIG until 2006. Between 2006 and 2015 ice contact likely persisted at least intermittently and induced variable back stress to PIG.
Four calving events have occurred since 2006. The 2007 event is a result of back stress induced by bathymetric high A to the north-eastern part of PIG after ice front advance to the high. The 2013 event resulted from back stress induced by a dense ice mélange trapped between PIG and bathymetric high B. The 2015 event was triggered by clearing of a northern ice mélange and rift R1 as suggested by Jeong et al. (2016). The 2017 event was triggered by rift R2 and the next calving will likely occur along the newly identified rift R3. These rifts align with the terminal ice-shelf stabilising points to the north and south and calving occurred when they migrated past the stabilising points. We suggest that (a) reduced and variable back stress after 2006 favoured the formation of these rifts, (b) the clearing of the ice mélange was constrained by water flux over the bathymetric ridge and (c) the light ice-shelf contact with the ridge initiated the final break-up in 2015.
In the last decade, the size of calved icebergs has shrunk and their speed of disintegration accelerated, possibly due to ice-shelf destabilisation by continuous rapid ice-shelf thinning.
The bathymetric data are available at https://doi.org/doi:10.1594/PANGAEA.881546 (Arndt, 2017). The processed satellite images are available upon request from the authors.
The supplement related to this article is available online at: https://doi.org/10.5194/tc-12-2039-2018-supplement.
Karsten Gohl (Alfred Wegener Institute Helmholtz Centre for Polar and Marine Research, Bremerhaven, Germany), Victoria Afanasyeva (VNIIOkeangeologia, St. Petersburg, Russia), Jan Erik Arndt (Alfred Wegener Institute, Germany), Torsten Bickert (MARUM – Center for Marine Environmental Sciences University of Bremen, Bremen, Germany), Steve Bohaty (National Oceanographic Centre, Southhampton, UK), Ricarda Dziadek (Alfred Wegener Institute, Germany), Benjamin Ebermann (Technical University of Dresden, Dresden, Germany), Werner Ehrmann (University of Leipzig, Leipzig, Germany), Oliver Esper (Alfred Wegener Institute, Germany), Thomas Frederichs (MARUM, Germany), Tim Freudenthal (MARUM), Catalina Gebhardt (Alfred Wegener Institute, Germany), Claus-Dieter Hillenbrand (British Antarctic Survey, Cambridge, UK), Katharina Hochmuth (Alfred Wegener Institute, Germany), Johann Klages (Alfred Wegener Institute), Kevin Küssner (Alfred Wegener Institute, Germany), Robert Larter (British Antarctic Survey), Yanina Najman (Lancaster University, Lancaster, UK), Heiko Pälike (MARUM), Florian Riefstahl (Alfred Wegener Institute), Thomas Ronge (Alfred Wegener Institute), Mirko Scheinert (Technical University of Dresden, Germany), Patric Simões Pereira (Imperial Colledge, London, United Kingdom), James Smith (British Antarctic Survey, UK), Gabriele Uenzelmann-Neben (Alfred Wegener Institute, Germany), Tina van de Flierdt (Imperial Colledge), Max Zundel (University of Bremen, Bremen, Germany).
JEA, RDL and KG developed the concept of this paper. JEA was responsible for bathymetry data acquisition and processing. PF and KH were responsible for satellite data acquisition and processing. JEA and RDL led the writing of this paper and all authors contributed to the development of the paper.
The authors declare that they have no conflict of interest.
The TerraSAR-X acquisitions during the RV Polarstern's expedition
PS104 were provided by DLR through the TerraSAR-X science project OCE3373
(Fig. 1) and the TanDEM-X science proposal XTI_GLAC7015 (Fig. 4c, Movie S2
in the Supplement). The ERS and Envisat data were provided free of charge by
ESA via the Earth Observation Link (EOLi) client. Sentinel-1 data were
downloaded from ESA's Copernicus Open Access Hub. We thank JAXA for providing
the ALOS PALSAR data and Matthias Braun (University of Erlangen-Nuremberg)
for kindly sharing processed RADARSAT-1 intensity images. ASTER data from the
L1B Orthorectifed Registered Radiance at the Sensor V003 Product (AST14OTH)
were retrieved via the NASA Reverb portal. We thank the crew of RV
Polarstern and the scientific staff on board during expedition PS104
for their help and assistance. We thank John B. Anderson, Lauren M. Simkins,
Seongsu Jeong and an anonymous reviewer for comments on a previous version of
this manuscript and Seongsu Jeong for sharing the Sentinel S2A image, showing
rift R3. Jan Erik Arndt was funded by the Deutsche Forschungsgemeinschaft
(DFG, German Research Foundation) – AR 1087/1-1. This study is part of the
PACES II (Polar Regions and Coasts in the changing Earth System) programme of
the Alfred-Wegener-Institut and the Polar Science for Planet Earth Programme
of the British Antarctic Survey.
The article processing charges for this open-access
publication were covered by a Research
Centre of the
Helmholtz Association.
Edited by: Chris R. Stokes
Reviewed by: Lauren Simkins and one anonymous referee
Arndt, J. E.: Bathymetry measured near Pine Island Glacier during POLARSTERN cruise PS104, link to GeoTIFF, PANGAEA, https://doi.org/10.1594/PANGAEA.881546, 2017.
Bassis, J. N. and Jacobs, S.: Diverse calving patterns linked to glacier geometry, Nat. Geosci., 6, 833–836, https://doi.org/10.1038/ngeo1887, 2013.
Bassis, J. N. and Walker, C. C.: Upper and lower limits on the stability of calving glaciers from the yield strength envelope of ice, P. Roy. Soc. A-Math. Phy., 468, 913–931, https://doi.org/10.1098/rspa.2011.0422, 2012.
Bigg, G. R., Marsh, R. A., Wilton, D. J., and Ivchenko, V.: B31 – a giant iceberg in the Southern Ocean, Ocean Challenge, 20, 32–34, 2014.
Bindschadler, R. A.: History of lower Pine Island Glacier, West Antarctica, from Landsat imagery, J. Glaciol., 48, 536–544, https://doi.org/10.3189/172756502781831052, 2002.
Brisbourne, A. M., Smith, A. M., King, E. C., Nicholls, K. W., Holland, P. R., and Makinson, K.: Seabed topography beneath Larsen C Ice Shelf from seismic soundings, The Cryosphere, 8, 1–13, https://doi.org/10.5194/tc-8-1-2014, 2014.
Chuter, S. J. and Bamber, J. L.: Antarctic ice shelf thickness from CryoSat-2 radar altimetry, Geophys. Res. Lett., 42, 10721–710729, https://doi.org/10.1002/2015GL066515, 2015.
Davies, D., Bingham, R. G., Graham, A. G. C., Spagnolo, M., Dutrieux, P., Vaughan, D. G., Jenkins, A., and Nitsche, F. O.: High-resolution sub-ice-shelf seafloor records of twentieth century ungrounding and retreat of Pine Island Glacier, West Antarctica, J. Geophys. Res.-Earth, 122, 1698–1714, https://doi.org/10.1002/2017JF004311, 2017.
Death, R., Siegert, M. J., Bigg, G. R., and Wadley, M. R.: Modelling iceberg trajectories, sedimentation rates and meltwater input to the ocean from the Eurasian Ice Sheet at the Last Glacial Maximum, Palaeogeogr. Palaeocl., 236, 135–150, https://doi.org/10.1016/j.palaeo.2005.11.040, 2006.
De Rydt, J., Holland, P. R., Dutrieux, P., and Jenkins, A.: Geometric and oceanographic controls on melting beneath Pine Island Glacier, J. Geophys. Res.-Oceans, 119, 2420–2438, https://doi.org/10.1002/2013JC009513, 2014.
Dutrieux, P., De Rydt, J., Jenkins, A., Holland, P. R., Ha, H. K., Lee, S. H., Steig, E. J., Ding, Q., Abrahamsen, E. P., and Schröder, M.: Strong Sensitivity of Pine Island Ice-Shelf Melting to Climatic Variability, Science, 343, 174–178, https://doi.org/10.1126/science.1244341, 2014a.
Dutrieux, P., Stewart, C., Jenkins, A., Nicholls, K. W., Corr, H. F. J., Rignot, E., and Steffen, K.: Basal terraces on melting ice shelves, Geophys. Res. Lett., 41, 5506–5513, https://doi.org/10.1002/2014GL060618, 2014b.
Favier, L., Durand, G., Cornford, S. L., Gudmundsson, G. H., Gagliardini, O., Gillet-Chaulet, F., Zwinger, T., Payne, A. J., and Le Brocq, A. M.: Retreat of Pine Island Glacier controlled by marine ice-sheet instability, Nat. Clim. Change, 4, 117–121, https://doi.org/10.1038/nclimate2094, 2014.
Fretwell, P., Pritchard, H. D., Vaughan, D. G., Bamber, J. L., Barrand, N. E., Bell, R., Bianchi, C., Bingham, R. G., Blankenship, D. D., Casassa, G., Catania, G., Callens, D., Conway, H., Cook, A. J., Corr, H. F. J., Damaske, D., Damm, V., Ferraccioli, F., Forsberg, R., Fujita, S., Gim, Y., Gogineni, P., Griggs, J. A., Hindmarsh, R. C. A., Holmlund, P., Holt, J. W., Jacobel, R. W., Jenkins, A., Jokat, W., Jordan, T., King, E. C., Kohler, J., Krabill, W., Riger-Kusk, M., Langley, K. A., Leitchenkov, G., Leuschen, C., Luyendyk, B. P., Matsuoka, K., Mouginot, J., Nitsche, F. O., Nogi, Y., Nost, O. A., Popov, S. V., Rignot, E., Rippin, D. M., Rivera, A., Roberts, J., Ross, N., Siegert, M. J., Smith, A. M., Steinhage, D., Studinger, M., Sun, B., Tinto, B. K., Welch, B. C., Wilson, D., Young, D. A., Xiangbin, C., and Zirizzotti, A.: Bedmap2: improved ice bed, surface and thickness datasets for Antarctica, The Cryosphere, 7, 375–393, https://doi.org/10.5194/tc-7-375-2013, 2013.
Fürst, J. J., Durant, G., Gillet-Chaulet, F., Tavard, L., Rankl, M., Braun, M., and Gagliardini, O.: The safety band of Antarctic ice shelves, Nat. Clim. Change, 6, 479–482, https://doi.org/10.1038/nclimate2912, 2016.
Graham, A. G. C., Larter, R. D., Gohl, K., Hillenbrand, C.-D., Smith, J. A., and Kuhn, G.: Bedform signature of a West Antarctic palaeo-ice stream reveals a multi-temporal record of flow and substrate control, Quaternary Sci. Rev., 28, 2774–2793, https://doi.org/10.1016/j.quascirev.2009.07.003, 2009.
Griggs, J. A. and Bamber, J. L.: Antarctic ice-shelf thickness from satellite radar altimetry, J. Glaciol, 57, 485–493, https://doi.org/10.3189/002214311796905659, 2011.
Gudmundsson, G. H.: Ice-shelf buttressing and the stability of marine ice sheets, The Cryosphere, 7, 647–655, https://doi.org/10.5194/tc-7-647-2013, 2013.
Gutt, J., Barratt, I., Domack, E. W., d'Udekem d'Acoz, C., Dimmler, W., Grémare, A., Heilmayer, O., Isla, E., Janussen, D., Jorgensen, E., Kock, K.-H., Lehnert, L. S., López-Gonzáles, P., Langner, S., Linse, K., Manjón-Cabeza, M. E., Meißner, M., Montiel, A., Raes, M., Robert, H., Rose, A., Schepisi, E. S., Saucède, T., Scheidat, M., Schenke, H.-W., Seiler, J., and Smith, C. R.: Biodiversity change after climate-induced ice-shelf collapse in the Antarctic, Deep-Sea Res. Pt. II, 58, 74–83, https://doi.org/10.1016/j.dsr2.2010.05.024, 2011.
Hillenbrand, C.-D., Kuhn, G., Smith, J. A., Gohl, K., Graham, A. G. C., Larter, R. D., Klages, J. P., Downey, R., Moreton, S. G., Forwick, M., and Vaughan, D. G.: Grounding-line retreat of the West Antarctic Ice Sheet from inner Pine Island Bay, Geology, 41, 35–38, https://doi.org/10.1130/G33469.1, 2013.
Jacobs, S. S., Hellmer, H. H., and Jenkins, A.: Antarctic Ice Sheet melting in the southeast Pacific, Geophys. Res. Lett., 23, 957–960, https://doi.org/10.1029/96GL00723, 1996.
Jacobs, S. S., Jenkins, A., Giulivi, C. F., and Dutrieux, P.: Stronger ocean circulation and increased melting under Pine Island Glacier ice shelf, Nat. Geosci., 4, 519–523, https://doi.org/10.1038/ngeo1188, 2011.
Jenkins, A., Dutrieux, P., Jacobs, S. S., McPhail, S. D., Perrett, J. R., Webb, A. T., and White, D.: Observations beneath Pine Island Glacier in West Antarctica and implications for its retreat, Nat. Geosci., 3, 468–472, https://doi.org/10.1038/ngeo890, 2010.
Jeong, S., Howat, I. M., and Bassis, J. N.: Accelerated ice shelf rifting and retreat at Pine Island Glacier, West Antarctica, Geophys. Res. Lett., 43, 11720–711725, https://doi.org/10.1002/2016GL071360, 2016.
Johnson, J. S., Bentley, M. J., Smith, J. A., Finkel, R. C., Rood, D. H., Gohl, K., Balco, G., Larter, R. D., and Schaefer, J. M.: Rapid Thinning of Pine Island Glacier in the Early Holocene, Science, 343, 999–1001, https://doi.org/10.1126/science.1247385, 2014.
Joughin, I., Shean, D. E., Smith, B. E., and Dutrieux, P.: Grounding line variability and subglacial lake drainage on Pine Island Glacier, Antarctica, Geophys. Res. Lett., 43, 9093–9102, https://doi.org/10.1002/2016GL070259, 2016.
Katz, R. F. and Worster, M. G.: Stability of ice-sheet grounding lines, P. Roy. Soc. A-Math. Phy., 466, 1597–1620, https://doi.org/10.1098/rspa.2009.0434, 2010.
Konrad, H., Gilbert, L., Cornford, S. L., Payne, A., Hogg, A., Muir, A., and Shepherd, A.: Uneven onset and pace of ice-dynamical imbalance in the Amundsen Sea Embayment, West Antarctica, Geophys. Res. Lett., 44, 910–918, https://doi.org/10.1002/2016GL070733, 2017.
Konrad, H., Shepherd, A., Gilbert, L., Hogg, A., McMillan, M., Muir, A., and Slater, T.: Net retreat of Antarctic glacier grounding lines, Nat. Geosci., 11, 258–262, https://doi.org/10.1038/s41561-018-0082-z, 2018.
Lee, H., Shum, C. K., Howat, I. M., Monaghan, A., Ahn, Y., Duan, J., Guo, J.-Y., Kuo, C.-Y., and Wang, L.: Continuously accelerating ice loss over Amundsen Sea catchment, West Antarctica, revealed by integrating altimetry and GRACE data, EPSL, 321–322, 74–80, https://doi.org/10.1016/j.epsl.2011.12.040, 2012.
MacGregor, J. A., Catania, G. A., Markowski, M. S., and Andrews, A. G.: Widespread rifting and retreat of ice-shelf margins in the eastern Amundsen Sea Embayment between 1972 and 2011, J. Glaciol., 58, 458–466, https://doi.org/10.3189/2012JoG11J262, 2012.
Nakayama, Y., Schröder, M., and Hellmer, H. H.: From circumpolar deep water to the glacial meltwater plume on the eastern Amundsen Shelf, Deep-Sea Res. Pt. I, 77, 50–62, https://doi.org/10.1016/j.dsr.2013.04.001, 2013.
Pritchard, H. D., Arthern, R. J., Vaughan, D. G., and Edwards, L. A.: Extensive dynamic thinning on the margins of the Greenland and Antarctic ice sheets, Nature, 461, 971–975, https://doi.org/10.1038/nature08471, 2009.
Pritchard, H. D., Ligtenberg, S. R. M., Fricker, H. A., Vaughan, D. G., van den Broeke, M. R., and Padman, L.: Antarctic ice-sheet loss driven by basal melting of ice shelves, Nature, 484, 502–505, https://doi.org/10.1038/nature10968, 2012.
Rignot, E.: Ice-shelf changes in Pine Island Bay, Antarctica, 1947–2000, J. Glaciol., 48, 247–256, https://doi.org/10.3189/172756502781831386, 2002.
Rignot, E.: Changes in West Antarctic ice stream dynamics observed with ALOS PALSAR data, Geophys. Res. Lett., 35, L12505, https://doi.org/10.1029/2008gl033365, 2008.
Rignot, E., Bamber, J. L., van den Broeke, M. R., Davis, C., Li, Y., van de Berg, W. J., and van Meijgaard, E.: Recent Antarctic ice mass loss from radar interferometry and regional climate modelling, Nat. Geosci., 1, 106–110, https://doi.org/10.1038/ngeo102, 2008.
Rignot, E., Mouginot, J., and Scheuchl, B.: Ice Flow of the Antarctic Ice Sheet, Science, 333, 1427–1430, https://doi.org/10.1126/science.1208336, 2011.
Rignot, E., Jacobs, S., Mouginot, J., and Scheuchl, B.: Ice-Shelf Melting Around Antarctica, Science, 341, 266–270, https://doi.org/10.1126/science.1235798, 2013.
Rignot, E., Mouginot, J., Morlighem, M., Seroussi, H., and Scheuchl, B.: Widespread, rapid grounding line retreat of Pine Island, Thwaites, Smith, and Kohler glaciers, West Antarctica, from 1992 to 2011, Geophys. Res. Lett., 41, 3502–3509, https://doi.org/10.1002/2014GL060140, 2014.
Schoof, C.: Ice sheet grounding line dynamics: Steady states, stability, and hysteresis, J. Geophys. Res., 112, FS03S28, https://doi.org/10.1029/2006JF000664, 2007.
Shepherd, A., Ivins, E. R., A, G., Barletta, V. R., Bentley, M. J., Bettadpur, S., Briggs, K. H., Bromwich, D. H., Forsberg, R., Galin, N., Horwath, M., Jacobs, S., Joughin, I., King, M. A., Lenaerts, J. T. M., Li, J., Ligtenberg, S. R. M., Luckman, A., Luthcke, S. B., McMillan, M., Meister, R., Milne, G., Mouginot, J., Muir, A., Nicolas, J. P., Paden, J., Payne, A. J., Pritchard, H., Rignot, E., Rott, H., Sørensen, L. S., Scambos, T. A., Scheuchl, B., Schrama, E. J. O., Smith, B., Sundal, A. V., van Angelen, J. H., van de Berg, W. J., van den Broeke, M. R., Vaughan, D. G., Velicogna, I., Wahr, J., Whitehouse, P. L., Wingham, D. J., Yi, D., Young, D., and Zwally, H. J.: A Reconciled Estimate of Ice-Sheet Mass Balance, Science, 338, 1183–1189, https://doi.org/10.1126/science.1228102, 2012.
Smith, J. A., Andersen, T. J., Shortt, M., Gaffney, A. M., Truffer, M., Stanton, T. P., Bindschadler, R., Dutrieux, P., Jenkins, A., Hillenbrand, C. D., Ehrmann, W., Corr, H. F. J., Farley, N., Crowhurst, S., and Vaughan, D. G.: Sub-ice-shelf sediments record history of twentieth-century retreat of Pine Island Glacier, Nature, 541, 77–80, https://doi.org/10.1038/nature20136, 2017.
Steig, E. J., Ding, Q., Battisti, D. S., and Jenkins, A.: Tropical forcing of Circumpolar Deep Water Inflow and outlet glacier thinning in the Amundsen Sea Embayment, West Antarctica, Ann. Glaciol., 53, 19–28, https://doi.org/10.3189/2012AoG60A110, 2012.
Vaughan, D. G., Corr, H. F. J., Bindschadler, R. A., Dutrieux, P., Gudmundsson, G. H., Jenkins, A., Newman, T., Vornberger, P., and Wingham, D. J.: Subglacial melt channels and fracture in the floating part of Pine Island Glacier, Antarctica, J. Geophys. Res.-Earth, 117, F03012, https://doi.org/10.1029/2012JF002360, 2012.
Weertman, J.: Stability of the Junction of an Ice Sheet and an Ice Shelf, J. Glaciol., 13, 3–11, https://doi.org/10.3198/1974JoG13-67-3-11, 1974.
Wingham, D. J., Wallis, D. W., and Shepherd, A.: Spatial and temporal evolution of Pine Island Glacier thinning, 1995–2006, Geophys. Res. Lett., 36, L17501, https://doi.org/10.1029/2009GL039126, 2009.
Yu, H., Rignot, E., Morlighem, M., and Seroussi, H.: Iceberg calving of Thwaites Glacier, West Antarctica: full-Stokes modeling combined with linear elastic fracture mechanics, The Cryosphere, 11, 1283–1296, https://doi.org/10.5194/tc-11-1283-2017, 2017.