the Creative Commons Attribution 4.0 License.
the Creative Commons Attribution 4.0 License.
 | 27 Aug 2018
Modelled subglacial floods and tunnel valleys control the life cycle of transitory ice streams
Thomas Lelandais
Édouard Ravier
Stéphane Pochat
Olivier Bourgeois
Christopher Clark
Régis Mourgues
Pierre Strzerzynski
Ice streams are corridors of fast-flowing ice that control mass transfers from continental ice sheets to oceans. Their flow speeds are known to accelerate and decelerate, their activity can switch on and off, and even their locations can shift entirely. Our analogue physical experiments reveal that a life cycle incorporating evolving subglacial meltwater routing and bed erosion can govern this complex transitory behaviour. The modelled ice streams switch on and accelerate when subglacial water pockets drain as marginal outburst floods (basal decoupling). Then they decelerate when the lubricating water drainage system spontaneously organizes itself into channels that create tunnel valleys (partial basal recoupling). The ice streams surge or jump in location when these water drainage systems maintain low discharge but they ultimately switch off when tunnel valleys have expanded to develop efficient drainage systems. Beyond reconciling previously disconnected observations of modern and ancient ice streams into a single life cycle, the modelling suggests that tunnel valley development may be crucial in stabilizing portions of ice sheets during periods of climate change.
- Article
(4279 KB) -
Supplement
(4495 KB) - BibTeX
- EndNote


Continental ice sheets currently store the equivalent of a 65 m thick global water layer and have been major contributors to the nearly 85 mm in global sea level rise measured between 1993 and 2017 (Vaughan et al., 2013; Beckley et al., 2015). The mass transfer from these ice sheets to the ocean is spatially heterogeneous: approximately 80 % of the ice discharge is focused in a finite number of ice streams, which act as preferential drainage pathways for meltwater (Bamber et al., 2000; Bennett, 2003).
Modern and ancient ice streams are typically hundreds of kilometres long and a few kilometres to tens of kilometres wide, with ice velocities of the order of 102 to 104 m yr−1. Despite the fact that they occurred and occur in all former and modern ice sheets, their initiation and the controls on their dynamics and evolution remain debated. Numerical modelling suggests that ice flow might self-organize into regularly spaced ice streams as a consequence of thermomechanical feedbacks within ice (Payne and Dongelmans, 1997; Hindmarsh, 2009) or because of inherent instability of thin subglacial meltwater films (Kyrke-Smith et al., 2014). Numerous observations, however, have highlighted preferential location of ice streams at sites of specific bed properties such as in topographic troughs, over areas of soft sedimentary geology, zones of higher geothermal heat flux or in areas where subglacial meltwater is routed (Winsborrow et al., 2010; Kleiner and Humbert, 2014). These viewpoints might not be mutually exclusive if self-organization into regularly spaced streams is the primary control but it is strongly mediated by local bed templates (e.g. troughs) or events (meltwater drainage) that initiate or anchor streams in certain locations. Exploring this hypothesis using numerical modelling has not yet been achieved because of uncertainties in how to formulate basal ice flow in relation to bed friction, and due to challenges of including all potentially relevant processes, especially for subglacial water flow (Flowers, 2015).
Observations of spatial and temporal variations in the activity of ice streams against fluctuations in their subglacial hydrology indicate that the style and flux of water drainage is a major component driving change. Examples include reorganization of subglacial drainage systems (Elsworth and Suckale, 2016), subglacial water piracy (Vaughan et al., 2008; Carter et al., 2013), and development and migration of transient subglacial water pockets (Gray et al., 2005; Peters et al., 2007; Siegfried et al., 2016). However, these variations have been observed or inferred independently, at different places and on yearly timescales, thus limiting our understanding of the true role of the subglacial hydrology as a primary or secondary driver of ice stream changes. In this paper, we circumvent the challenge of numerically modelling ice stream initiation and dynamics, including subglacial water drainage, by exploiting a physical laboratory approach that simultaneously combines silicon flow, water drainage and bed erosion.
Connections between ice stream activity and subglacial hydrology are supported by the occurrence of geomorphic markers of meltwater drainage on ancient ice stream beds (e.g. meltwater channels, tunnel valleys, eskers) (Patterson, 1997; Margold et al., 2015; Livingstone et al., 2016). Among these markers, tunnel valleys deserve specific attention because they have high discharge capacities and, as such, may be major contributors to the release of meltwater and sediment to the ocean and may promote ice sheet stability by reducing the lubricating effect of high basal water pressure. These valleys are elongated and overdeepened hollows, ranging from a few kilometres to hundreds of kilometres long, from hundreds of metres to several kilometres wide and from metres to hundreds of metres deep. Their initiation is generally attributed to subglacial meltwater erosion but their development processes (in time and space) and their relationship to ice streaming are still debated. Indeed, ice streams commonly operate because of high basal water pressure while the development of a tunnel valley system generally leads to enhanced drainage efficiency and basal water pressure reduction (Engelhardt et al., 1990; Marczinek and Piotrowski, 2006; Kyrke-Smith et al., 2014).
Several field studies have already suggested a connection between catastrophic glacial outburst floods at ice sheet margins and a suite of events involving ice streaming, tunnel valley development and stagnation of the ice margin (Jørgensen and Piotrowski, 2003; Alley et al., 2006; Hooke and Jennings, 2006; Bell et al., 2007). Such outburst floods can profoundly and rapidly alter the oceanic environment by transferring considerable amounts of ice, freshwater, and sediment from continents to oceans (Evatt et al., 2006). The suspected connection among ice streams, tunnel valleys, and outburst floods has never been observed or modelled however.
Here, we describe the results of a physical experiment performed with an innovative analogue modelling device that provides simultaneous constraints on ice flow, subglacial meltwater drainage, subglacial sediment transport and subglacial landform development (Lelandais et al., 2016; Fig. 1). We propose that the location and initiation of ice streams might arise from subglacial meltwater pocket migration and drainage pathways and that the evolution of ice stream dynamics is subsequently controlled by subglacial drainage reorganization and tunnel valley development. This study reconciles into a single story several detached inferences, derived from observations at different timescales and at different places on modern and ancient ice streams.
Ice stream dynamics are controlled by various processes that act at different spatial and temporal scales; they also involve several components with complex thermo-mechanical behaviours (ice, water, till, bedrock) (Paterson, 1994). Considering all these processes and components simultaneously, together with processes of subglacial erosion, is thus a challenge for numerical computational modelling (Fowler and Johnson, 1995; Marshall, 2005; Bingham et al., 2010). Some attempts in analogue modelling have been made to improve our knowledge on subglacial erosional processes by meltwater (Catania and Paola, 2001) or gravity current instabilities produced by lubrication (Kowal and Worster, 2015). To combine ice flow dynamics and erosional aspects in a single model, we designed an alternative experimental approach that allows simultaneous modelling of ice flow, subglacial hydrology and sedimentary–geomorphic processes. With all the precautions inherent in using analogue modelling, our experiments reproduce morphologies and dynamics that compare well with subglacial landforms and ice stream dynamics despite some differences in spatial and temporal scales and a number of active processes (e.g. Paola et al., 2009).
2.1 Experimental apparatus
The model is set in a glass box (70 cm long, 70 cm wide and 5 cm deep) (Fig. 1). A 5 cm thick, flat, horizontal, permeable and erodible substratum, made of sand (d50=100 µm) saturated with pure water and compacted to ensure homogeneous values for its density (ρbulk=2000 kg m−3), porosity (Φ=41 %) and permeability ( m s−1), rests on the box floor. The ice sheet portion is modelled with a 3 cm thick layer of viscous ( Pa s) and transparent but refractive (n=1.47) silicon putty placed on the substratum. The model is not designed to simulate an entire ice sheet. The silicon layer is circular in top view (radius = 15 cm) to avoid lateral boundary effects on silicon flow. Subglacial meltwater production is simulated by injection of water with a punctual injector, 4 mm in radius, placed at a depth of 1.8 cm in the substratum and connected to a pump (Fig. 1). The injector is located below the centre of the silicon layer to be consistent with the circular geometry of the experiment. The water discharge is constant (1.5 dm3 h−1) over the duration of the experiment and generates water flow at the silicon–substratum interface and within the substratum. Water discharge is calculated beforehand so that water pressure exceeds the combined weight of the sand and silicon layers. The injection of water starts when the silicon layer reaches the dimensions we fixed for every experiment (15 cm radius and 3 cm thickness) and a perfect transparency. Once injected, water flow is divided into a Darcy flow within the substratum and a flow at the silicon–substratum interface. The water flowing at the silicon–substratum interface originates from a pipe forming at the injector once water pressure exceeds the cumulative pressure of the silicon and sand layers. The ratio between the Darcy flow and the flow at the silicon–substratum interface is inferred from computations of the water discharge flowing through the pipe based on the substratum properties and the input discharge. We estimate that 75 % of the input discharge in the substratum and 25 % of the input discharge along the silicon–substratum interface is transferred as Darcy flow.
2.2 Acquisition process and post-processing
In order to monitor the development of landforms on the substratum, we use six synchronized cameras equidistant from the experiment centre (Fig. 1) taking photographs of the experiment every 5 s. Two cameras (orange in Fig. 1) cover the whole extent of the experiment and four cameras (blue in Fig. 1) focus on specific regions to obtain higher-resolution images. These cameras take simultaneous pictures with differing positions and orientations. Digital elevation models of the silicon surface and of the substratum are derived from these images by photogrammetry. The ultimate stage of the experiment is to remove distortions due to light refraction through the silicon putty and apply corrections to the substratum topography. This treatment is achieved using a custom algorithm able to evaluate the gap between the measured altitude and the real altitude of each pixel of the DEM (see detailed post-treatment methods in Lelandais et al., 2016). Tests performed on previously known topographies show that the vertical precision of the retrieved digital elevation models is better than 10−1 mm.
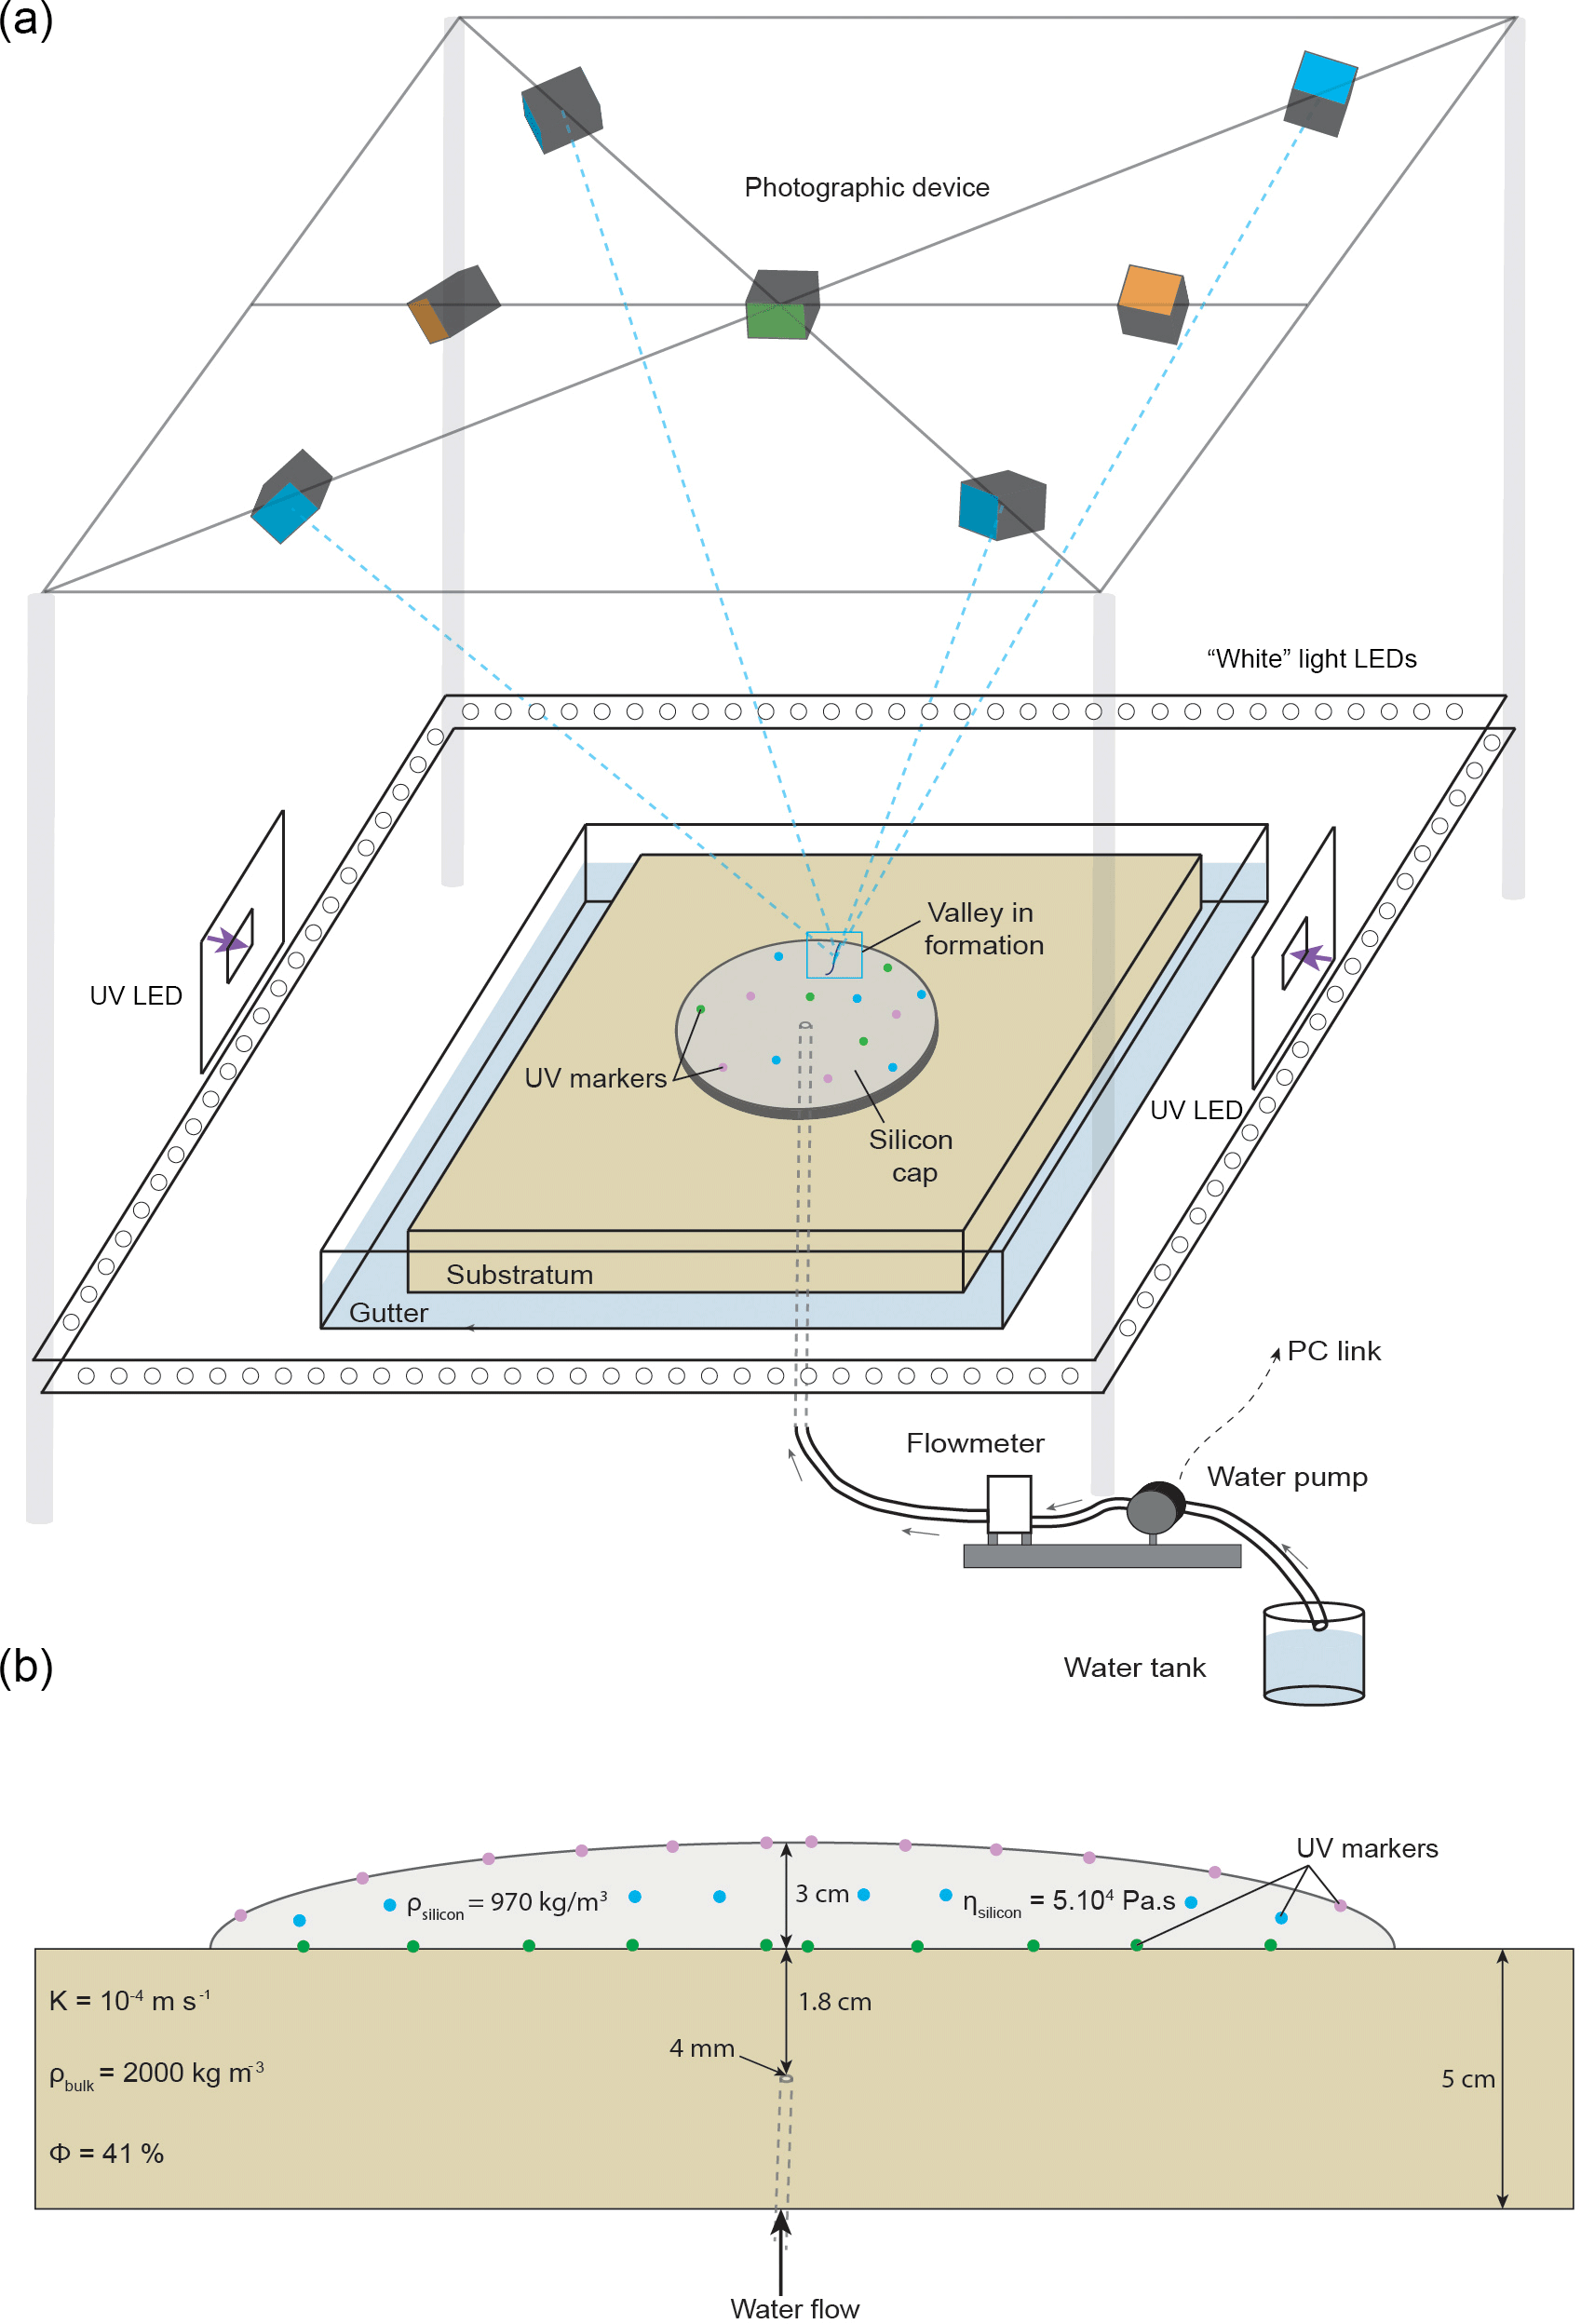
Figure 1Description of the analogue device used in this study. (a) Overview of the analogue device. The analogue device consists in a 70 cm long, 70 cm wide, and 5 cm deep glass box filled with saturated and compacted sand simulating the substratum. The ice sheet portion is simulated by a circular layer of silicon putty containing three levels of UV markers. Meltwater production is simulated by a central and punctual injection of pure water within the substratum. Five synchronized cameras placed above the silicon putty (in blue) focus on the tunnel valley system and are used to produce digital elevation models by photogrammetry. Another camera (in orange) takes overview photographs of the analogue device to follow the progress of the whole experiment. A last camera (in green) is positioned at the vertical of the silicon layer centre and is configured to take high-resolution photographs of the UV markers in black light (illuminated with two lateral UV LED lights). (b) Cross-sectional profile of the analogue device displaying the position of the UV markers and the physical characteristics of both the substratum and the silicon layer.
The flow velocity of the silicon layer is monitored near its base (Vbase), at mid-depth (Vmid) and at its surface (Vsurface), with an additional camera placed over the centre of the experiment (green in Fig. 1). For that purpose, the camera records the position in pictures taken at regular time intervals in ultraviolet (UV) light of 180 UV paint drops (1 mm in radius) placed 1 mm above the base, at mid-depth and at the surface of the silicon layer (Figs. 1, S1 in the Supplement). The monitoring of every UV marker position through time was used to produce velocity and vertical displacement maps. Vertical displacement maps are interpolated from the subtraction of the DEM at time t with the DEM generated from the photographs taken a few seconds before the injection. Velocity maps are interpolated from the subtraction of the position of every marker at time t with the position of the same markers at the previous stage. These passive markers are transparent at visible wavelengths and do not alter pictures of the substratum taken through the silicon cap. They represent less than 0.5 % of the silicon layer in volume and tests have shown that they do not affect its overall rheological behaviour. Uncertainties in the measured position of markers on images are less than 1 pixel in size (i.e. less than 10−1 mm); thus uncertainties in the derived velocities are comprised between and mm s−1, depending on the time interval between photographs.
2.3 Scaling and limitations
In this study, we focus our attention on the relations among subglacial water flow, subglacial erosion and ice flow using an experiment approach. Considering that in our model meltwater is simulated by an injection of water, the rules of a classical scaling in which the model is a perfect miniaturization of nature are not practical (Paola et al., 2009). In this perspective, we base the scaling of our model on the displacement of the natural ice and experimental silicon margins through time. We use a unit-free speed ratio between the silicon and ice margin velocity and the incision rate of experimental and natural tunnel valleys. In this way, the complexity of the relations among subglacial hydrology, subglacial erosion and ice flow, which is one of the main issues in numerical modelling, is included in the velocity values. The scaling attests that the value of the ratio between margin velocity and incision rate of tunnel valleys in the experiment falls within the field validity defined by the range of natural settings (full details in Lelandais et al., 2016). The main scaling limit regards the viscosity ratios among glacier ice, silicon putty and water. The size of the experimental ice stream, being partly controlled by the high silicon viscosity, may be underestimated compared to the size of modelled tunnel valleys.
Considering that our model is a simplification of nature, we cannot simulate the real complexity of the natural processes. In contrast to ice, the commercial silicon putty we use (Dow Corning, SGM36) is impermeable, Newtonian, isotropic, and its viscosity is nearly independent of temperatures between 10 and 30 ∘C. Therefore, rheological softening with strain rate, temperature, anisotropy, and meltwater content (e.g. Bingham et al., 2010) cannot be reproduced. The silicon putty cannot reproduce the ice–water phase transition either, requiring the use of punctual water injection in the experiment. This punctual injection does not simulate the mosaic of meltwater production regions existing beneath glaciers or the episodic input from supraglacial–englacial meltwater reservoirs. Experimental meltwater routing is predominantly controlled by the water discharge we inject in our system and therefore differs from parameters controlling hydrology in glacial systems. Subglacial meltwater routing is indeed controlled by the ice surface slope, the bed topography, and the glacier mass balance (Rothlisberger and Lang, 1987). The ice surface slope controls potentiometric surfaces, generally guiding subglacial water flow parallel to ice sheet surfaces (Glen, 1954; Shreve, 1972; Fountain and Walder, 1998). Finally, the substratum we use is homogeneous, flat and composed of a well-sorted mixture of sand-sized grains. This model, designed to decipher the interaction between subglacial hydrology and ice dynamics, hinders the influence of bed topography and geology (especially the influence of subglacial till) (Winsborrow et al., 2010). The deformation of the subglacial till and its complex rheological behaviour is known to promote ice streaming (Alley et al., 1987), modify the subglacial hydrology, and alter the size of tunnel valleys. The development of an analogue material scaled to reproduce subglacial till characteristics is extremely difficult so we did not try to include the equivalent of a till layer in the experiment. We thus assume that the velocity contrasts observed in the experiment are likely to be amplified in natural ice sheets by the complex rheological behaviour of ice and till. This may lead to the development of narrower ice streams with higher relative velocities and sharper lateral shear margins in natural ice sheets than in the experiment (Raymond, 1987; Perol and Rice, 2015).
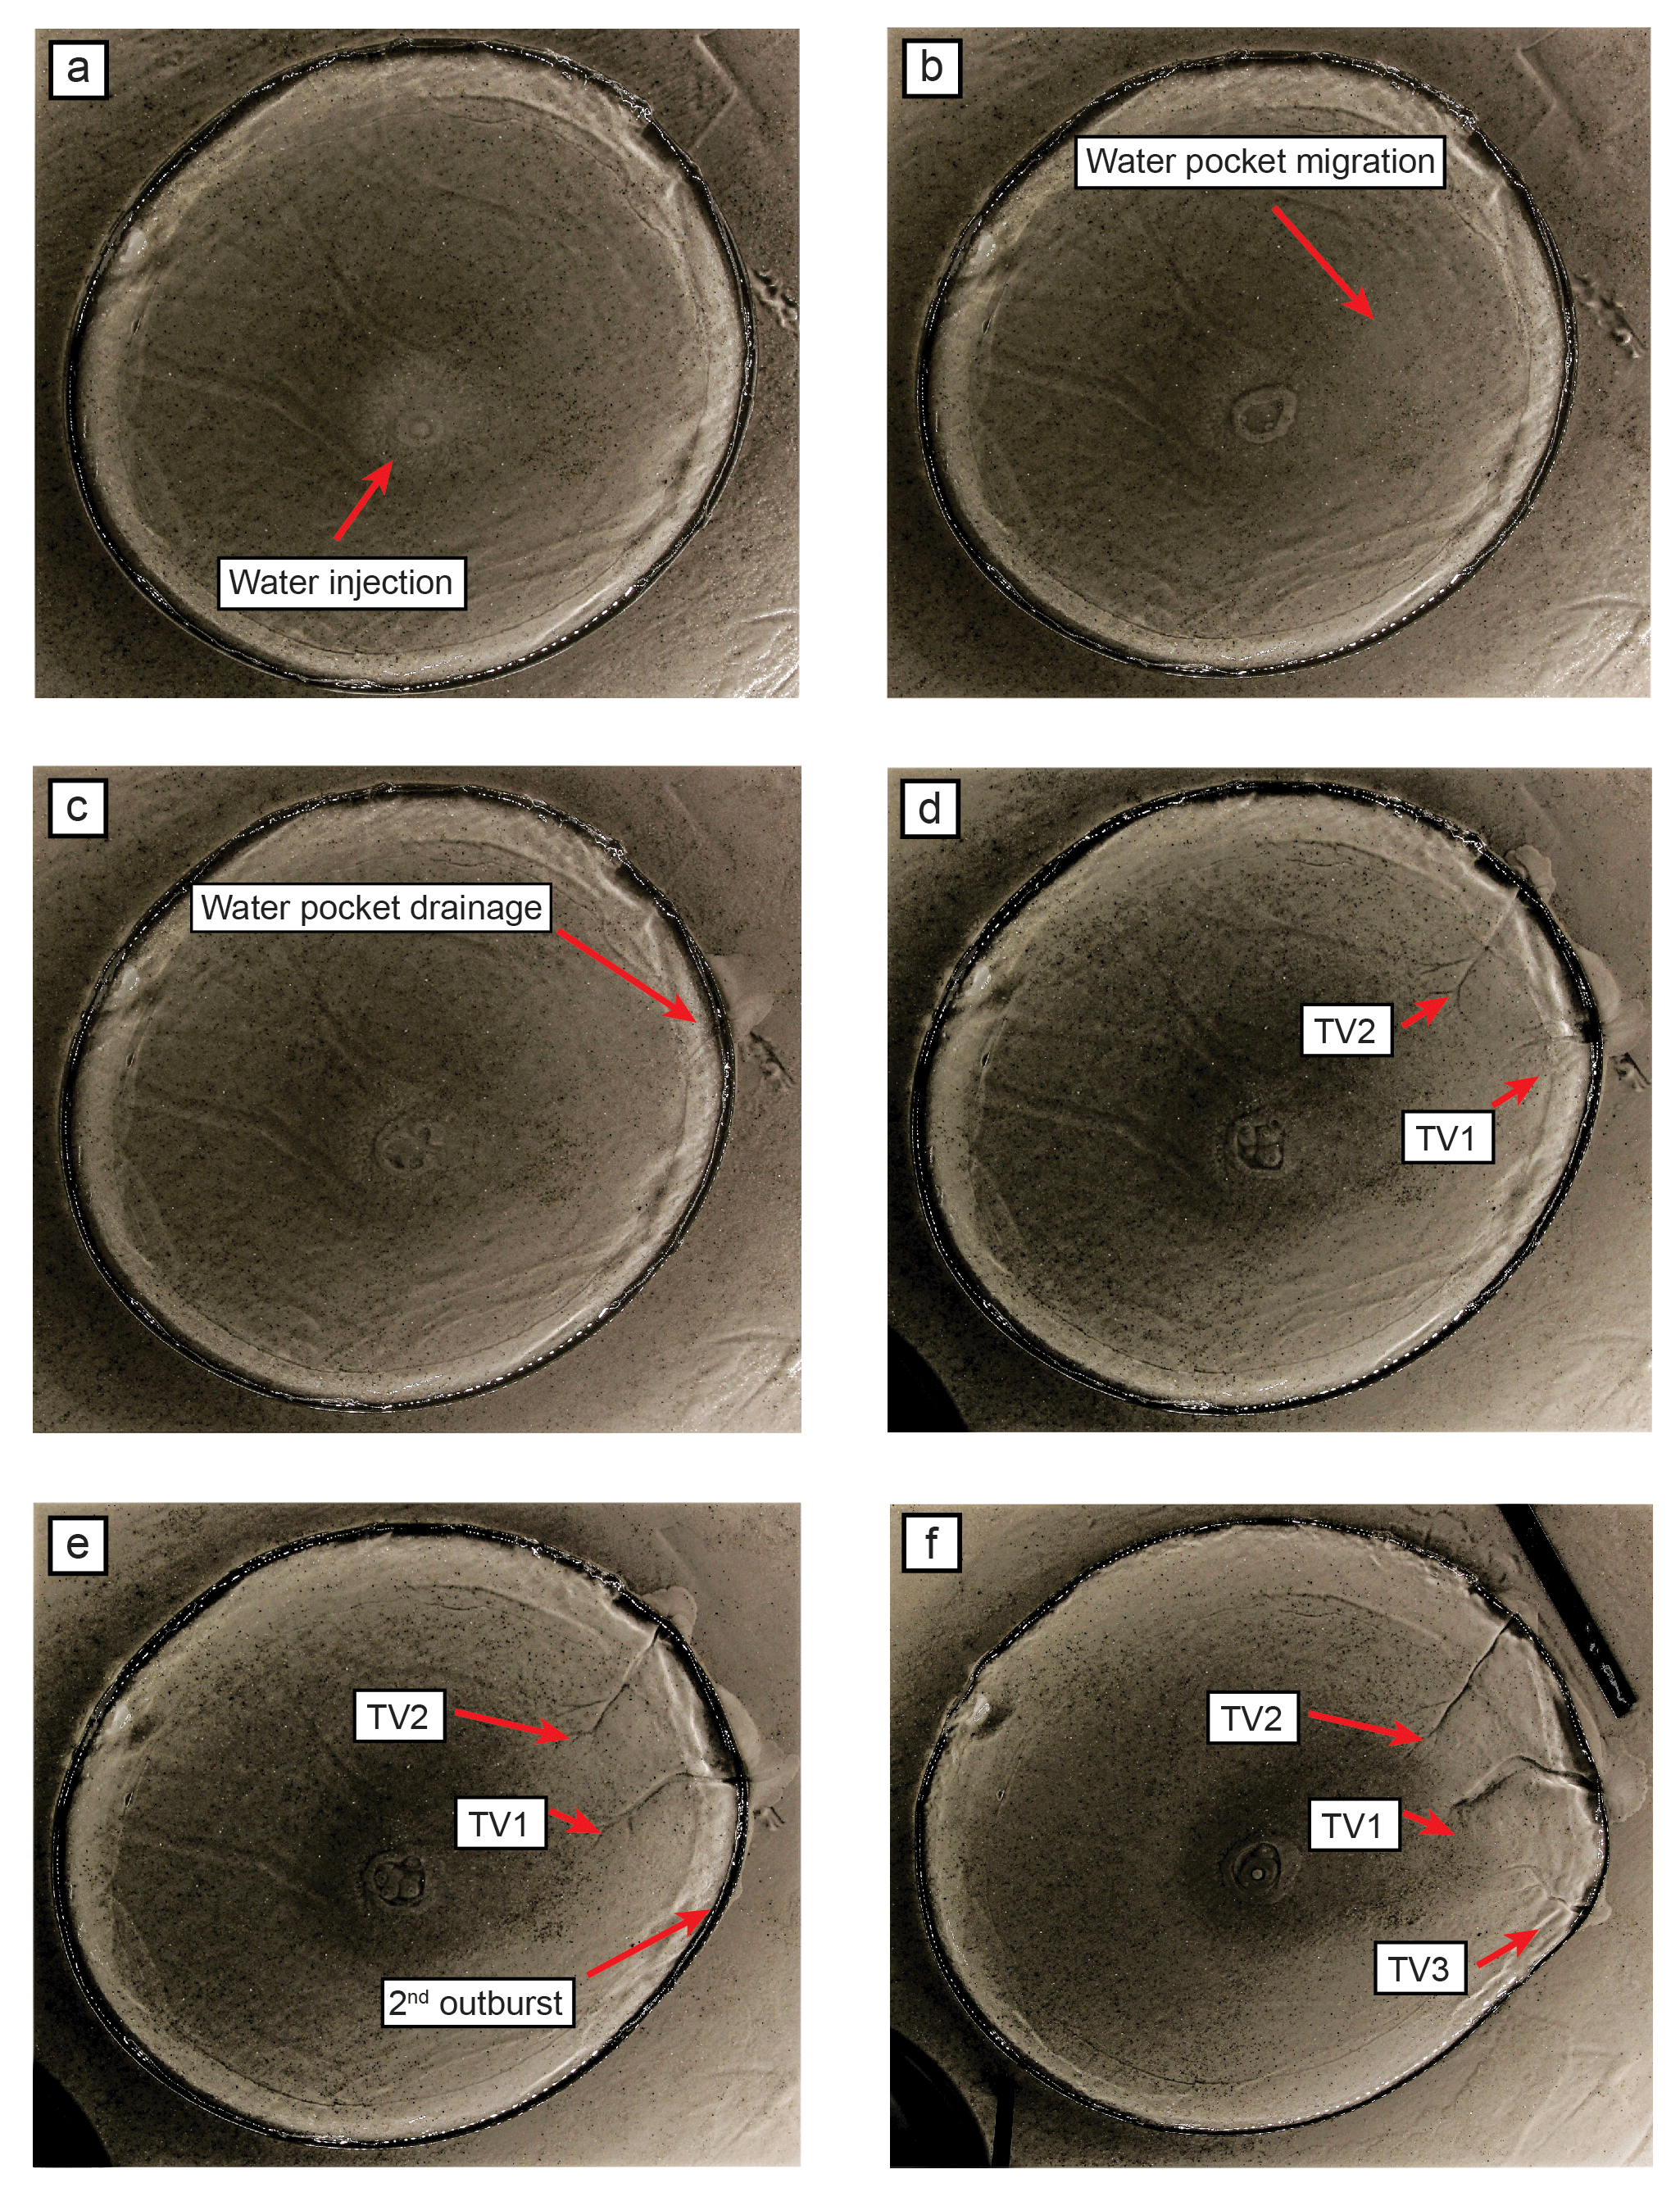
Figure 2Temporal evolution of the experiment seen in raw photographs. (a) Formation of a water pocket. (b) Migration of the water pocket. (c) Marginal drainage of the water pocket and onset of the silicon stream. (d) Development of two tunnel valleys (TV1 and TV2). (e) Drainage of a second water pocket and silicon stream migration. (f) Development of a new generation of tunnel valleys (TV3) and silicon stream decay. Silicon flow velocity and silicon surface displacement maps corresponding to the six stages described here are presented in Fig. 3.
3.1 Stage-by-stage experimental progress
This experiment was repeated 12 times with identical input parameters (a 30 mm thick silicon layer of 150 mm radius; constant water input of 1.5 dm3 h−1 during 1800 s). After an initial identical state, a six-stage ice stream life cycle linking outburst flooding, transitory ice streaming, and tunnel valley development has been observed for all these simulations (Figs. 2, 3).
Initial state (Fig. S2). As long as no water is injected in the substratum, the silicon layer spreads under its own weight and displays the typical parabolic surface profile of an ice sheet. It increases in diameter and decreases in thickness with time, thus producing a radial pattern of horizontal velocities, which increase in magnitude from the centre ( mm s−1) to the margin ( mm s−1) (Fig. S2). Vbase is close to 0 over the full extent of the silicon layer ( %), indicating coupling with the substratum. The silicon flow pattern changes when meltwater production is simulated by injecting water at a constant discharge (1.5 dm3 h−1), beneath the silicon layer.
Stage 1 (Figs. 2a, 3a). A water pocket grows below the centre of the silicon layer and raises its surface by 2 mm. Above the water pocket, the silicon accelerates ( mm s−1) and is decoupled from the substratum ( to 80 %). Below the rest of the silicon layer, lower velocities ( mm s−1, to 50 %) indicate higher basal friction. These results are consistent with inferences that meltwater ponding can form pressurized subglacial water pockets associated with basal decoupling, surface uplift, and ice flow acceleration in natural ice sheets (e.g. Hanson et al., 1998; Elsworth and Suckale, 2016; Livingstone et al., 2016). In the experiment, however, these effects are restricted to an approximately circular region and are not sufficient to produce channelized ice streaming.
Stage 2 (Figs. 2b, 3b). The water pocket expands and migrates towards the margin of the silicon layer. The lack of channels incised in the substratum indicates that this displacement occurs as distributed water drainage without any basal erosion. In the silicon layer, the region of surface uplift, basal decoupling and acceleration ( mm s−1, to 85 %) expands and migrates downstream with the water pocket. Similar migrations of pressurized subglacial water pockets have been observed or inferred under modern and ancient ice sheets (Fricker et al., 2007; Carter et al., 2017), sometimes associated with migrations of regions of ice surface uplift and ice flow acceleration (Bell et al., 2007; Stearns et al., 2008; Siegfried et al., 2016). The experiment indicates that the migration of water pockets at the ice–bed interface can contribute to the emergence of ice streams.
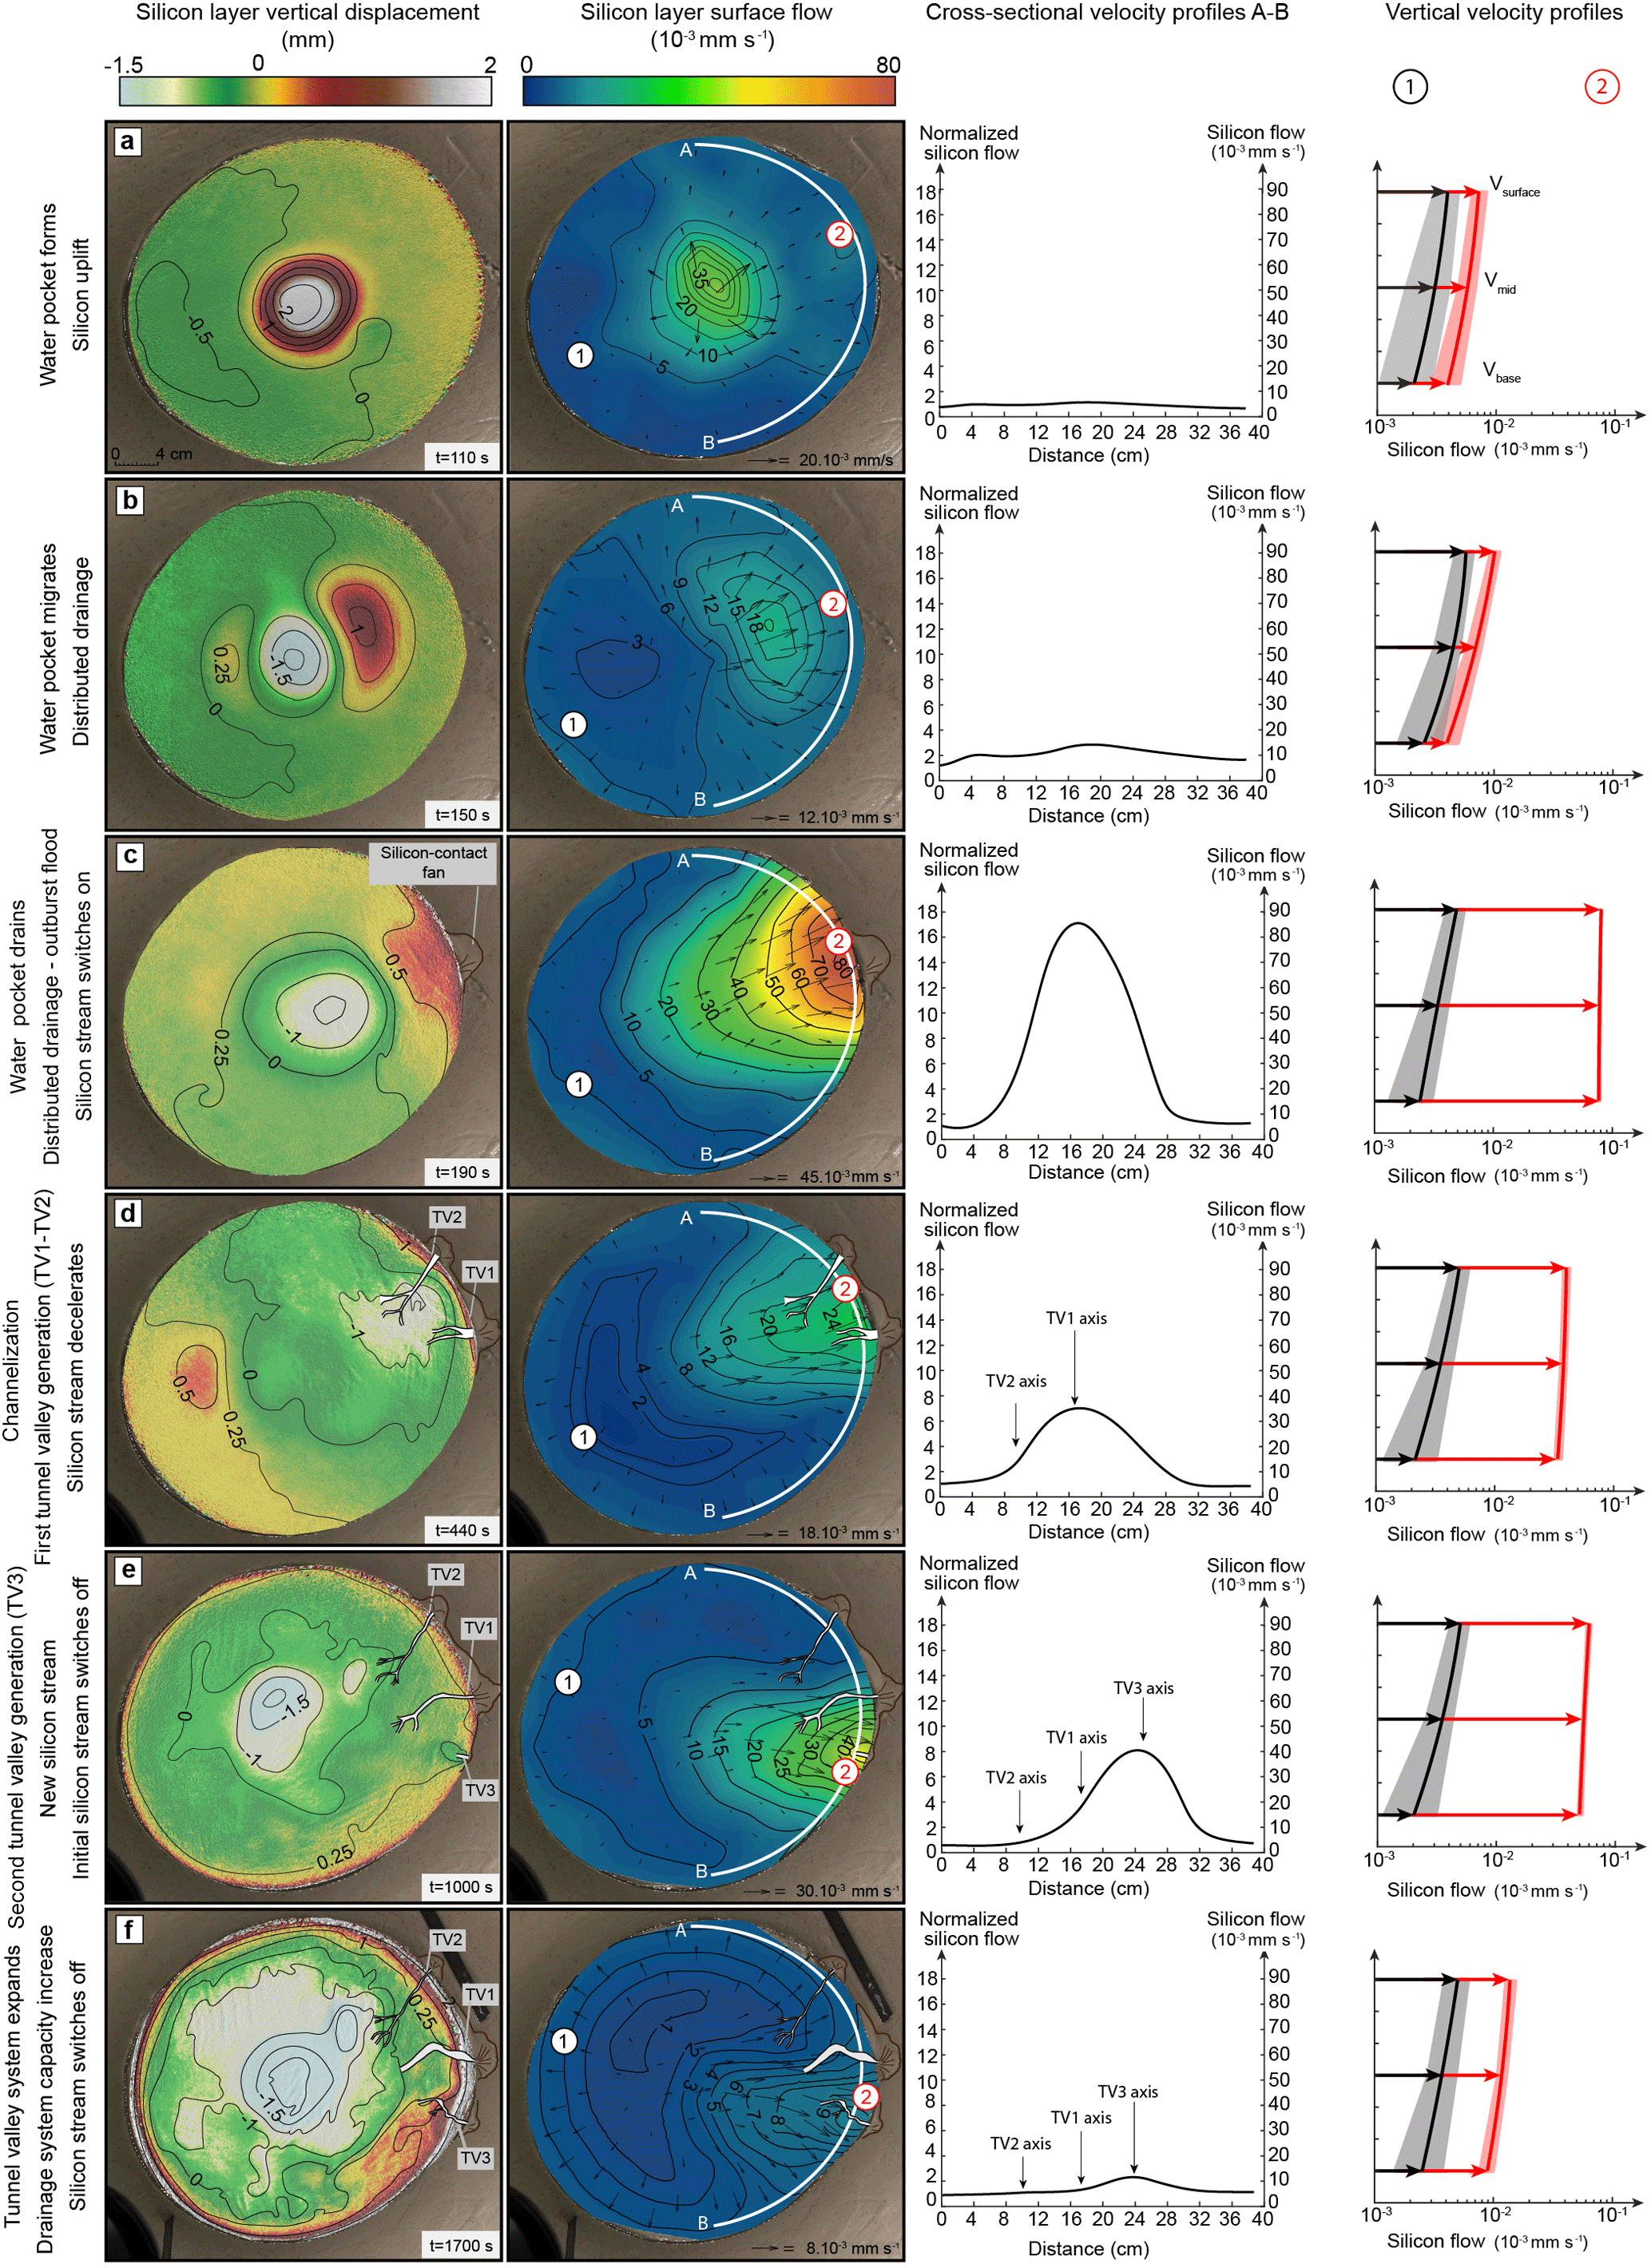
Figure 3Temporal evolution of the experiment. (a) Formation of water pocket, uplift of silicon surface uplift, and acceleration. (b) Migration of water pocket and overlying region of uplift and accelerated flow. (c) Marginal drainage of water pocket and onset of silicon streaming. (d) Tunnel valley development and silicon stream deceleration. (e) Formation, migration, and marginal drainage of a new water pocket and development of a second silicon stream and of a new tunnel valley. (f) Decay of the second silicon stream. From left to right: (i) maps of vertical displacements of silicon layer surface, (ii) maps of horizontal velocity at silicon layer surface, (iii) cross-sectional velocity profiles (absolute velocity on the right axis; velocity normalized by background velocity on the left axis; profile locations indicated by white lines A–B on maps), (iv) vertical velocity profiles for the silicon stream (red profiles, locations labelled 2 on maps) and for the region opposed to the silicon stream (black profiles, locations labelled 1 on maps).
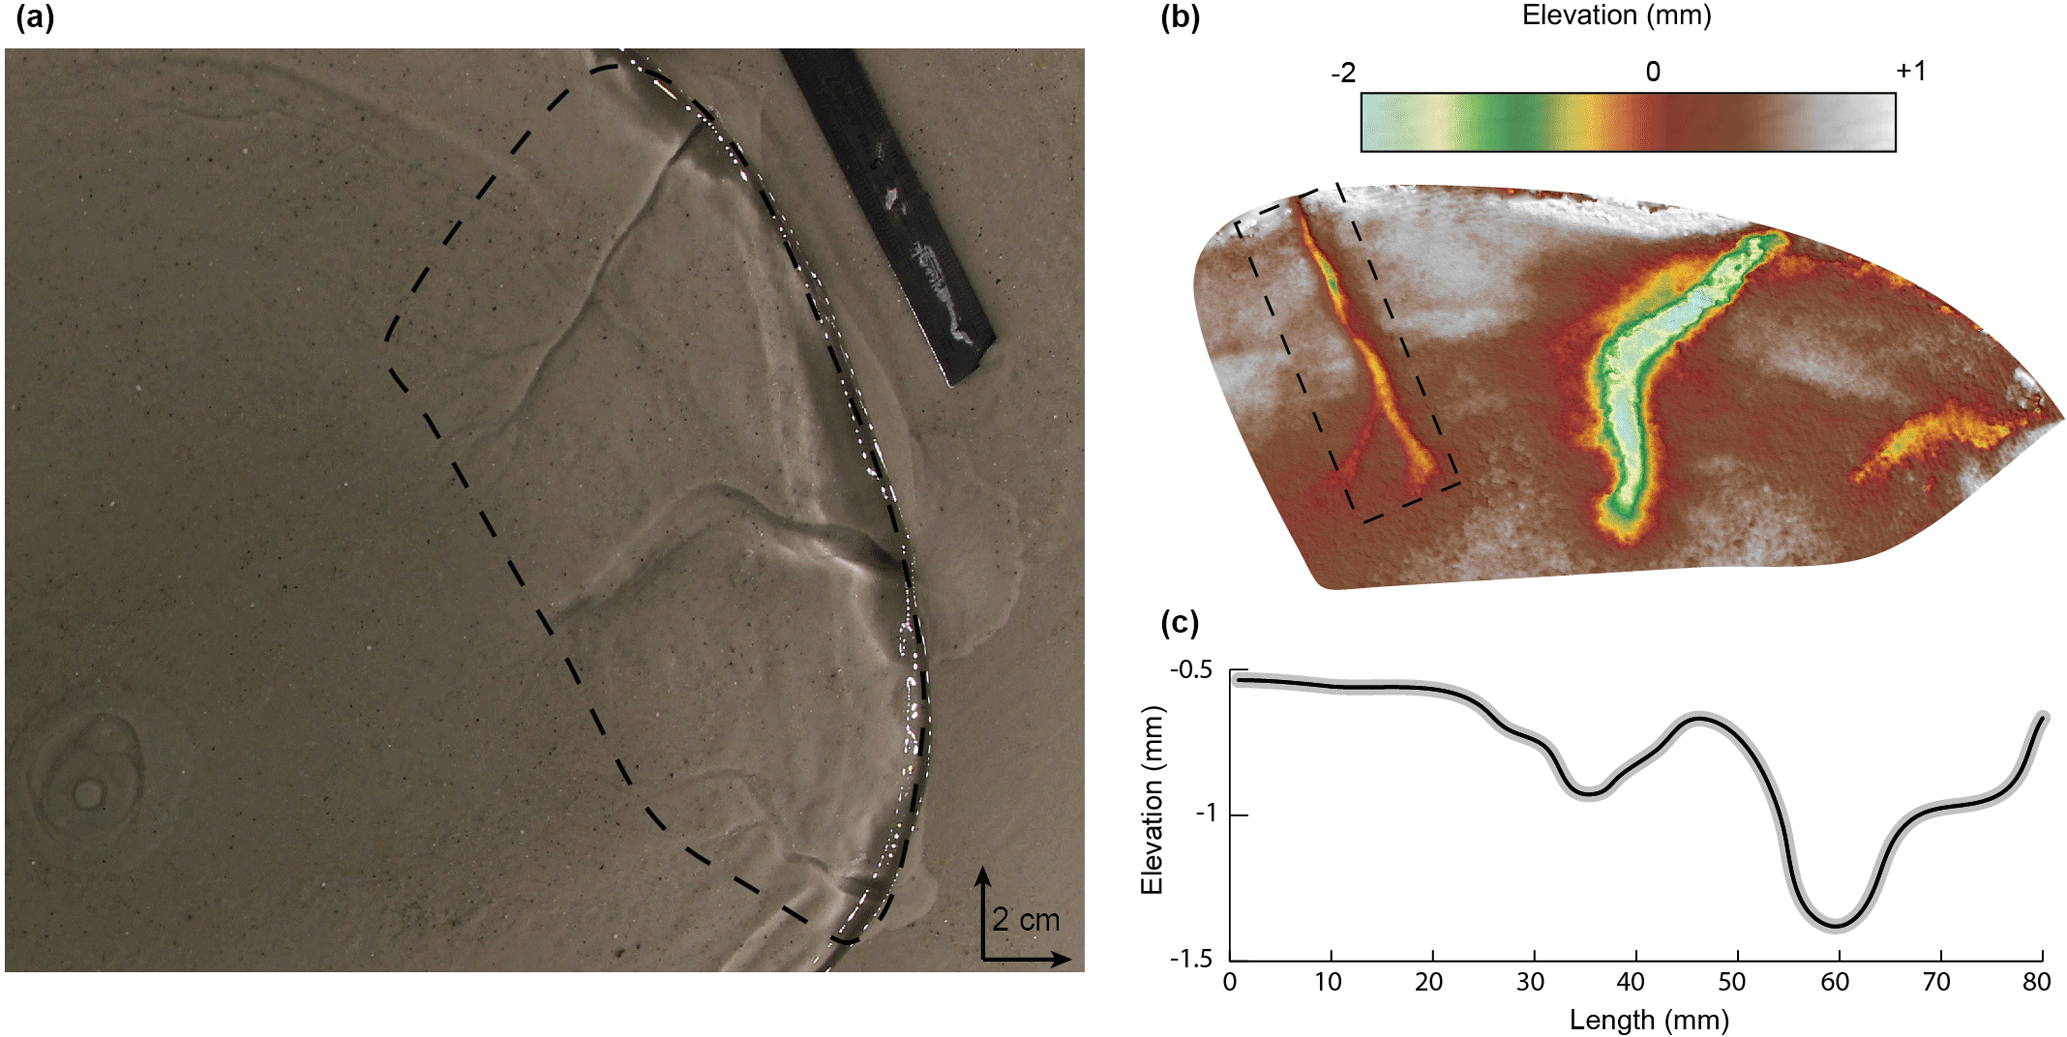
Figure 4Digital elevation model (DEM) of an experimental tunnel valley and its associated longitudinal profile. (a) Snapshot of the tunnel valley system. (b) DEM of the tunnel valley corresponding to the one highlighted by a dashed box in (a). (c) Undulating longitudinal profile of the tunnel valley bottom extracted from the DEM in the dashed box shown in (b).
Stage 3 (Figs. 2c, 3c). When the water pocket reaches the margin of the silicon layer, it drains suddenly as a sheet flow. This marginal outburst flood is still fed by distributed drainage and conveys sand particles eroded from the substratum towards a low-angle marginal sedimentary fan (up to 40 mm long, 30 mm wide and 0.3 mm thick; Fig. S3). Simultaneously, the silicon flow focuses in a stream (200 mm wide at the margin) that propagates upstream from the silicon margin to the water injection area. This stream immediately peaks in velocity ( mm s−1, 16 times higher than the surrounding silicon) and is entirely decoupled from its substratum ( %). Although similar relations between outburst floods and ice flow accelerations have been suspected in modern (Alley et al., 2006; Bell et al., 2007; Stearns et al., 2008) and former (Livingstone et al., 2016) ice sheets, they have been documented for valley glaciers only (e.g. Anderson et al., 2005). In these regions, they can produce sudden meltwater discharges that exceed the capacity of distributed subglacial meltwater drainages and promote basal decoupling and ice flow acceleration (e.g. Magnússon et al., 2007). The experiment confirms that outburst floods can promote basal decoupling and trigger ice streaming in ice sheets (Fowler and Johnson, 1995).
Stage 4 (Figs. 2d, 3d). The distributed subglacial drainage system starts to channelize: two valleys (TV1 and TV2) appear below the margin of the silicon layer and gradually expand by regressive erosion of the substratum. At this stage, TV1 is 30 mm long, 12 mm wide and 0.5 mm deep; TV2 is 80 mm long, 10 mm wide and 0.5 mm deep. These valleys, with their constant widths, undulating long profiles and radial distribution, are analogue to natural tunnel valleys in their dimensions, shapes, and spatial organization (Lelandais et al., 2016; Fig. 4). They are fed by distributed water drainage. The sand eroded from the substratum transits through these valleys and accumulates in high-angle marginal sedimentary fans, higher in elevation than the valley floors (TV1 fan is up to 27 mm long, 30 mm wide and 0.5 mm thick; TV2 fan is up to 20 mm long, 24 mm wide and 1 mm thick; Fig. S3). In response to progressive channelization of the water drainage into the expanding valleys, the silicon stream narrows and slows down (120 mm wide at the margin; mm s−1). The silicon stream, still channelized, still flows 8 times faster than the rest of the silicon layer and is still decoupled from the substratum ( %). These results are consistent with inferences that channelization of hitherto distributed subglacial water drainage systems can occur and reduce ice flow velocity after outburst floods (Kamb, 1987; Retzlaff and Bentley, 1993; Magnússon et al., 2007), and it can be responsible for narrowing and deceleration of ice streams (Raymond, 1987; Retzlaff and Bentley, 1993; Catania et al., 2006; Beem et al., 2014; Kim et al., 2016). At this stage of the experiment, this transition, which corresponds to the initiation of tunnel valleys, is not sufficient to stop ice streaming, however.
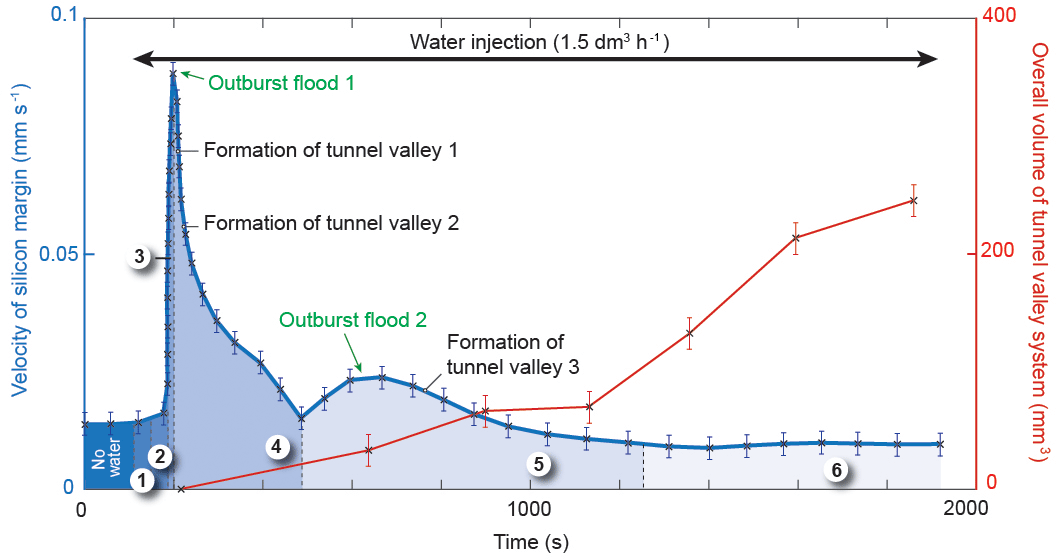
Figure 5Progressive expansion of overall volume of tunnel valley system vs. velocity of silicon margin through the experiment. The circled numbers correspond to the six stages of the proposed ice stream life cycle.
Stage 5 (Figs. 2e, 3e). A new transient water pocket grows below the silicon layer, migrates and drains as an outburst flood, thus forming a new low-angle marginal sedimentary fan with a lateral offset of 4 cm with respect to TV1. This induces the activation of a second stream ( mm s−1) decoupled from its substratum ( %) and the initiation of a new radial valley (TV3), in a hitherto slow-moving region of the silicon cap. Simultaneously, the first silicon stream switches off ( mm s−1) and recouples to its substratum ( %), but water and sand still flow through TV1 and TV2. At this stage, TV1 is 100 mm long, 8 mm wide, and 0.7 mm deep and its fan is up to 21 mm long, 40 mm wide, and 1.1 mm thick; TV2 is 80 mm long, 7.5 mm wide, and 0.6 mm deep and its fan is up to 20 mm long, 28 mm wide, and 1.6 mm thick. This result is consistent with inferences that natural ice streams can switch on and off, surge, and jump in location in response to changes in subglacial water drainage reorganization (Catania et al., 2012; Le Brocq et al., 2013; Beem et al., 2014; Hulbe et al., 2016). The experiment further indicates that this complex behaviour is controlled by the growth and migration, in various possible directions, of transient pressurized subglacial water pockets that form successively as long as the discharge capacity of tunnel valleys systems is not sufficient to efficiently drain the available meltwater.
Stage 6 (Figs. 2f, 3f). Since their initiation, TV1, TV2, and TV3 have progressively increased in width, depth and length. At this stage TV1 is 100 mm long, 17 mm wide, and 1.2 mm deep and its fan is 28 mm long, 4 mm wide, and 1.5 mm high at the maximum; TV2 is 80 mm long, 10 mm wide, and 0.8 mm deep and its fan is up to 16 mm long, 23 mm wide and 1.6 mm thick; TV3 is 60 mm long, 11 mm wide, and 0.55 mm deep and its fan is up to 14 mm long, 23 mm wide, and 0.7 mm thick. Their overall volume and discharge capacity have thus increased (Fig. 5). In response to this increased drainage efficiency, the second stream gradually decays ( mm s−1) and recouples to its substratum ( %). The silicon layer ultimately recovers a radial flow pattern (Fig. 3f). This result is consistent with the inference that ice streams may decelerate and even switch off in response to reduction of subglacial water pressures when efficient subglacial water drainage systems develop (Retzlaff and Bentley, 1993; Beem et al., 2014; Livingstone et al., 2016; Kim et al., 2016). In the experiment, this development is governed by the expansion of tunnel valley networks. Large glaciotectonic thrust masses at the ice margin near tunnel valley fans are generally assumed to be field evidence of a fast ice flow stage prior to drainage through tunnel valleys (Hooke and Jennings, 2006).

Figure 6Chronological sequence with interpretative sketches illustrating the proposed ice stream life cycle and the relations with tunnel valley development. Basal topography and surface flow velocity maps are derived from the experiment.
3.2 Experimental reproducibility and variability
This experiment has been reproduced 12 times with identical input parameters. We always observe the same processes and events acting in a similar chronological order: (1) water pocket forms, (2) water pocket migrates, (3) water pocket drains (outburst flood) and silicon stream switches on, (4) tunnel valleys form in response to channelization, (5) silicon stream slows down, and (6) it finally switches off in response to the increase in drainage efficiency during tunnel valley development. However, despite this consistency in the progress of all simulations, some variability has been detected. We measured different migration rates for the water pocket ranging from 30 to 80 s that may result from small changes in subglacial topography and in the dynamics of silicon–bed decoupling. Considering a constant water discharge and the characteristics of the experiment, a longer period of migration implies a longer period of water storage and a bigger water volume released at the silicon margin during the pocket drainage. We therefore recorded peak velocities for water pocket drainage ranging from 6.10−3 to 12.10−3 mm s−1. In response to variations in the water volume drained at the margin and peak discharge, the maximum width of the silicon stream varies from 120 to 250 mm. The magnitude of the outburst flood triggered during water pocket drainage also influences the number of tunnel valleys that subsequently form during the channelization stage. A high-magnitude outburst flood generates a wider erosion beneath the silicon that will be suitable for the development of multiple tunnel valleys. Hence, the number of tunnel valleys at the end of the experiments ranged from one to five with one to three tunnel valleys formed simultaneously during the initiation of the channelization stage. These valleys range from 40 to 120 mm long, 3 to 18 mm wide, and 0.3 to 1.8 mm deep. During tunnel valley development, the evolution of drainage efficiency varies among the experiments. A relatively inefficient system of tunnel valleys induces upstream water pocket formation. As observed in Fig. 3e, the drainage of this belated water pocket may provoke water rerouting beneath the silicon layer and subsequent lateral migration of the silicon stream. We counted zero to two events of silicon stream migration for single experiments. Finally, the time required to reach the phase of ice stream decay highly depends on the number of tunnel valleys formed during the experiments and their progressive development. We observed a lifetime for the silicon stream ranging from 500 to 1700 s, correlated with the evolution of the drainage efficiency during tunnel valley development.
The experiment demonstrates that, on flat and homogenous beds, ice streams may arise, progress, and decay in response to mechanical interactions among ice flow, subglacial water drainage, and bed erosion. On uneven or heterogeneous beds (not simulated in this model), these interactions may additionally be enhanced or disturbed by spatial variations in the subglacial topography, geology, and geothermal heat flux (e.g. Bentley, 1987; Blankenship et al., 1993; Anandakrishnan et al., 1998; Bourgeois et al., 2000; Winsborrow et al., 2010). The complex rheology of glacial ice and subglacial till (both generally soften with increasing strain rate, temperature, water content, and anisotropy) may also enhance these interactions by increasing velocity contrasts between ice streams and their slower-moving margins. This may lead to the development of narrower ice streams with higher velocities and sharper lateral shear margins in natural ice sheets than in the experiment (Raymond, 1987; Perol and Rice, 2015).
Although the complexity of glacial systems cannot be fully modelled using the present experimental setup, our results highlight the critical connection between ice streams and tunnel valleys. As reviewed in Kehew et al. (2012) and suggested in Ravier et al. (2015) this relation was suspected from the occurrence of tunnel valleys on ancient ice stream beds. However, it raised a contradiction: subglacial meltwater pressures are generally supposed to be high below ice streams (Bennett, 2003) while tunnel valleys are generally assumed to operate at lower water pressures (Marczinek and Piotrowski, 2006). Although speculated from field evidence, our results demonstrate that ice streaming, tunnel valley formation, release of marginal outburst floods, and subglacial water drainage reorganization may be interdependent parts of a single ice stream life cycle that involves temporal changes in subglacial meltwater pressures (Fig. 6).
-
Ice stream seeding. A prerequisite to the activation of ice streams is the formation of pressurized subglacial pockets by meltwater ponding in ice sheet hinterlands. Approximately circular regions of surface uplift and accelerated ice flow develop above these transient water pockets.
-
Ice stream gestation. Pressurized water pockets migrate downstream by distributed water flow. Regions of surface uplift and accelerated ice flow migrate accordingly.
-
Ice stream birth. Once water pockets reach ice sheet margins, they drain as outburst floods. At that time, ice streams switch on, peak in velocity, and propagate towards ice sheet hinterlands as decoupled corridors of accelerated ice flow underlain by pressurized distributed water drainage.
-
Ice stream ageing. Subglacial water drainage then channelizes gradually: tunnel valleys fed by pressurized distributed drainage start to form at ice stream fronts. Subsequent expansion of tunnel valleys by regressive erosion progressively increases their overall discharge capacity, lowers subglacial water pressures, and provokes gradual ice stream recoupling and deceleration. The response of ice stream dynamics to drainage channelization and tunnel valley development might be underestimated due to the high erodibility of the subglacial bed used in the experiment.
-
Ice stream rebirth (relocation or surge). As long as tunnel valley systems keep low drainage capacities, successive pressurized subglacial water pockets can form, migrate, and drain as marginal outburst floods. On even and homogeneous ice sheet beds, the subglacial water drainage is controlled by the surface topography of ice sheets: subtle temporal changes in this topography may thus be able to produce consecutive generations of ice streams and tunnel valleys at different locations and with different flow directions. These jumps in locations and directions may be responsible for the formation of independent, but sometimes intersecting, ice stream corridors and tunnel valley networks on some ancient ice sheet beds (Fowler and Johnson, 1995; Jørgensen and Piotrowski, 2003). By contrast, if subglacial water routes and ice flow are constrained by bed heterogeneities, migration of successive subglacial water pockets along predetermined paths may induce sequential ice stream surges (Fowler and Johnson, 1995; Hulbe et al., 2016) and participate in the gradual development of complex tunnel valley systems at fixed places, like the McMurdo Dry Valleys “labyrinth” in Antarctica (Lewis et al., 2006).
-
Ice stream senescence. Ice streams may ultimately switch off when drainage capacities of tunnel valley systems are sufficient to limit subglacial water overpressures. The progressive decay of an ice stream activity can be partially produced by the thinning of the ice layer and the subsequent reduction of the stress driving ice flow in ice stream corridors (Robel et al., 2013). Our experiments display negligible thinning prior to ice stream decay. With a constant water discharge being applied in experiments, we demonstrate that increased drainage efficiency during tunnel valley development can solely be responsible for ice stream slowdown. Tunnel valleys and ice streams are frequently found to coexist, as exemplified by the many examples reported from the southern margin of the Laurentide Ice Sheet (Patterson, 1997; Livingstone and Clark, 2016). In one case, development of tunnel valleys has been suggested to have led to stagnation of ice flow at an ice stream terminus (Patterson, 1997), a process that we have now demonstrated by modelling. This further indicates that tunnel valley development could secure ice sheet stability as hinted by Marczinek and Piotrowski (2006) by preventing ice stream destabilization. We apply a constant meltwater discharge to our model; however meltwater production and discharge in a subglacial system fluctuates at different timescales (day, year, decades). Fluctuating water production may have further implications on the size of ice streams, the size and number of tunnel valleys that develop through time, and the timescale involved in ice sheet destabilization and stabilization. The oscillation in water production could strengthen and multiply the life cycles of some transitory ice streams, already deciphered with a constant water discharge in this study.
In a global change context, phenomena of ice stream stabilization would require that pre-existing and newly forming tunnel valley systems expand sufficiently fast to accommodate increased meltwater production. Investigating the processes and rates of tunnel valley development is warranted more than ever to better assess ancient and present-day ice sheet behaviour.
The transitory and mobile nature of ice streams may be understood in the framework of a model life cycle that involves temporal changes in subglacial meltwater pressures and arises from interactions among ice flow, subglacial water drainage, and bed erosion. In this model life cycle transitory ice streams arise, progress and decay in response to subglacial flooding, changes in type and efficiency of subglacial drainage, and development of tunnel valleys. These results are consistent with (and reconcile) a variety of otherwise detached observations performed at different timescales and at different places, on modern and ancient natural ice streams. One of the most novel outcomes of this study is that subglacial tunnel valley development may be crucial in controlling ice stream vanishing and perhaps, as a consequence, in preventing catastrophic ice sheet collapses during periods of climate change (Hulbe, 2017). The processes and rates of tunnel valley development are thus major issues for predicting the forthcoming behaviour of present-day ice sheets and for assessing their contribution to the release of ice and freshwater to the ocean. The innovative experimental approach used here opens new perspectives on the understanding of subglacial processes controlling ice sheet dynamics and destabilization.
All datasets used in this paper are available from the corresponding author on request.
The supplement related to this article is available online at: https://doi.org/10.5194/tc-12-2759-2018-supplement.
OB, RM, ER, and SP conceived this research and gathered funding. TL designed and conducted the experiments (setup, monitoring, and post-treatment), with contributions by RM and PS. TL, ER, OB, CDC, SP, and RM contributed to the interpretation of the results and of their natural implications. TL wrote the first draft of the paper; ER, OB, SP, and CDC contributed substantially to its present version.
The authors declare that they have no conflict of interest.
This study is part of the DEFORm project (Deformation and Erosion by Fluid
Overpressure) funded by “Région Pays de la Loire”. Additional financial
support was provided by the French “Agence Nationale de la Recherche”
through grant ANR-12-BS06-0014 “SEQSTRAT-ICE” and the “Institut National
des Sciences de l'Univers” (INSU) through the “Programme National de
Planétologie” (PNP) and “Système Terre: Processus et Couplages
(SYSTER)” programmes.
Edited by: Arjen Stroeven
Reviewed by: Carrie Jennings and one anonymous referee
Alley, R. B., Blankenship, D. D., Rooney, S. T., and Bentley, C. R.: Till beneath ice stream B: 4. A coupled ice-till flow model, J. Geophys. Res.-Sol. Ea., 92, 8931–8940, https://doi.org/10.1029/JB092iB09p08931, 1987.
Alley, R. B., Dupont, T. K., Parizek, B. R., Anandakrishnan, S., Lawson, D. E., Larson, G. J., and Evenson, E. B.: Outburst flooding and the initiation of ice-stream surges in response to climatic cooling: A hypothesis, Geomorphology, 75, 76–89, https://doi.org/10.1016/j.geomorph.2004.01.011, 2006.
Anandakrishnan, S., Blankenship, D. D., Alley, R. B., and Stoffa, P. L.: Influence of subglacial geology on the position of a West Antarctic ice stream from seismic observations, Nature, 394, 62–65, https://doi.org/10.1038/27889, 1998.
Anderson, R. S., Walder, J. S., Anderson, S. P., Trabant, D. C., and Fountain, A. G.: The dynamic response of Kennicott Glacier, Alaska, USA, to the Hidden Creek Lake outburst flood, Ann. Glaciol., 40, 237–242, https://doi.org/10.3189/172756405781813438, 2005.
Bamber, J. L., Vaughan, D. G., and Joughin, I.: Widespread Complex Flow in the Interior of the Antarctic Ice Sheet, Science, 287, 1248–1250, https://doi.org/10.1126/science.287.5456.1248, 2000.
Beckley, B., Zelensky, N. P., Holmes, S. A., Lemoine, F. G., Ray, R. D., Mitchum, G. T., Desai, S., and Brown, S. T.: Global Mean Sea Level Trend from Integrated Multi-Mission Ocean Altimeters TOPEX/Poseidon Jason-1 and OSTM/Jason-2 Version 3. Ver. 3. PO.DAAC, CA, USA, Dataset, https://doi.org/10.5067/GMSLM-TJ123, 2015.
Beem, L. H., Tulaczyk, S. M., King, M. A., Bougamont, M., Fricker, H. A., and Christoffersen, P.: Variable deceleration of Whillans Ice Stream, West Antarctica, J. Geophys. Res.-Earth, 119, 212–224, https://doi.org/10.1002/2013JF002958, 2014.
Bell, R. E., Studinger, M., Shuman, C. A., Fahnestock, M. A., and Joughin, I.: Large subglacial lakes in East Antarctica at the onset of fast-flowing ice streams, Nature, 445, 904–907, https://doi.org/10.1038/nature05554, 2007.
Bennett, M. R.: Ice streams as the arteries of an ice sheet: their mechanics, stability and significance, Earth-Sci. Rev., 61, 309–339, https://doi.org/10.1016/S0012-8252(02)00130-7, 2003.
Bentley, C. R.: Antarctic ice streams: a review, J. Geophys. Res.-Sol. Ea., 92, 8843–8858, https://doi.org/10.1029/JB092iB09p08843, 1987.
Bingham, R. G., King, E. C., Smith, A. M., and Pritchard, H. D.: Glacial geomorphology: towards a convergence of glaciology and geomorphology, Prog. Phys. Geog., 34, 327–355, https://doi.org/10.1177/0309133309360631, 2010.
Blankenship, D. D., Bell, R. E., Hodge, S. M., Brozena, J. M., Behrendt, J. C., and Finn, C. A.: Active volcanism beneath the West Antarctic ice sheet and implications for ice-sheet stability, Nature, 361, 526–529, https://doi.org/10.1038/361526a0, 1993.
Bourgeois, O., Dauteuil, O., and Van Vliet-Lanoe, B.: Geothermal control on flow patterns in the Last Glacial Maximum ice sheet of Iceland, Earth Surf. Proc. Land., 25, 59–76, https://doi.org/10.1002/(SICI)1096-9837(200001)25:1<59::AID-ESP48>3.0.CO;2-T, 2000.
Carter, S. P., Fricker, H. A., and Siegfried, M. R.: Evidence of rapid subglacial water piracy under Whillans Ice Stream, West Antarctica, J. Glaciol., 59, 1147–1162, https://doi.org/10.3189/2013JoG13J085, 2013.
Carter, S. P., Fricker, H. A., and Siegfried, M. R.: Antarctic subglacial lakes drain through sediment-floored canals: theory and model testing on real and idealized domains, The Cryosphere, 11, 381–405, https://doi.org/10.5194/tc-11-381-2017, 2017.
Catania, G. and Paola, C.: Braiding under glass, Geology, 29, 259–262, https://doi.org/10.1130/0091-7613(2001)029<0259:BUG>2.0.CO;2, 2001.
Catania, G., Hulbe, C., Conway, H., Scambos, T. A., and Raymond, C. F.: Variability in the mass flux of the Ross ice streams, West Antarctica, over the last millennium, J. Glaciol., 58, 741–752, https://doi.org/10.3189/2012JoG11J219, 2012.
Catania, G. A., Scambos, T. A., Conway, H., and Raymond, C. F.: Sequential stagnation of Kamb ice stream, West Antarctica, Geophys. Res. Lett., 33, L14502 https://doi.org/10.1029/2006GL026430, 2006.
Elsworth, C. W. and Suckale, J.: Rapid ice flow rearrangement induced by subglacial drainage in West Antarctica, Geophys. Res. Lett., 43, 697–707, https://doi.org/10.1002/2016GL070430, 2016.
Engelhardt, H., Humphrey, N., Kamb, B., and Fahnestock, M.: Physical conditions at the base of a fast moving antarctic ice stream, Science, 248, 57–59, https://doi.org/10.1126/science.248.4951.57, 1990.
Evatt, G. W., Fowler, A. C., Clark, C. D., and Hulton, N. R. J.: Subglacial floods beneath ice sheets, Philos. T. R. Soc. A, 364, 1769–1794, https://doi.org/10.1098/rsta.2006.1798, 2006.
Flowers, G. E.: Modelling water flow under glaciers and ice sheets, P. Roy. Soc. A-Math. Phy., 471, 20140907, https://doi.org/10.1098/rspa.2014.0907, 2015.
Fountain, A. G. and Walder, J. S.: Water flow through temperate glaciers, Rev. Geophys., 36, 299–328, https://doi.org/10.1029/97RG03579, 1998.
Fowler, A. C. and Johnson, C.: Hydraulic run-away: a mechanism for thermally regulated surges of ice sheets, J. Glaciol., 41, 454–461, https://doi.org/10.3189/S002214300003478X, 1995.
Fricker, H. A., Scambos, T., Bindschadler, R., and Padman, L.: An active subglacial water system in West Antarctica mapped from space, Science, 315, 1544–1548, https://doi.org/10.1126/science.1136897, 2007.
Glen, J. W.: The stability of ice-dammed lakes and other water-filled holes in glaciers, J. Glaciol., 2, 316–318, https://doi.org/10.3189/S0022143000025132, 1954.
Gray, L., Joughin, I., Tulaczyk, S., Spikes, V. B., Bindschadler, R., and Jezek, K.: Evidence for subglacial water transport in the West Antarctic Ice Sheet through three-dimensional satellite radar interferometry, Geophys. Res. Lett., 32, L03501, https://doi.org/10.1029/2004GL021387, 2005.
Hanson, B., Hooke, R. L., and Grace, E. M.: Short-term velocity and water-pressure variations down-glacier from a riegel, Storglaciären, Sweden, J. Glaciol., 44, 359–367, https://doi.org/10.3189/S0022143000002689, 1998.
Hindmarsh, R. C. A.: Consistent generation of ice-streams via thermo-viscous instabilities modulated by membrane stresses, Geophys. Res. Lett., 36, L06502, https://doi.org/10.1029/2008GL036877, 2009.
Hooke, R. L. and Jennings, C. E.: On the formation of the tunnel valleys of the southern Laurentide ice sheet, Quaternary Sci. Rev., 25, 1364–1372, https://doi.org/10.1016/j.quascirev.2006.01.018, 2006.
Hulbe, C.: Is ice sheet collapse in West Antarctica unstoppable?, Science, 356, 910–911, https://doi.org/10.1126/science.aam9728, 2017.
Hulbe, C. L., Scambos, T. A., Klinger, M., and Fahnestock, M. A.: Flow variability and ongoing margin shifts on Bindschadler and MacAyeal Ice Streams, West Antarctica, J. Geophys. Res.-Earth, 121, 283–293, https://doi.org/10.1002/2015JF003670, 2016.
Jørgensen, F. and Piotrowski, J. A.: Signature of the Baltic ice stream on Funen Island, Denmark during the Weichselian glaciation, Boreas, 32, 242–255, https://doi.org/10.1111/j.1502-3885.2003.tb01440.x, 2003.
Kamb, B.: Glacier surge mechanism based on linked cavity configuration of the basal water conduit system, J. Geophys. Res.-Sol. Ea., 92, 9083–9100, https://doi.org/10.1029/JB092iB09p09083, 1987.
Kehew, A. E., Piotrowski, J. A., and Jørgensen, F.: Tunnel valleys: Concepts and controversies. A review, Earth-Sci. Rev., 113, 33–58, https://doi.org/10.1016/j.earscirev.2012.02.002, 2012.
Kim, B.-H., Lee, C.-K., Seo, K.-W., Lee, W. S., and Scambos, T.: Active subglacial lakes and channelized water flow beneath the Kamb Ice Stream, The Cryosphere, 10, 2971–2980, https://doi.org/10.5194/tc-10-2971-2016, 2016.
Kleiner, T. and Humbert, A.: Numerical simulations of major ice streams in western Dronning Maud Land, Antarctica, under wet and dry basal conditions, J. Glaciol., 60, 215–232, https://doi.org/10.3189/2014JoG13J006, 2014.
Kowal, K. N. and Worster, M. G.: Lubricated viscous gravity currents, J. Fluid Mech., 766, 626–655, https://doi.org/10.1017/jfm.2015.30, 2015.
Kyrke-Smith, T. M., Katz, R. F., and Fowler, A. C.: Subglacial hydrology and the formation of ice streams, P. Roy Soc. A-Math. Phy., 470, 20130494, https://doi.org/10.1098/rspa.2013.0494, 2014.
Le Brocq, A. M., Ross, N., Griggs, J. A., Bingham, R. G., Corr, H. F. J., Ferraccioli, F., Jenkins, A., Jordan, T. A., Payne, A. J., Rippin, D. M., and Siegert, M. J.: Evidence from ice shelves for channelized meltwater flow beneath the Antarctic Ice Sheet, Nat. Geosci., 6, 945–948, https://doi.org/10.1038/ngeo1977, 2013.
Lelandais, T., Mourgues, R., Ravier, É., Pochat, S., Strzerzynski, P., and Bourgeois, O.: Experimental modeling of pressurized subglacial water flow: Implications for tunnel valley formation, J. Geophys. Res.-Earth, 121, 2022–2041, https://doi.org/10.1002/2016JF003957, 2016.
Lewis, A. R., Marchant, D. R., Kowalewski, D. E., Baldwin, S. L., and Webb, L. E.: The age and origin of the Labyrinth, western Dry Valleys, Antarctica: Evidence for extensive middle Miocene subglacial floods and freshwater discharge to the Southern Ocean, Geology, 34, 513–516, https://doi.org/10.1130/G22145.1, 2006.
Livingstone, S. J. and Clark, C. D.: Morphological properties of tunnel valleys of the southern sector of the Laurentide Ice Sheet and implications for their formation, Earth Surf. Dynam., 4, 567–589, https://doi.org/10.5194/esurf-4-567-2016, 2016.
Livingstone, S. J., Utting, D. J., Ruffell, A., Clark, C. D., Pawley, S., Atkinson, N., and Fowler, A. C.: Discovery of relict subglacial lakes and their geometry and mechanism of drainage, Nat. Commun., 7, 11767, https://doi.org/10.1038/ncomms11767, 2016.
Magnússon, E., Rott, H., Björnsson, H., and Pálsson, F.: The impact of jökulhlaups on basal sliding observed by SAR interferometry on Vatnajökull, Iceland, J. Glaciol., 53, 232–240, https://doi.org/10.3189/172756507782202810, 2007.
Marczinek, S. and Piotrowski, J. A.: Groundwater flow under the margin of the last Scandinavian ice Sheet Around the EckernföRde Bay, Northwest Germany, in: Glacier Science and Environmental Change, edited by: Knight, P. G., 60–62, https://doi.org/10.1002/9780470750636.ch10, 2006.
Margold, M., Stokes, C. R., Clark, C. D., and Kleman, J.: Ice streams in the Laurentide Ice Sheet: a new mapping inventory, J. Maps., 11, 380–395, https://doi.org/10.1080/17445647.2014.912036, 2015.
Marshall, S. J.: Recent advances in understanding ice sheet dynamics, Earth Planet. Sc. Lett., 240, 191–204, https://doi.org/10.1016/j.epsl.2005.08.016, 2005.
Paola, C., Straub, K., Mohrig, D., and Reinhardt, L.: The unreasonable effectiveness of stratigraphic and geomorphic experiments, Earth-Sci. Rev., 97, 1–43, https://doi.org/10.1080/17445647.2014.912036, 2009.
Paterson, W. S. B.: Pergamon Kidlington, The Physics of Glaciers, Elsevier Science Ltd, Great Britain, 480 pp., 1994.
Patterson, C. J.: Southern Laurentide ice lobes were created by ice streams: Des Moines Lobe in Minnesota, USA, Sediment. Geol., 111, 249–261, https://doi.org/10.1016/S0037-0738(97)00018-3, 1997.
Payne, A. J. and Dongelmans, P. W.: Self-organization in the thermomechanical flow of ice sheets, J. Geophys. Res.-Sol. Ea., 102, 12219–12233, https://doi.org/10.1029/97JB00513, 1997.
Perol, T. and Rice, J. R.: Shear heating and weakening of the margins of West Antarctic ice streams, Geophys. Res. Lett., 42, 3406–3413, https://doi.org/10.1002/2015GL063638, 2015.
Peters, L. E., Anandakrishnan, S., Alley, R. B., and Smith, A. M.: Extensive storage of basal meltwater in the onset region of a major West Antarctic ice stream, Geology, 35, 251–254, https://doi.org/10.1130/G23222A.1, 2007.
Ravier, E., Buoncristiani, J. F., Menzies, J., Guiraud, M., Clerc, S., and Portier, E.: Does porewater or meltwater control tunnel valley genesis? Case studies from the Hirnantian of Morocco, Palaeogeogr. Palaeocl., 418, 359–376, https://doi.org/10.1016/j.palaeo.2014.12.003, 2015.
Raymond, C. F.: How do glaciers surge? A review, J. Geophys. Res.-Sol. Ea., 92, 9121–9134, https://doi.org/10.1029/JB092iB09p09121, 1987.
Retzlaff, R. and Bentley, C. R.: Timing of stagnation of Ice Stream C, West Antarctica, from short-pulse radar studies of buried surface crevasses, J. Glaciol., 39, 553–561, https://doi.org/10.3189/S0022143000016440, 1993.
Robel, A. A., Degiuli, E., Schoof, C., and Tziperman, E.: Dynamics of ice stream temporal variability?: Modes, scales, and hysteresis, J. Geophys. Res.-Earth, 118, 925–936, https://doi.org/10.1002/jgrf.20072, 2013.
Rothlisberger, H. and Lang, H.: Glacial hydrology. Glacio-Fluvial Sediment Transfer: An Alpine Perspective, Gurnell and Clark, John Wiley and Sons, New York New York, 207–284, 1987.
Shreve, R. L.: Movement of water in glaciers, J. Glaciol., 11, 205–214, https://doi.org/10.3189/S002214300002219X, 1972.
Siegfried, M. R., Fricker, H. A., Carter, S. P., and Tulaczyk, S.: Episodic ice velocity fluctuations triggered by a subglacial flood in West Antarctica, Geophys. Res. Lett., 43, 2640–2648, https://doi.org/10.1002/2016GL067758, 2016.
Stearns, L. A., Smith, B. E., and Hamilton, G. S.: Increased flow speed on a large East Antarctic outlet glacier caused by subglacial floods, Nat. Geosci., 1, 827–831, https://doi.org/10.1038/ngeo356, 2008.
Vaughan, D. G., Corr, H. F. J., Smith, A. M., Pritchard, H. D., and Shepherd, A.: Flow-switching and water piracy between Rutford Ice Stream and Carlson Inlet, West Antarctica, J. Glaciol., 54, 41–48, https://doi.org/10.3189/002214308784409125, 2008.
Vaughan, D. G., Comiso, J. C., Allison, I., Carrasco, J., Kaser, G., Kwok, R., Mote, P., Murray, T., Paul, F., Ren, J., Rignot, E., Solomina, O., Steffen, K., and Zhang, T.: Observations: Cryosphere, in: Climate Change 2013: The Physical Science Basis, Contribution of Working Group I to the Fifth Assessment Report of the Intergovernmental Panel on Climate Change, edited by: Stocker, T. F., Qin, D., Plattner, G.-K., Tignor, M., Allen, S. K., Boschung, J., Nauels, A., Xia, Y., Bex, V., and Midgley, P. M., Cambridge University Press, Cambridge, United Kingdom and New York, NY, USA, 2013.
Winsborrow, M. C. M., Clark, C. D., and Stokes, C. R.: What controls the location of ice streams?, Earth-Sci. Rev., 103, 45–59, https://doi.org/10.1016/j.earscirev.2010.07.003, 2010.