the Creative Commons Attribution 4.0 License.
the Creative Commons Attribution 4.0 License.
 | 14 Mar 2018
Near-surface temperature inversion during summer at Summit, Greenland, and its relation to MODIS-derived surface temperatures
Mary R. Albert
Dorothy K. Hall
As rapid warming of the Arctic occurs, it is imperative that climate indicators such as temperature be monitored over large areas to understand and predict the effects of climate changes. Temperatures are traditionally tracked using in situ 2 m air temperatures and can also be assessed using remote sensing techniques. Remote sensing is especially valuable over the Greenland Ice Sheet, where few ground-based air temperature measurements exist. Because of the presence of surface-based temperature inversions in ice-covered areas, differences between 2 m air temperature and the temperature of the actual snow surface (referred to as “skin” temperature) can be significant and are particularly relevant when considering validation and application of remote sensing temperature data. We present results from a field campaign extending from 8 June to 18 July 2015, near Summit Station in Greenland, to study surface temperature using the following measurements: skin temperature measured by an infrared (IR) sensor, 2 m air temperature measured by a National Oceanic and Atmospheric Administration (NOAA) meteorological station, and a Moderate Resolution Imaging Spectroradiometer (MODIS) surface temperature product. Our data indicate that 2 m air temperature is often significantly higher than snow skin temperature measured in situ, and this finding may account for apparent biases in previous studies of MODIS products that used 2 m air temperature for validation. This inversion is present during our study period when incoming solar radiation and wind speed are both low. As compared to our in situ IR skin temperature measurements, after additional cloud masking, the MOD/MYD11 Collection 6 surface temperature standard product has an RMSE of 1.0 ∘C and a mean bias of −0.4 ∘C, spanning a range of temperatures from −35 to −5 ∘C (RMSE = 1.6 ∘C and mean bias = −0.7 ∘C prior to cloud masking). For our study area and time series, MODIS surface temperature products agree with skin surface temperatures better than previous studies indicated, especially at temperatures below −20 ∘C, where other studies found a significant cold bias. We show that the apparent cold bias present in other comparisons of 2 m air temperature and MODIS surface temperature may be a result of the near-surface temperature inversion. Further investigation of how in situ IR skin temperatures compare to MODIS surface temperature at lower temperatures (below −35 ∘C) is warranted to determine whether a cold bias exists for those temperatures.
- Article
(7661 KB) -
Supplement
(190 KB) - BibTeX
- EndNote


The Arctic is experiencing warming at a more rapid rate than the rest of the world (Stocker, 2014), but the impacts of this increased temperature extend beyond the polar region. Declining sea ice extent and retreat of glaciers contribute to a powerful ice–albedo feedback that results in further warming on a large scale. This increased warming leads to declining mass balance of the Greenland Ice Sheet, contributing to global sea level rise. Quantifying current and future ice sheet mass balance remains an active area of research (e.g., Rignot et al., 2011; Rae et al., 2012; Vernon et al., 2013) and is critical to improving projections of sea level rise. Declining Greenland Ice Sheet mass balance is driven in part by changes in surface energy balance, which drives surface temperature and surface melt (Box, 2013; van den Broeke et al., 2016). Tracking surface temperatures then allows us to monitor surface melt for mass balance considerations and also informs our understanding of key ice sheet surface processes. Surface temperature changes result from fluctuations in the surface energy balance, which controls the exchange between the snow surface and the atmospheric surface layer. The surface energy balance (dependant on net radiation, sensible and latent heat fluxes, and conduction from underlying snow and ice) affects the stability of the near-surface atmosphere and the extent to which turbulent heat exchange occurs between the snow surface and the lower atmosphere, impacting both local and regional circulation and climate. Surface temperature processes also play an important role in paleoclimate records that are stored within ice sheets (Waddington and Morse, 1994; Van Lipzig et al., 2002).
Surface temperature is a critical component for monitoring ice sheet mass balance, tracking changes in surface energy balance and atmospheric exchange, and understanding processes that affect paleoclimate records; however, making accurate measurements of surface temperature across the vast expanse of the Greenland Ice Sheet over a long period of time is challenging (Reeves Eyre and Zeng, 2017). The installation of automatic weather stations (AWS) across the ice sheet has begun to provide point meteorological data at many locations through programs such as Greenland Climate Network (GC-Net) (e.g., Steffen et al., 1996; Steffen and Box, 2001; Shuman et al., 2001) and the Programme for Monitoring of the Greenland Ice Sheet (PROMICE), which monitors both skin and air temperatures (e.g., Ahlstrøm et al., 2008; van As et al., 2011; Fausto et al., 2012). In addition, thermal infrared (IR) satellite remote sensing provides the opportunity to collect surface temperature with large spatial coverage and sub-daily to weekly temporal resolution, depending on cloud conditions. In this study, we will focus on the Moderate Resolution Imaging Spectroradiometer (MODIS) thermal IR land surface temperature (LST) product.
“Surface” temperatures in climatological studies often refer to 2 m air temperature (Hudson and Brandt, 2005) as it is a standard measurement at meteorological stations around the globe; however, remotely sensed surface temperatures from satellite-borne sensors in the cryosphere measure the radiometric surface temperature, which is the actual “skin” temperature of the surface at the snow–air interface (Warren and Brandt, 2008). Thermal stratification near the snow surface causes differences between the 2 m air temperature and the skin temperature. Incoming solar irradiance and wind speed are two major controls on thermal stratification. Temperature inversions occur when the incoming solar irradiance is small (i.e., during night) and the snow surface emits longwave radiation; the net radiation at the surface is negative, causing heat transport from the air to the snow surface and lower temperatures at the snow surface than in the air directly above it. The opposite phenomenon of temperature lapse can occur when there is significant incoming solar irradiance resulting in net positive radiation at the surface, with higher temperatures closer to the ground surface and upward heat transport from the snow surface to the air. Winds can serve to neutralize these temperature gradients by mixing air masses. In the polar regions, the high albedo of snow in the visible part of the spectrum means relatively little solar radiation is absorbed even during periods of sunlight. Combined with high emissivity of snow at longer wavelengths as compared to the emissivity of the atmosphere, conditions in polar regions often result in the presence of inversions.
The presence of surface-based inversions in the hundreds of meters of the lower atmosphere in the polar regions has long been established (Sverdrup, 1926), and the phenomenon can be detected through measurements of temperature at two or more heights to determine the magnitude and sign of the temperature difference over the relevant height difference. Lower atmospheric inversions have been characterized in Greenland and the wider Arctic (Reeh, 1989; Kahl, 1990; Overland and Guest, 1991) as well as in Antarctica (Philpot and Zillman, 1970). “Surface-based” inversions have typically been studied with 2 m air temperature as the base of the inversion and the height of the inversion extending hundreds of meters or more into the atmosphere. However, work by Hudson and Brandt (2005) demonstrated the presence of a surface-based temperature inversion below 2 m in the winter of 2001 at South Pole in Antarctica, showing that the largest temperature gradient was in the 20 cm nearest to the snow surface. Hall et al. (2008) analyzed 2 m air temperature data and skin temperature data from across Greenland and discussed conditions that lead to near-surface thermal stratification over snow-covered areas. Good (2016) presents measurements of skin temperature and 2 m air temperature and finds that at polar sites, during snow-covered seasons in fall, winter, and spring, these two temperatures generally agree well, with the caveat that there is a reduced amplitude of diurnal cycle temperatures at 2 m, which would imply a temperature inversion during the night and a temperature lapse during the day. In work using satellite data to study warming trends in the Arctic, Comiso (2003) presents a dataset from an Arctic sea ice study showing correlation between 2 m air temperature and skin temperature that had been averaged monthly. Over sea ice, there was an average offset of 0.34 ∘C between air and skin temperature (a temperature lapse), but the author indicates that similar data from Greenland show a negative offset, perhaps due to inversions that are not well understood.
In recent years, studies have been conducted on surface energy balance and near-surface processes in Greenland (e.g., Miller et al., 2013, 2015, 2017; Berkelhammer et al., 2016) and Antarctica (e.g., van As et al., 2005; van den Broeke et al., 2006; Kuipers Munneke et al., 2012). At our study site at Summit, Greenland, Miller et al. (2013) studied the inversions over 2 years but considered the 2 m air temperature to be the base of these inversions, and they did not investigate the surface processes beneath 2 m height. They find that inversions are prevalent in winter months and are less intense during summer months and that the presence of clouds results in weaker inversions. In Miller et al. (2015) the impact of clouds on the surface energy budget at Summit is further investigated, and the warming effect of clouds on 2 m air temperatures is shown in all seasons. Details of the Summit, Greenland, surface energy balance are extensively documented in Miller et al. (2017). Berkelhammer et al. (2016) discuss the impacts of the surface-based temperature inversions on boundary-layer dynamics, showing that the stability of the atmosphere prevents mixing and ultimately limits accumulation at Summit. These recent studies have investigated near-surface processes at Summit because of the importance of surface energy balance and turbulent snow–atmosphere exchange in climate monitoring and ultimately prediction of larger-scale circulation and future change in ice mass balance. Though some surface temperature measurements at Summit have been made (Berkelhammer et al., 2016), controls on surface temperature gradients in the lowest 2 m of the atmosphere, which are most relevant for the remote sensing community and also have important implications for changing ice sheet dynamics, have not been explicitly studied at Summit, Greenland.
In remote sensing validation studies or use of remotely sensed temperatures, this distinction between 2 m air temperature and skin temperature is important and has been demonstrated in polar regions (Comiso, 2003). Indeed, best practices for thermal remote sensing validation indicate that ground-based radiance measurements that yield a skin temperature provide the best validation of remote sensing land surface temperature products (Guillevic et al., 2017). Because these data have not always been available, previous studies have used a variety of measurement types for remote sensing surface temperature validation.
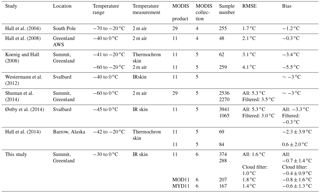
A number of validation studies present results acquired over various timescales and in different locations to determine the accuracy of the MODIS surface temperature products in the cryosphere (Hall et al., 2004, 2008, 2015; Koenig and Hall, 2010; Westermann et al., 2012; Hachem et al., 2012; Shuman et al., 2014; Østby et al., 2014; Shamir and Georgakakos, 2014; Williamson et al., 2017). Table 1 provides summary statistics related to the results of many of these validation studies and is discussed in further detail in the discussion section. Overall, a negative bias is present in nearly all validation studies, where the MODIS surface temperature is lower than the measured skin or 2 m air temperatures, and this bias is particularly prevalent at temperatures below −20 ∘C. Some studies (e.g., Hall et al., 2004, 2008; Shuman et al., 2014) use 2 m air temperature to validate the MODIS surface temperature products, which may be part of the reason for the biases that are consistently present. Shuman et al. (2014) acknowledge that differences between 2 m air temperature and skin temperature caused by inversions could cause bias in their comparison to MODIS, but at the time there were insufficient data to suggest whether inversions would persist in central Greenland and in the very near-surface. Other studies use Thermochron loggers, either shielded (e.g., Hall et al., 2015) or during darkness (Koenig and Hall, 2010). However, Westermann et al. (2012) and Østby et al. (2014) both use pyrometers to measure thermal longwave radiation and estimate surface (skin) temperature, and these studies also find a cold bias in the MODIS surface temperatures. Østby et al. (2014) indicate that this bias is present at lower temperatures during the winter (and that there is a slight warm bias in the MODIS temperatures during summer), whereas Westermann et al. (2012) show a cold bias at higher temperatures. Identifying if and when this bias is indeed present is critical to the use of the MODIS surface temperature products over the ice sheet. We hypothesize that a cold bias between 2 m air temperature and skin surface temperature could be indicative of physical processes of temperature inversion and not any issue of MODIS instrument calibration, and coupled datasets can be used to further develop our understanding of temperature processes in polar regions.
Table 1Summary statistics from recent literature comparing MODIS surface temperature products to in situ surface temperature measurements in snow-covered regions.
In the summer of 2015, we conducted a field campaign near Summit Station, Greenland, to measure skin and near-surface air temperature to study near-surface thermal stratification and determine its impact in validation of the MODIS land surface temperature product. We use our original dataset to determine how summertime meteorological conditions impact near-surface inversions (beneath 2 m height) on the ice sheet at Summit. Furthermore, we provide a validation of MODIS land surface temperatures and show that the use of 2 m air temperature for MODIS validation is not recommended due to the presence of near-surface inversions. Lastly, we use in situ cloud data to show that the accuracy of the MODIS surface temperature product could be improved through stricter cloud masking.
2.1 In situ measurements
To characterize snow skin temperature, an autonomous measurement station was installed approximately 10 km NNW of Summit, Greenland (indicated on a map in Fig. 1), at an undisturbed site for 40 days between 8 June and 18 July 2015. A Campbell Scientific Apogee Precision IR radiometer (model SI-111) was used to measure skin temperature of the snow. The instrument covers the wavelength range from 8 to 14 µm. It has a stated absolute accuracy of ±0.5 ∘C from −40 to −10 ∘C and ±0.2 ∘C from −10 to 65 ∘C. The sensor was factory calibrated within several months of its deployment. The sensor was mounted on a horizontal rod extending approximately 60 cm out from the supporting tripod, and the sensor was approximately 60 cm from the surface, pointed directly downward. The field of view of the sensor is 22∘ half angle, so the legs of the tripod did not affect the measurements. Figure 2 shows an image of the sensor setup. Measurements were recorded every 30 min, and the recorded measurements represent an average of readings taken every 5 min.
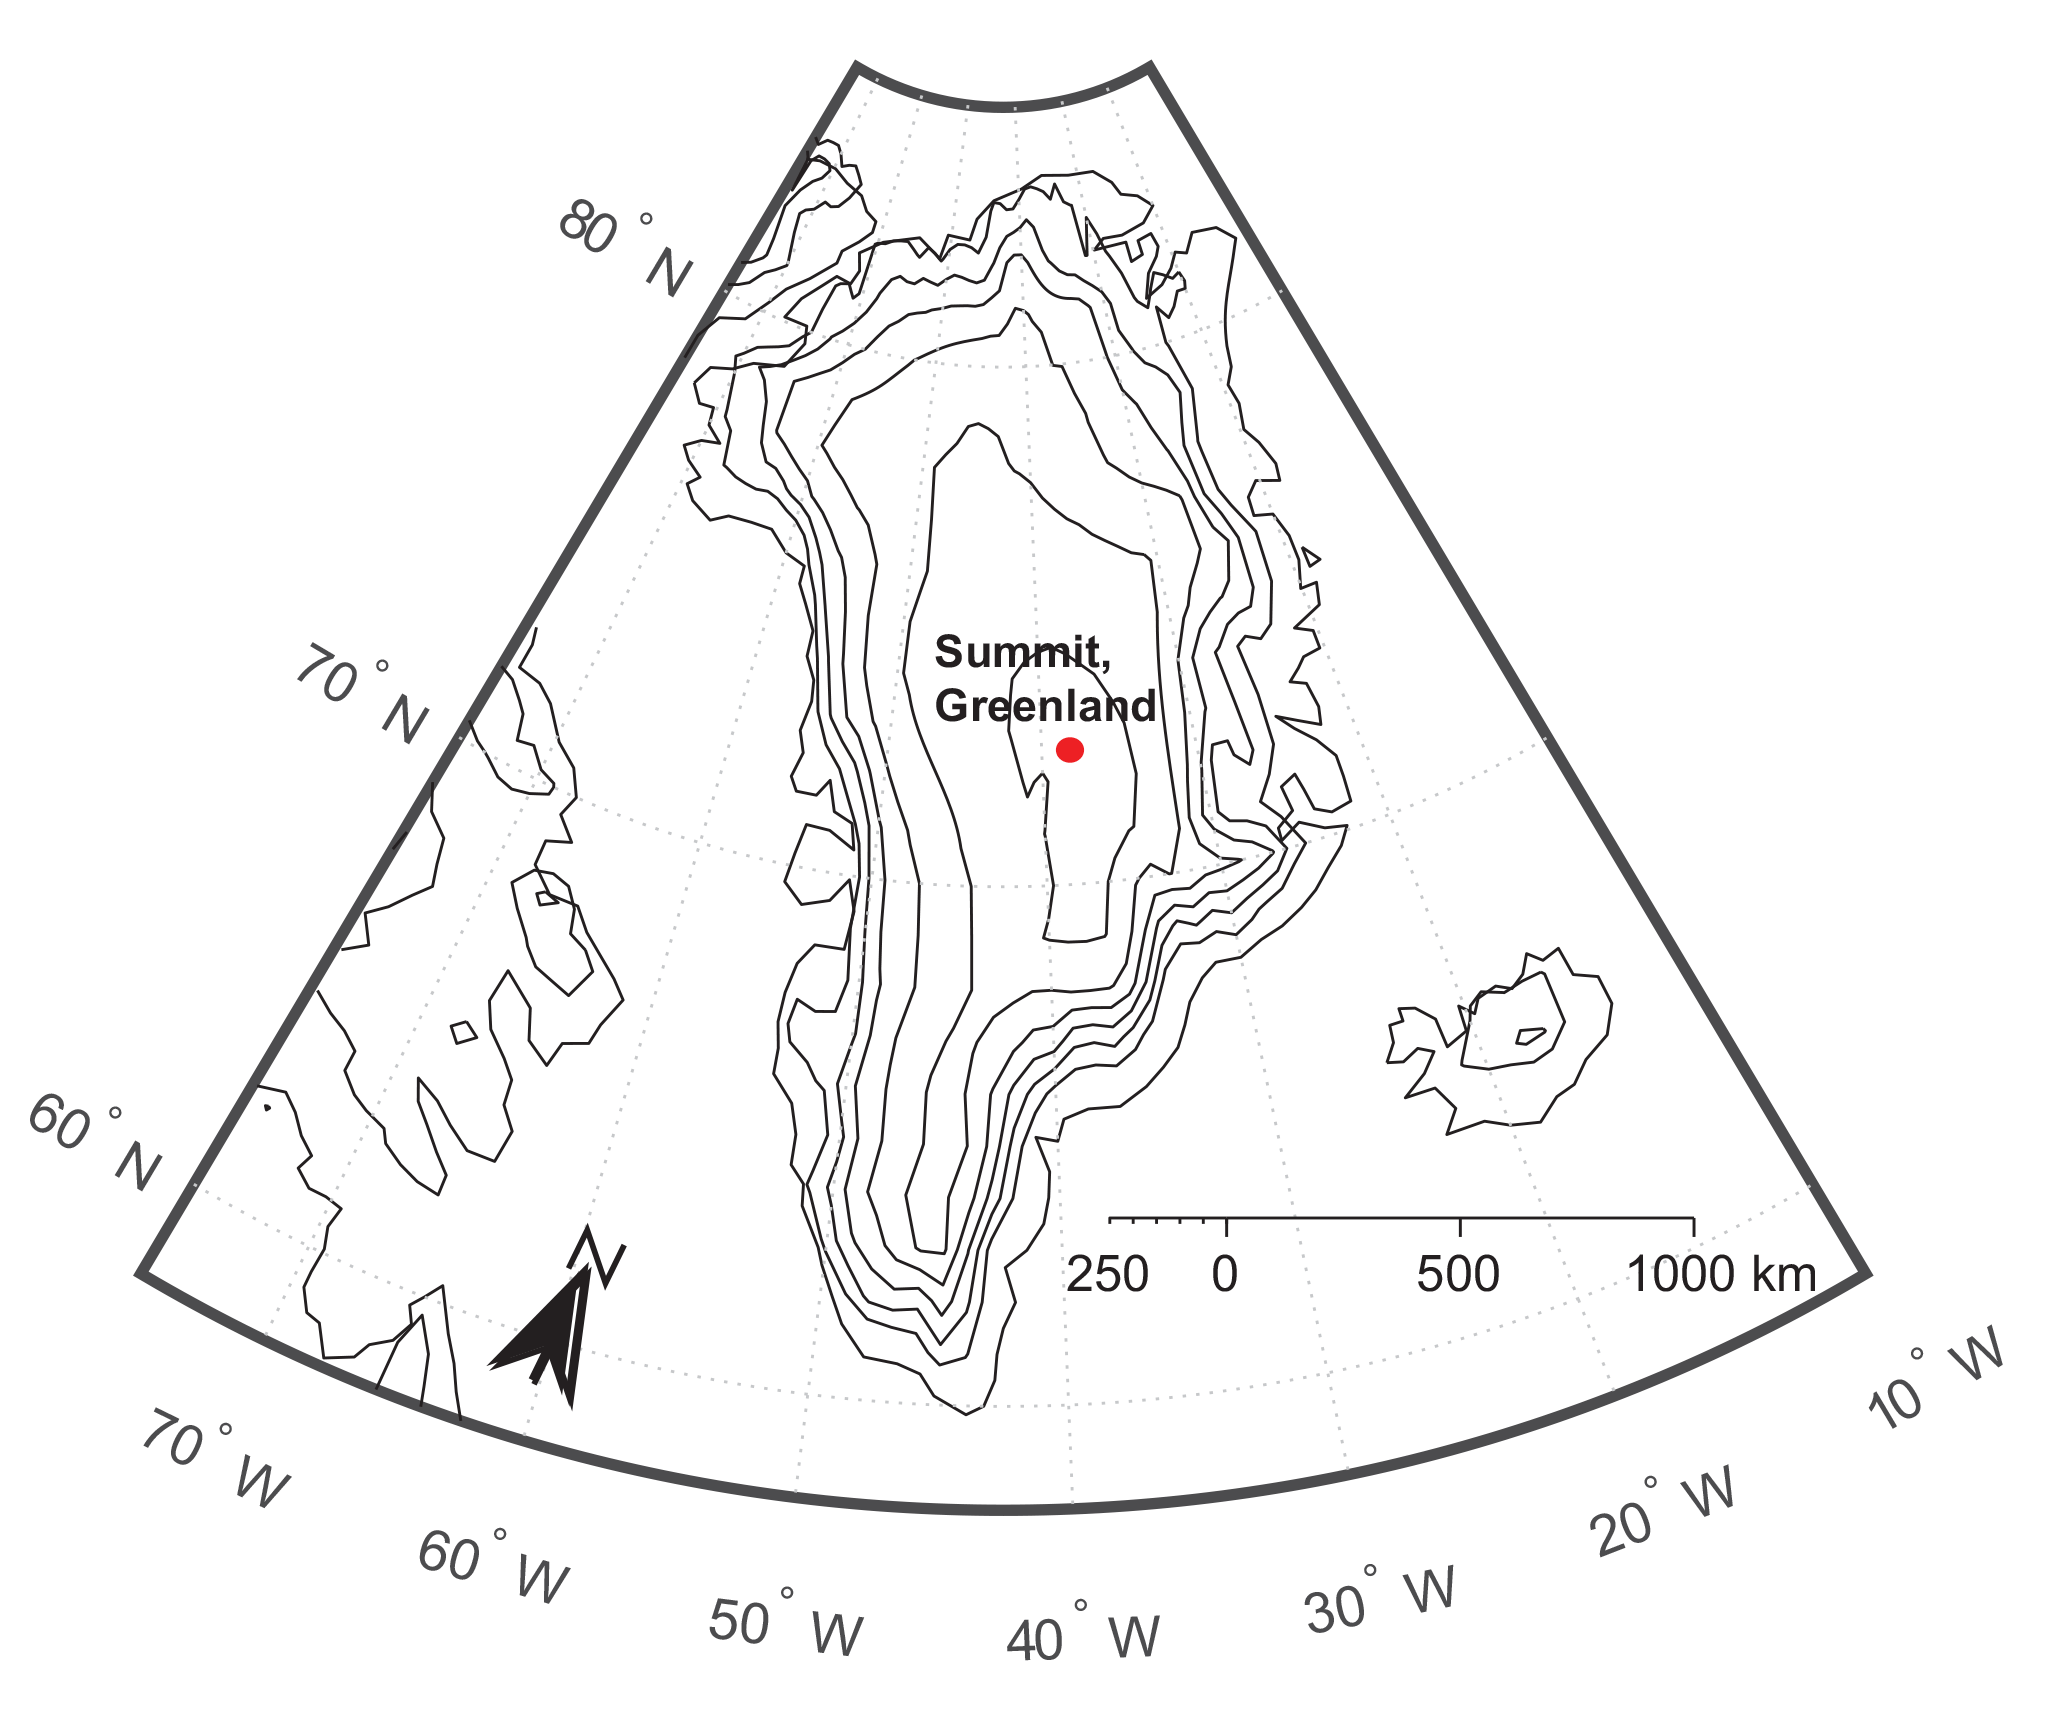
Figure 1Map indicating the location of Summit, Greenland, the study site for remote sensing and in situ temperature comparisons. Contour lines represent elevation change of 500 m. Latitude and longitude coordinates for the measurement site are 72.65923∘ N, 38.57067∘ W.
Summit Station was the location of the Greenland Ice Sheet Program 2 (GISP2) deep core site and has operated continuously as a year-round station for nearly a decade. The National Atmospheric and Oceanic Administration (NOAA) has operated a meteorological station at Summit, measuring the 2 m air temperature using a shielded Logan PT139 sensor. Additionally, wind speed and incoming solar radiation data were also measured as part of the NOAA station data (NOAA ESRL Global Monitoring Division, 2017). The data provided by NOAA and used in this paper have a 1 min temporal frequency, and we take a 30 min average of the data so that the 2 m air temperature is comparable to the IR skin temperature measurements. Further details of the 2 m air measurements are outlined in Shuman et al. (2014). Additionally, through the Integrated Characterization of Energy, Clouds, Atmospheric state, and Precipitation at Summit (ICECAPS) project, a number of instruments to monitor cloud, atmosphere, and precipitation were installed at Summit in 2010. One of these instruments is the millimeter wavelength cloud radar (MMCR), a custom-built Doppler 35 GHz radar that measures reflectivity, mean Doppler velocity, Doppler spectra, and Doppler spectrum width (data available at http://www.archive.arm.gov). More information about the MMCR can be found in Moran et al. (1998). We use MMCR data in this study to detect the presence of clouds and determine the accuracy of the MODIS cloud mask, again employing the higher temporal frequency measurements and calculating 30 min averages so that the data are comparable to our in situ skin temperature measurements.

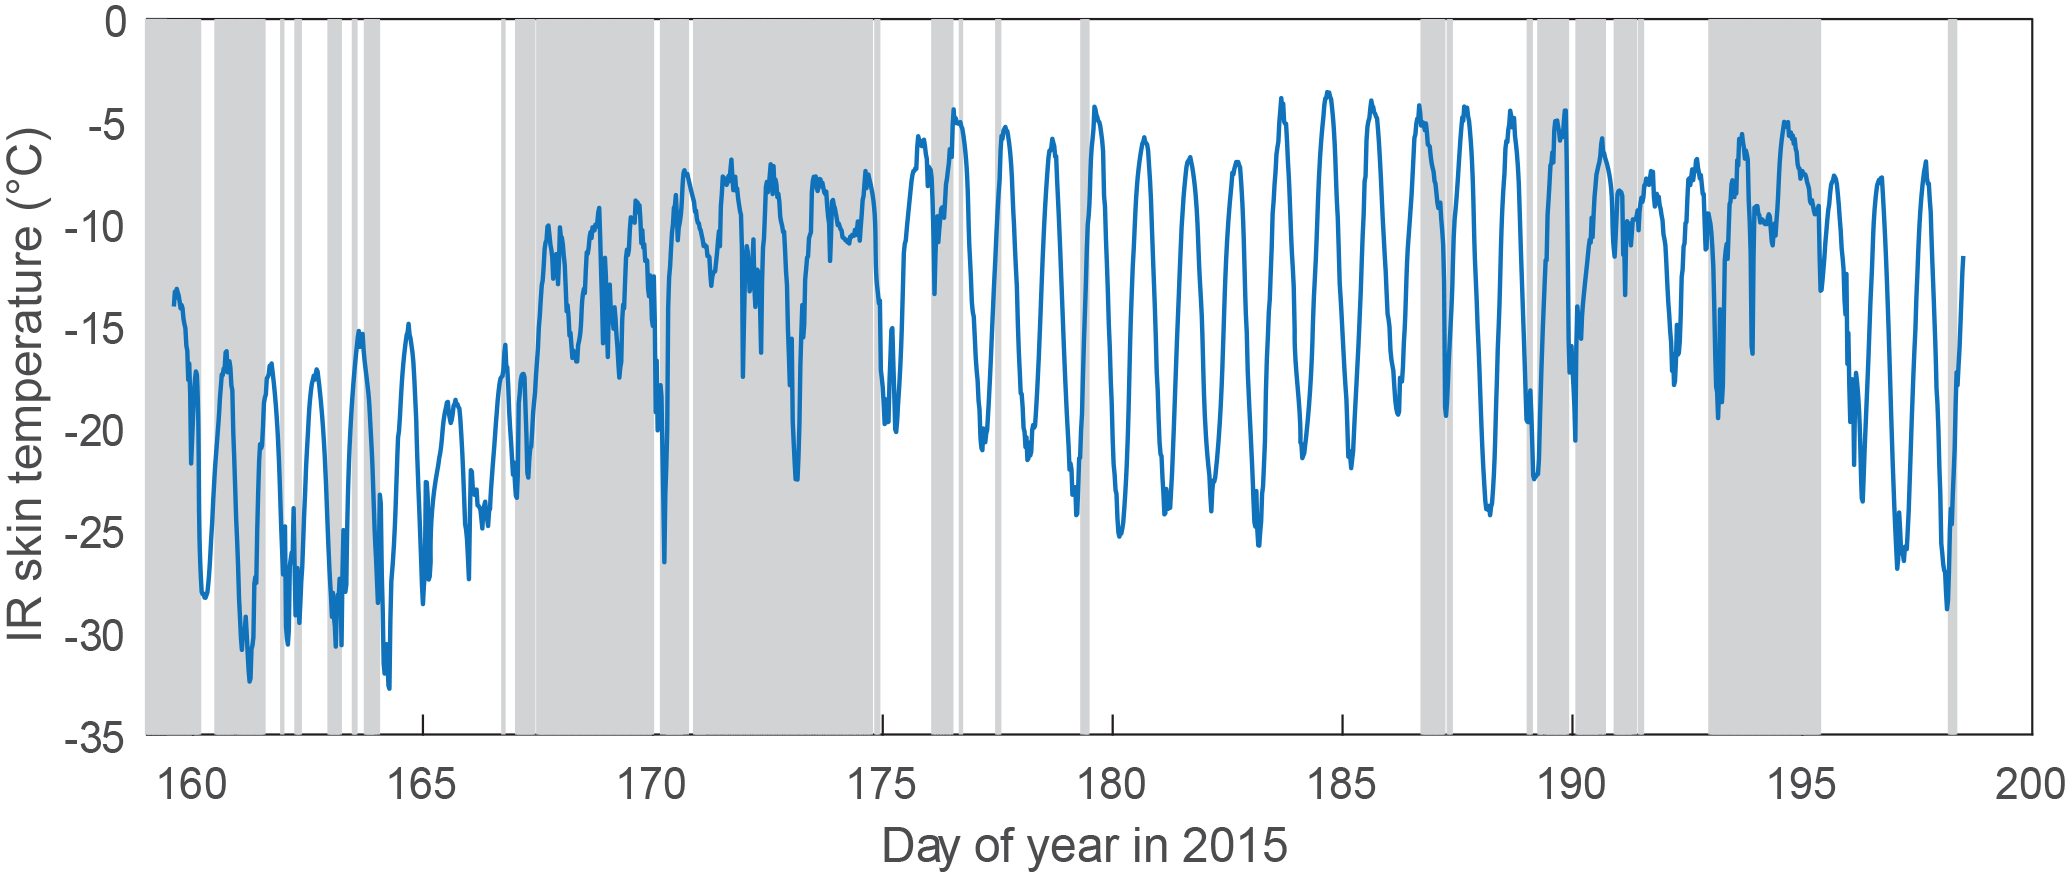
Figure 3Time series of skin temperature at Summit, Greenland, measured with SI-111 IR thermometer. Gray vertical bars indicate presence of clouds as detected by a millimeter cloud radar at Summit Station.
2.2 Remote sensing of surface temperature with MODIS
There are many different remote sensing instruments that measure radiance in the thermal IR part of the electromagnetic spectrum to determine skin temperature, including the Advanced Very High Resolution Radiometer (AVHRR), the Advanced Thermal Emission and Reflection Radiometer (ASTER), the Enhanced Thematic Mapper Plus (ETM+), and MODIS. The theoretical basis for determining temperature of a snow surface based on measured thermal IR radiance is described by Hook et al. (2007) and Hall et al. (2008) as follows:
where is the radiance measured by the sensor on a given satellite, ϵλ is the surface emissivity at a given wavelength, Lbb,λ(T) is the spectral radiance from a black body as a function of temperature, Lsky,λ is the spectral downwelling radiance from the atmosphere on the surface, τλ is the spectral transmittance through the atmosphere, and Latm,λ is the spectral radiance upwelling from atmospheric emission and scattering. If emissivity, sky radiance, transmittance, and path radiance are known, surface temperature can be determined through measurements of the radiance at the sensor. In the measurements of snow, the resulting temperature is representative of the top several microns of the surface at the snow–air interface because of the penetration depth of radiation at the wavelengths used, so it is indeed a skin temperature (Warren and Brandt, 2008).
The MODIS instrument produces widely used LST, which we use as the remote sensing product in this work. This instrument, aboard the Terra and Aqua satellites, has been collecting radiance data from 24 February 2000 to present. The surface temperature products of the Greenland Ice Sheet are used as a baseline to investigate surface temperature trends (e.g., Hall et al., 2012), to monitor melt events on the ice sheet (Hall et al., 2013), and as input for surface mass balance or snowpack modeling (Fréville et al., 2014; Shamir and Georgakakos, 2014; Navari et al., 2016). In this study, we use the MOD/MYD11 Collection 6 (C6) product, where MOD refers to the Terra MODIS product and MYD refers to the Aqua MODIS product. This product has a pixel size of 1 km × 1 km.
The MOD/MYD11 algorithm was developed to map land surface temperature (Wan and Dozier, 1996; Wan, 2008, 2014) using radiance in MODIS bands 31 and 32, which correspond to center wavelengths of 11 and 12 µm, respectively. The algorithm used to estimate temperature is referred to as a “split window” technique because the differences between the 11 and 12 µm bands are used to account for atmospheric effects on the measured radiance. MOD/MYD11 estimates an emissivity value based on land cover (assessed from bands 3–7, 13, and 16–19), presence of water vapor, and estimated air temperature atmospheric profiles using MODIS sounding channels (Wan and Dozier, 1996). Emissivity can vary widely because MOD/MYD11 is a global product that estimates land surface temperature on all types of land cover types. Because this study focuses on consistently snow-covered land, there was not significant variability in the emissivity; in band 32 the emissivity is 0.990 for each data point, and in band 31 the emissivity fluctuates between either 0.992 or 0.994 as determined from MOD/MYD11. For cloud masking, MOD/MYD11 uses MOD/MYD35, the standard MODIS cloud mask product which uses data from multiple MODIS bands for cloud detection. This product gives a probability that a pixel is clear. MOD/MYD11 masks out anything below 95 % probability of a clear pixel. The accuracy of the MOD/MYD11 product is limited by the uncertainties of radiative modeling, the uncertainty of absorption and scattering coefficients of aerosols and water vapor, and the atmospheric profiles of temperature and water vapor (Wan and Dozier, 1996). For surfaces with a known emissivity, the accuracy of the MOD/MYD11 is within 1 ∘C (Wan, 1999). For further information on the MOD/MYD11 algorithm and associated uncertainties, consult Wan and Dozier (1996) and Wan (1999, 2008, 2014).
Previous MODIS surface temperature validation studies have used Collection 5 (C5) products; C6 products started to become available in 2014. Improvements were made in the C6 MODIS algorithms, most notably to rectify degradation of some sensors on the Terra satellite. However, the sensor degradation was largely affecting bands in the visible part of the spectrum and not in the thermal IR part of the spectrum used to calculate surface temperature (Lyapustin et al., 2014; Polashenski et al., 2015; Casey et al., 2017). MOD/MYD11 C6 benefits from improved stability of emissivity values and improved algorithms to account for viewing angle over its C5 counterpart (Wan, 2014). Additionally, in C6, the calibration of bands 31 and 32 (used in surface temperature calculation) is improved. Supplement Fig. S1 shows comparisons of C5 and C6 data at our study site over the time period of interest. On average, C6 results in temperatures 0.2 ∘C higher than C5. The temperature differences are larger at higher temperatures. Finally, the cloud mask algorithms are improved in C6 (Riggs et al., 2017), resulting in a less strict cloud mask over Greenland.
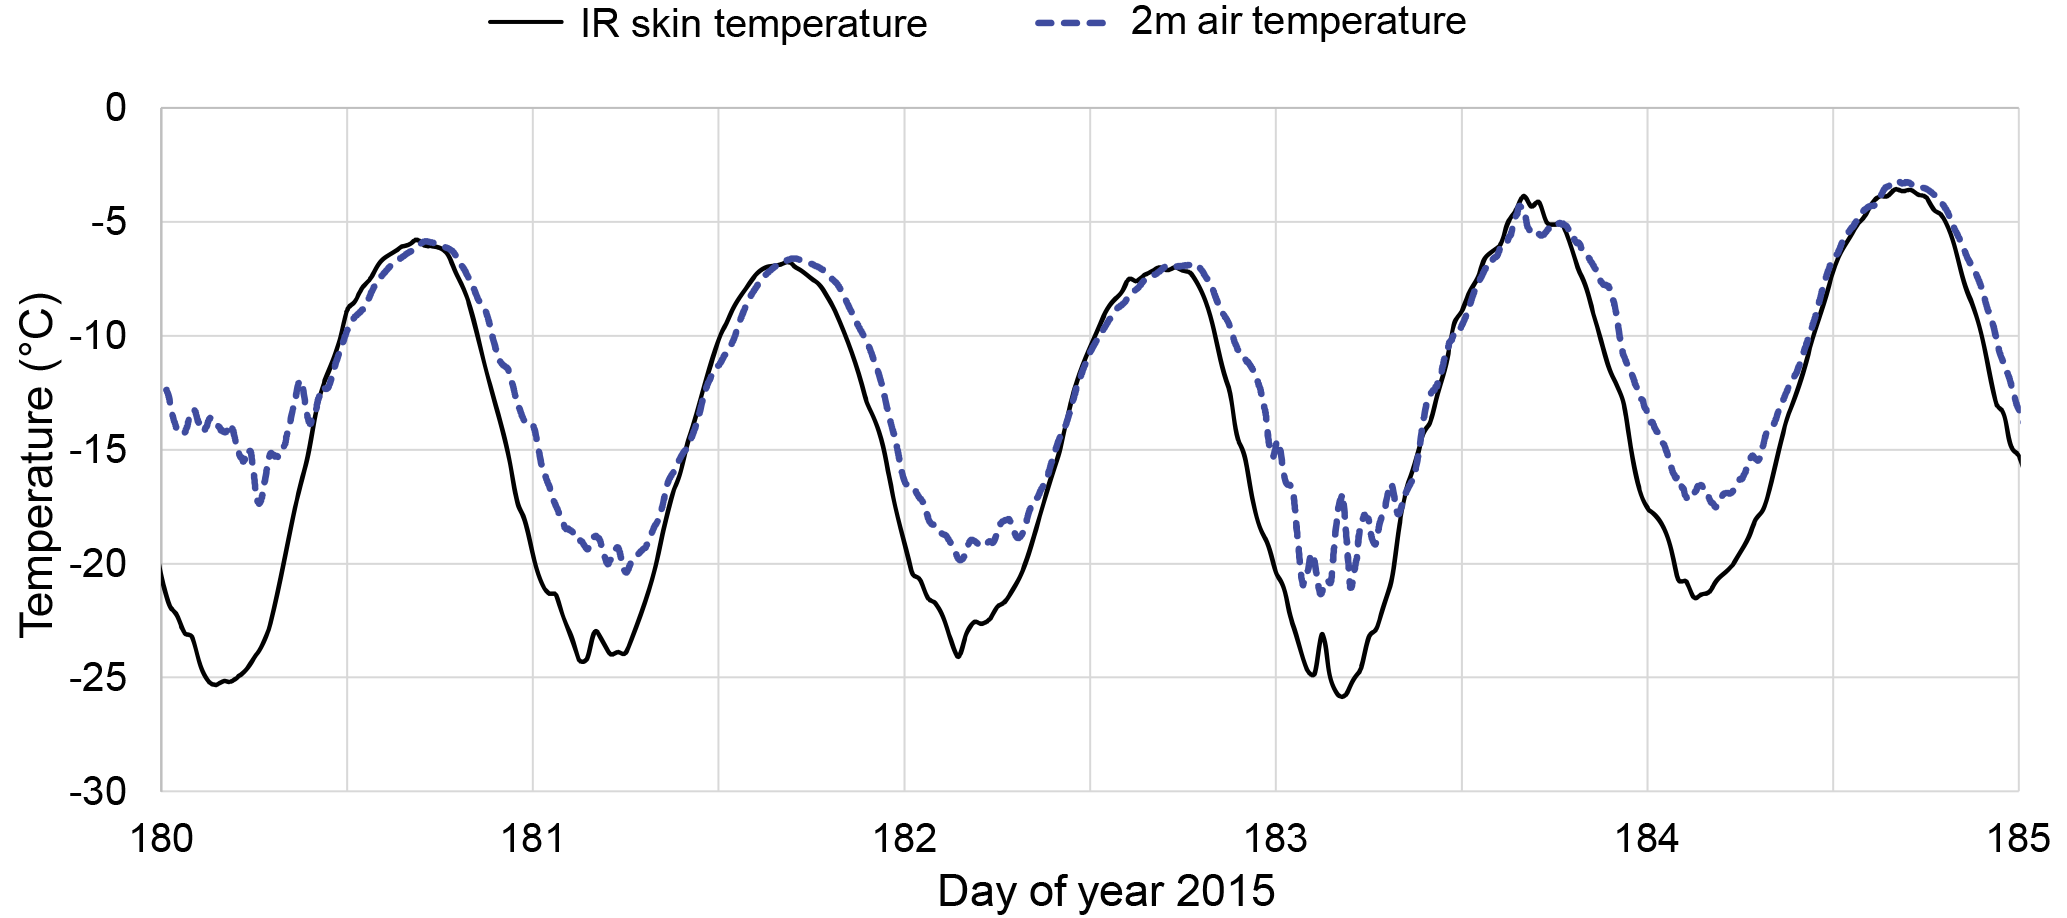
Figure 4Time series of IR skin temperature and 2 m air temperature during a clear sky period near Summit, Greenland.
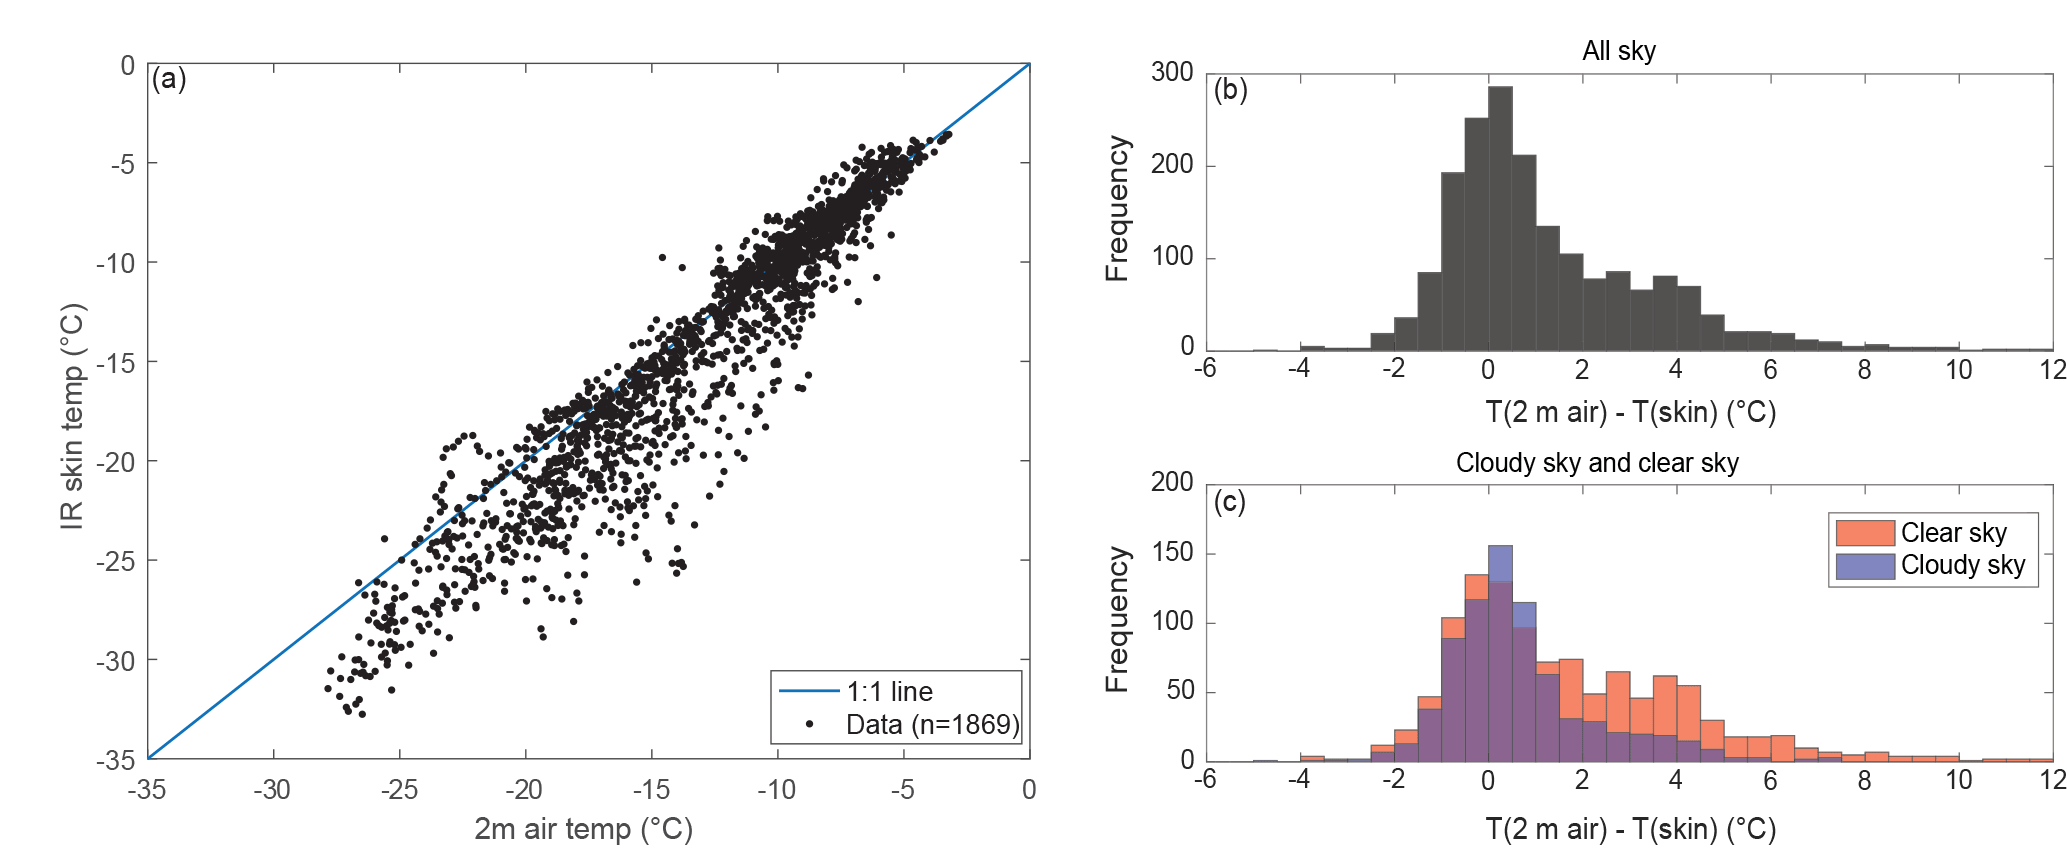
Figure 5(a) Comparison of 2 m air temperature to IR skin temperature near Summit, Greenland, during June and July 2015. The difference between air and skin temperature is largest at lower temperatures. (b) Histogram of the difference between 2 m air temperature and IR skin temperature during the study period in June and July of 2015 at Summit, Greenland, during all sky conditions and (c) clear sky and cloudy sky conditions (as detected by MMCR data) separated. The difference is skewed to positive temperature differences indicating higher air temperatures than skin temperatures.
The high-latitude location of Summit, Greenland, puts it within the field of view of the MODIS instruments on Terra and Aqua multiple times each day. To compare in situ measurements to the temporally coincident MODIS collections, we use swath-level products whose file names contain the UTC time of collection within ±5 min. Within each swath, we find the 1 km × 1 km square pixel in which our measurement site is located by minimizing distance between pixel central point and our in situ measurement site. Comparisons between temperatures from the MODIS products and the in situ measurements that are within 30 min of one another are used in the analysis. As skin and near-surface air temperatures can fluctuate within a span of 30 min, the non-synchronicity may introduce some error in the comparisons, but errors should be random and non-systematic, as 30 min windows of both increasing and decreasing temperature are included in the analysis.
3.1 Near-surface temperature measurements
The IR skin temperature measurements operated continuously during the 40-day campaign. The station was visited several times between 8 June and 25 June, though no maintenance was required, and then left unmaintained for the remainder of the measurement period. A time series of the IR skin temperature is presented in Fig. 3. The snow skin temperature varied between approximately −34 and −2 ∘C during the measurement period. Gray vertical bars in the figure indicate the presence of clouds as detected by the MMCR radar, and, while the diurnal cycles are clear throughout the time series, there is more high-frequency fluctuation in temperature during cloudy periods.
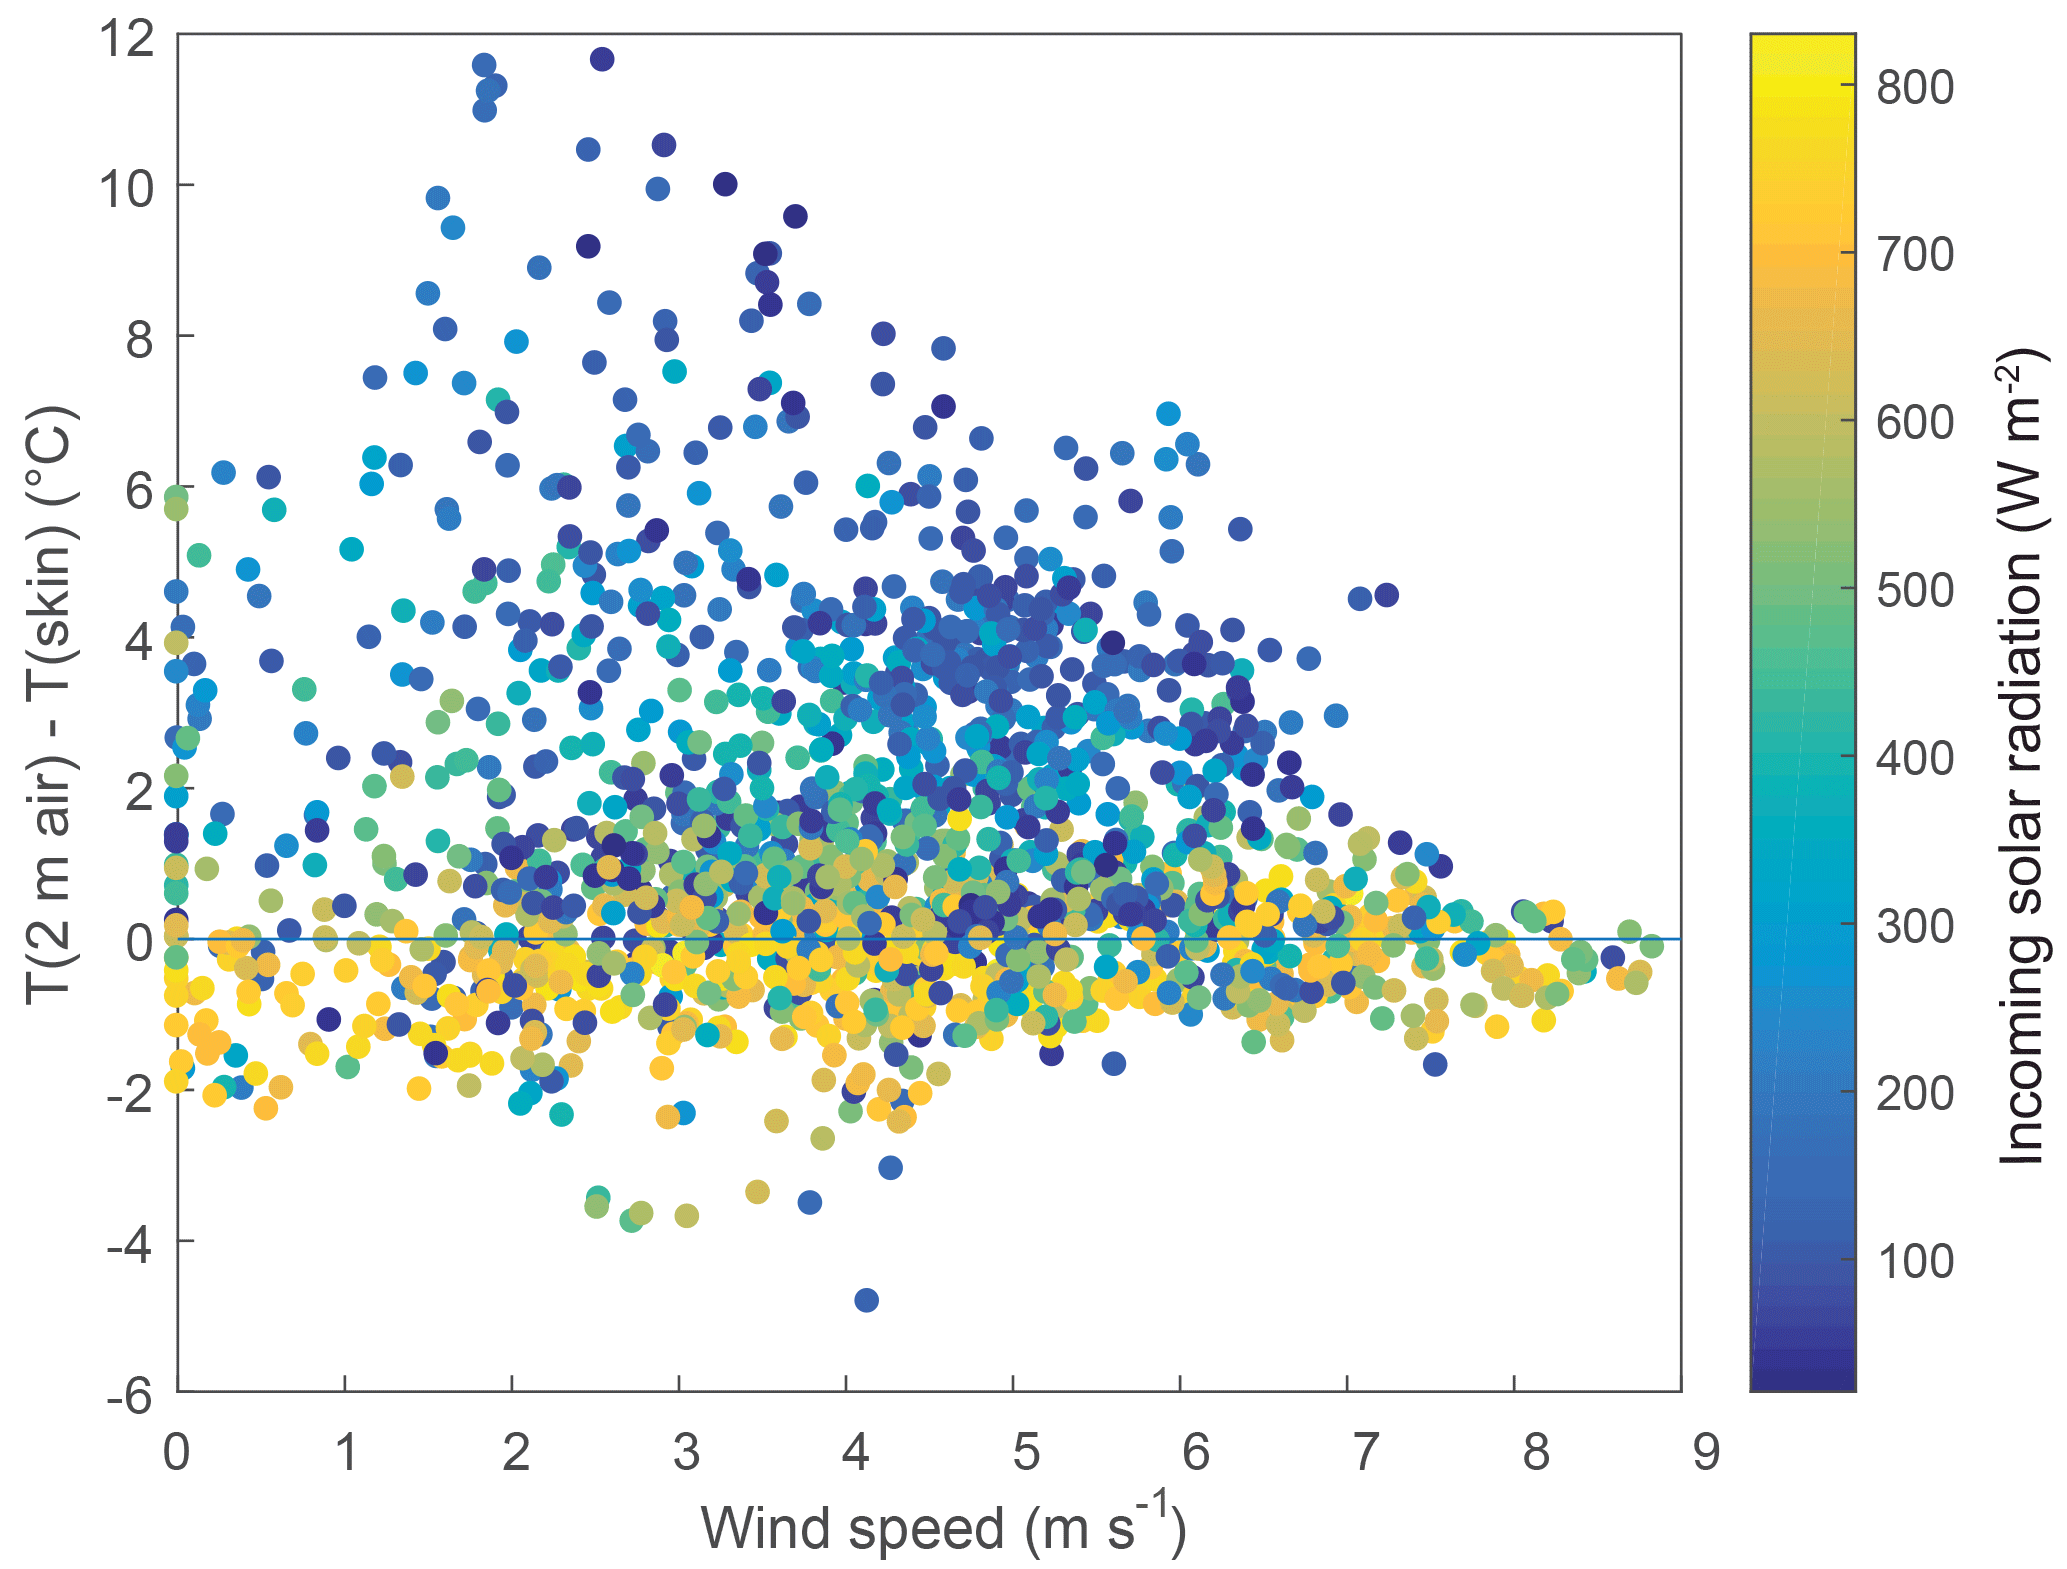
Figure 6Difference between 2 m air temperature and IR skin temperature showing the presence of strong surface-based inversions at low wind speeds and low values of incoming solar radiation (indicated by the marker color).
Our IR skin temperature measurements are compared in a subset time series to the 2 m air temperature measurements at Summit Station in Fig. 4. This time window shows a clear sky period when diurnal cycles are clear and conditions for inversion are most favorable. Thermal stratification in the lowest several meters of the atmosphere is prominently seen in the difference between 2 m air temperature and IR skin temperature (Fig. 4). The 2 m air temperature and IR skin temperature are similar during peak solar irradiance, with the mean difference in temperature equal to −0.32 ∘C when incoming solar radiation is greater than 600 W m−2. There is a larger difference between the two during the nighttime, with 2 m air temperature higher than skin temperature by an average of 2.4 ∘C when incoming radiation is less than 200 W m−2. This near-surface inversion is due to low incoming solar radiation and emission of longwave radiation from the snow surface during the night. This stable condition prevents turbulent heat exchange and allows the inversion to persist. Figure 5a shows a direct comparison between the 2 m air temperature measured at the NOAA weather station at Summit and the in situ IR skin temperature measured 10 km NNW of Summit. As the inversions appear diurnal in nature, the measurements are quite similar at higher temperatures (above −10 ∘C, mean difference is −0.16 ∘C), but at lower temperatures there is increased discrepancy between 2 m temperature and snow skin temperature (below −20 ∘C, mean difference is 3.5 ∘C). Figure 5b shows a histogram of the differences between the same 2 m air temperature and IR skin temperature. There is a clear skew in the histogram, indicating that 2 m air temperature is most frequently higher than skin temperature (in 68 % of measurements). This is true in both clear and cloudy sky conditions, where the percentage of measurements for which air temperature exceeds skin temperature is 70 % in clear sky conditions and 65 % in cloudy sky conditions.
Figure 6 shows the magnitude of the temperature difference between 2 m and snow skin temperature as a function of concurrent wind speed, with the color of the marker indicating the concurrent incoming solar radiation. It is clear that increasing wind speed serves to reduce any temperature gradient in the lower meters of the atmosphere and that at peak solar radiation there are no inversions present. These differences are much higher at lower wind speeds; a stronger wind shear allows the system to overcome the stability in temperature and promotes heat flux from the air to the snow surface. Weaker winds cannot overcome the temperature stability so the temperature differences persist. Specifically, for the data presented here, at incoming solar radiation above 600 W m−2 or wind speeds greater than approximately 7 m s−1, there were no inversions greater than 2 ∘C in the 2 m above the snow surface.
The presence of this near-surface thermal inversion is of particular interest in the context of previous MODIS surface temperature comparison studies. Several studies have used 2 m air temperature to compare to MODIS surface temperature products (Hall et al., 2004, 2008; Shuman et al., 2014). These studies consistently report a “cold bias” in the MODIS surface temperatures (see Table 1), where MODIS surface temperature is lower than concurrently measured 2 m air temperature. In Shuman et al. (2014), a comparison of MOD29 to 2 m air temperature results in a cold bias of approximately 3 ∘C, and the authors note that the disagreement was larger for lower temperatures. Previous studies acknowledge that near-surface stratification may be part of the cause of the discrepancy, but they also highlight other potential causes such as issues of calibration of the MODIS instruments at very low (less than approximately −20 ∘C) temperatures (Wenny et al., 2012; Xiong et al., 2015), errors in cloud masking, and potential atmospheric interference. The data presented in Fig. 5 show that near-surface thermal stratification may play quite a large role in the discrepancies found between MOD29 and 2 m air temperatures (see Fig. 1 of Shuman et al., 2014). Inversions, which are present during periods of lower incoming solar radiation, and thus frequently lower temperature, result in offsets between skin and 2 m air temperature. Because the MODIS products provide skin temperature (Warren and Brandt, 2008), the difference seen in Shuman et al. (2014) between 2 m air temperature and MODIS temperature at these lower temperatures could in fact be a signature of inversions, which the authors indeed acknowledge but did not have the data to explore. Comparisons of 2 m air temperature to MODIS surface temperature allow us to see how potentially pervasive these inversions could be, though further measurements are needed to determine their presence in non-summer seasons.
Hall et al. (2008) present a figure (their Fig. 2) similar to our Fig. 5a, in which measured IR skin temperature is plotted vs. 2 m air temperature measured at Summit Station in Greenland from 2000 to 2001. However, they found a consistent offset between 2 m air temperature and skin temperature (of approximately 1 ∘C), a trend that does not vary with temperature. In contrast, our measurements show that the offset is larger at lower temperatures than at higher temperatures and has a much larger magnitude than 1 ∘C; inversions up to 12 ∘C were measured in our data (Fig. 5c). The mean differences are reported above as −0.16 ± 0.88 ∘C when temperatures are above −10 ∘C and as 3.5 ± 2.4 ∘C when temperatures are below −20 ∘C. A paired t test shows that these means are not equal to one another with a p value of less than 0.001. In the summer, inversions are present only when solar radiation is low, and therefore temperatures are typically low, so discrepancies between 2 m air temperature and skin temperature only occur during periods of high solar zenith angle. During daytime in summer, when there is more incoming radiation and temperatures are typically higher, there is good agreement between measured 2 m air temperature and skin temperature. Because the Hall et al. (2008) data span a longer timescale over all seasons, it is possible that the seasonality effects of studying only summer are the root of the differences in our results. However, because inversions are known to be more persistent in the winter than in the summer, we might expect that the trend of larger offsets at lower temperatures would be even more pronounced when all seasons are included. Future studies, beyond our analysis here, that incorporate all seasons are needed to investigate this discrepancy and determine conditions under which 2 m air temperature is, or is not, a good proxy for snow skin temperature.

Figure 7Time series as shown in Fig. 3 with only a temporal subset of data presented to clearly show the diurnal cycle of temperature during fairly clear conditions. Note that the MOD/MYD11 product shows good agreement with IR skin temperature throughout the diurnal cycle.
3.2 In situ temperature comparisons to MODIS surface temperature products
3.2.1 IR skin temperature comparison
Figure 7 shows a time series of a subset of the measurement period with the 30 min IR skin temperature measurements overlain with the MOD/MYD11 LSTs. MOD/MYD11 does not provide a surface temperature when the cloud mask indicates that there are clouds present, which is why there are some gaps in the data (i.e., at day 186/187). Most of the time series shown in Fig. 7 is during a consistently cloudless period. Terra (MOD) passes over Summit several times in the latter half of the day as temperatures are dropping. Aqua (MYD) passes over Summit as temperatures are typically increasing within the diurnal cycle. The algorithm to calculate temperature from measured radiance is the same in the two different satellites. Figure 7 shows that there is generally good agreement between IR skin temperature and both MOD11 and MYD11 products. This is also evident in Fig. 8a, where MOD/MYD11 products combine to yield and RMSE of 1.6 ∘C (n=374) when compared with IR skin temperature, and there is a mean bias of ∘C. Separate results for Terra and Aqua are not significantly different (see Table 1). Across the range of temperatures in the study (approximately −30 to −5 ∘C), the agreement is consistent. Due to the conditions that occurred over our study period, we did not capture temperatures near the melting point, as surface melt is very rare at Summit, or at the lower temperatures common to winter conditions at Summit. In contrast to the results from Shuman et al. (2014), there does not seem to be an increase in the difference between MODIS surface temperature and in situ temperature as temperatures decrease.
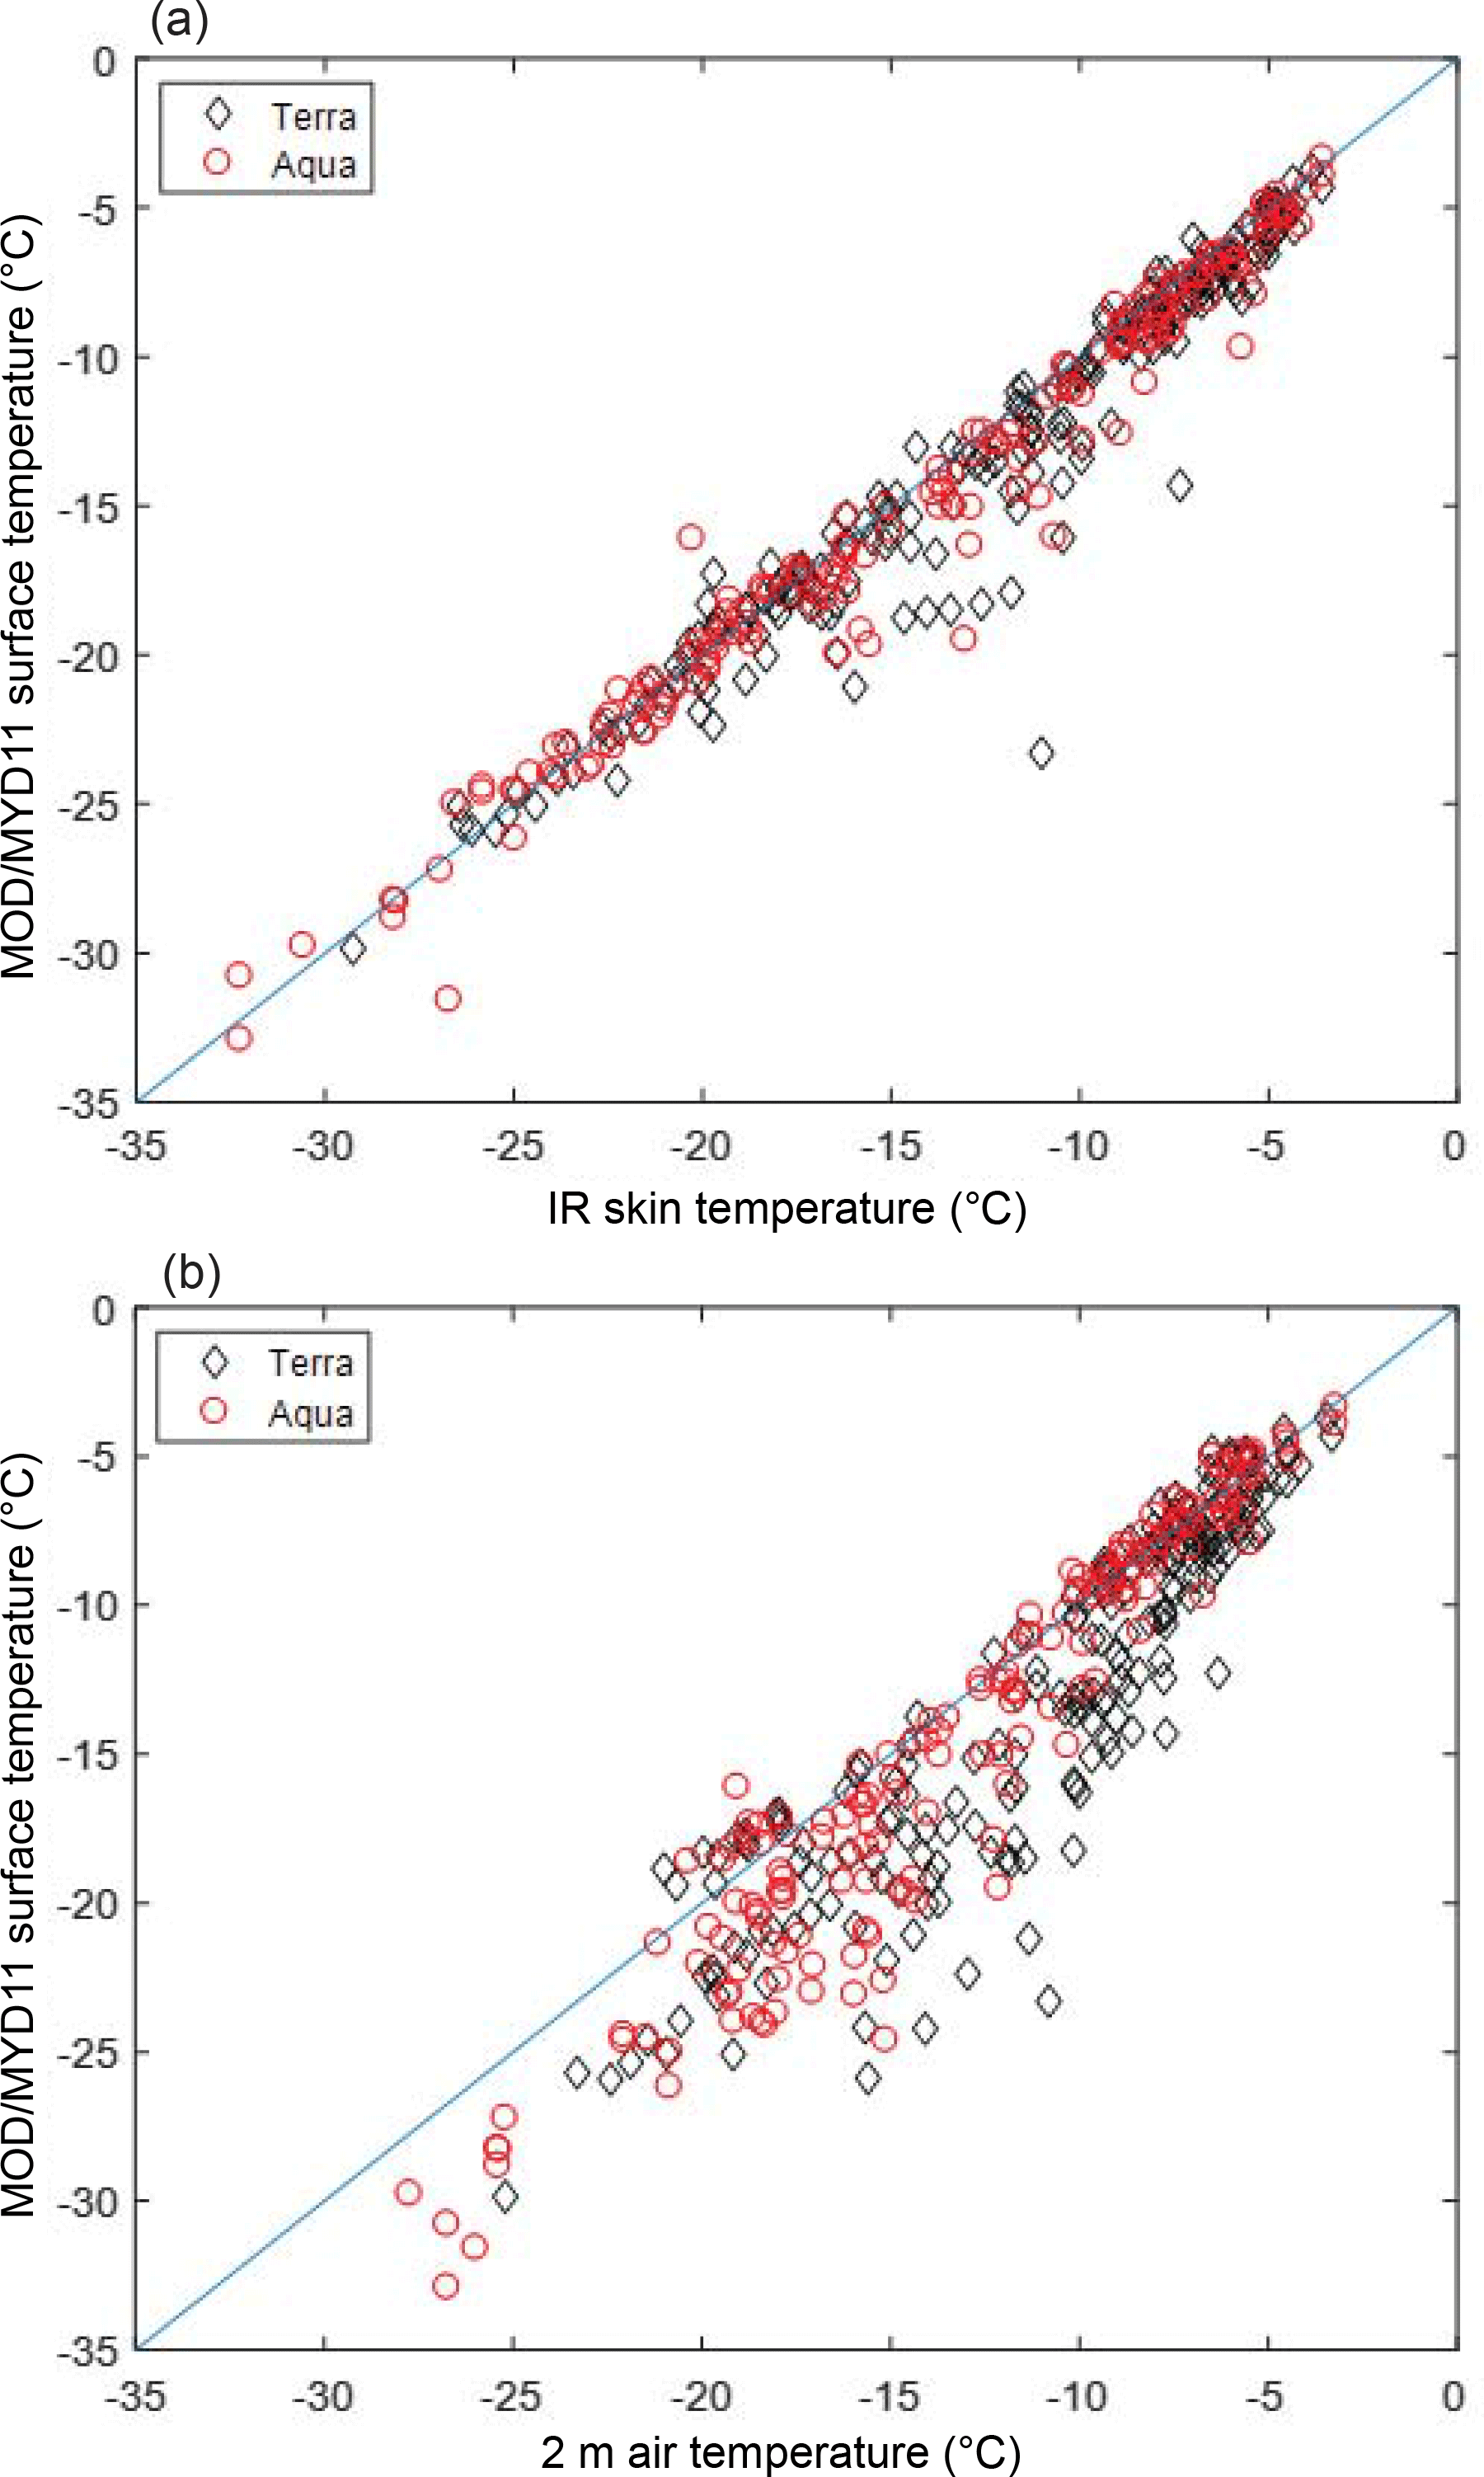
Figure 8(a) Direct comparison of in situ IR skin temperature data with MOD/MYD11 C6 surface temperatures. Agreement between satellite and ground-based measurements is quite good (RMSE = 1.6 ∘C, n=374), and there is not a noticeable difference between the performance of the MOD11 and MYD11 temperature products, on the Terra and Aqua satellites, respectively. (b) Direct comparison of 2 m air temperature with MOD/MYD C6 surface temperatures. This is illustrative of bias that may be inferred when 2 m air temperature is used in validation studies in which inversions are present. RMSE = 3.1 ∘C.
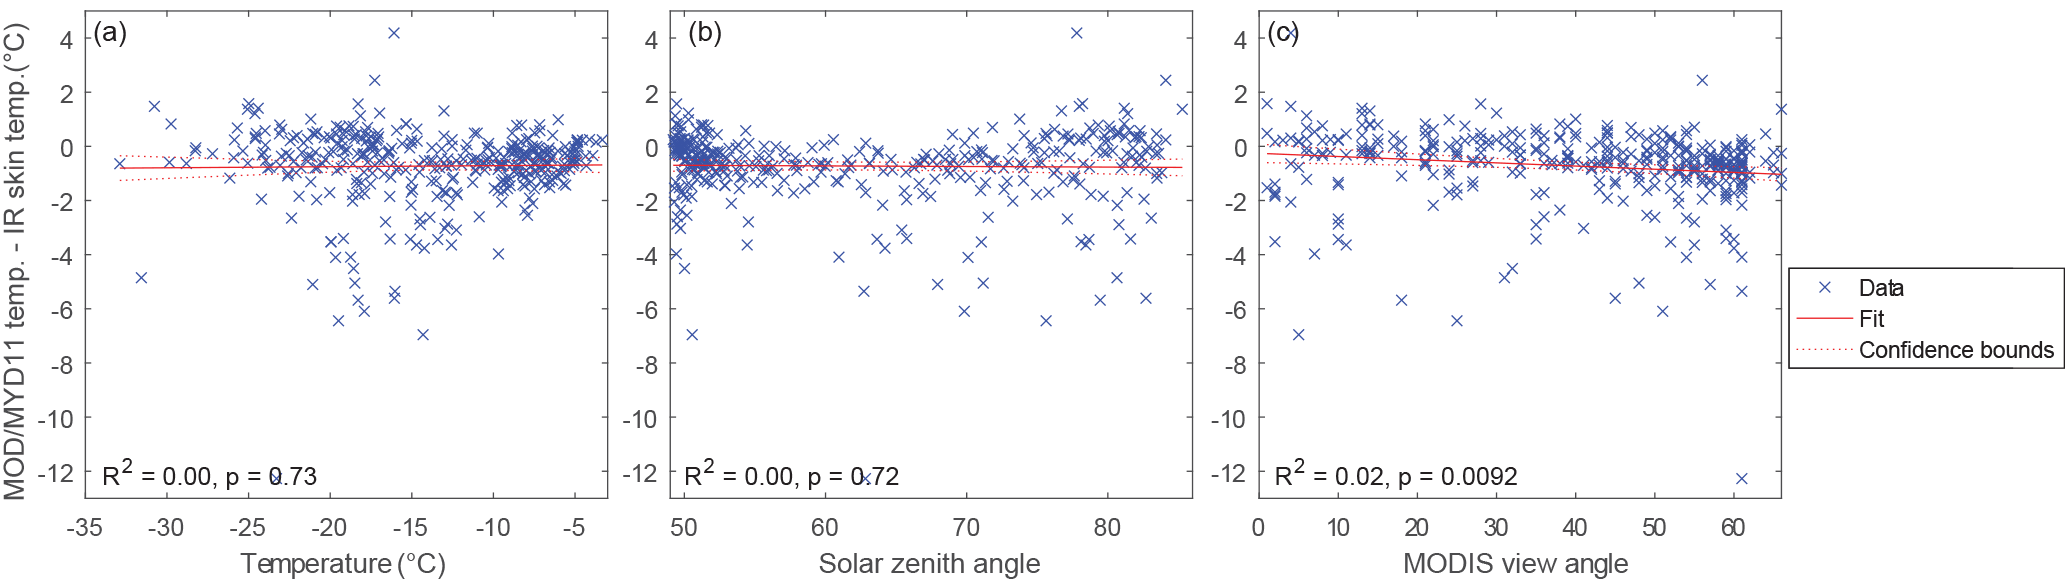
Figure 9Difference in temperature measured from MOD/MYD11 and in situ IR skin temperature measurements as a function of (a) IR skin temperature, (b) solar zenith angle, and (c) MODIS viewing angle. The only significant relationship is that the temperature difference is sensitive to the MODIS viewing angle. While the relationship is statistically significant, it is not a strong control on the temperature difference.
While we do not believe that 2 m air temperature is a good proxy for skin temperature, for demonstration purposes we have compared the 2 m air temperature measurements to the MOD/MYD11 product in Fig. 8b. In doing so, we find an RMSE of 3.1 ∘C and a mean bias of 1.9 ± 2.5 ∘C (n=374). This comparison results in a similar RMSE to Shuman et al. (2014) of 3.5 ∘C, though the mean bias of our comparison is slightly less than their bias was at 3 ∘C. This comparison further illustrates the importance of using skin temperatures in MODIS validation studies. Shuman et al. (2014) were unable to conclusively say that any of their bias was a result of using 2 m air temperature instead of skin temperature, and in fact they did not think it was likely that any inversion effects would cause the gradually increasing bias with decreasing temperature because there was insufficient research on the presence of near-surface inversions in the dry snow zone in Greenland. The comparison of Fig. 8a and b shows that, at least in the summer, inversions were likely to have played a large role in their 2014 results.
As compared to other MODIS validation studies, these results indicate a closer match between in situ measurements and MODIS temperature products, as indicated by smaller RMSE and mean bias (see Table 1). While the length of our study is short in comparison to many of the other works referenced, the use of a different in situ sensor is likely a key factor, and there is still a significant range of temperatures captured within our study. In comparing our results to other studies, it is also important to consider that we are using a C6 product, which has seen improvements from previous versions. The C5 cloud mask was more conservative over the Greenland Ice Sheet than the C6 cloud mask. If we consider only swaths that are considered cloud-free by both C5 and C6 (n=341) and compare the MODIS surface temperature to our IR skin temperature, we find that the C6 performs slightly better than C5 with a lower RMSE (C6: 1.44 ∘C; C5: 1.57 ∘C) and lower mean bias (C6: −0.70 ∘C; C5: −0.93 ∘C). The comparisons are shown graphically in Fig. S2 of the Supplement.
However, there are still some differences between IR skin temperature and MODIS surface temperature in our validation study. To investigate the root of these discrepancies, we consider the sensitivity of the difference between MOD/MYD11 surface temperature and in situ skin temperature as a function of the following parameters: IR skin temperature, solar zenith angle, and sensor viewing angle. These results are presented in Fig. 9. The only significant relationship is between temperature difference and MODIS sensor view angle (p=0.0029). The viewing angle varies between 0 and 66∘, and the slope of the trend (−0.01 ∘C ∘−1û) indicates that at larger viewing angles there is a larger difference between the MODIS surface temperature and our measured IR skin temperature, but it does not explain much of the variance, as the R2 value is only 0.02. There is not a significant trend with temperature or with solar zenith angle. As these variables do not explain much of the difference, other potential sources of the discrepancy may be insufficient cloud masking (discussed in the following section), assumptions within the MODIS algorithm to determine atmospheric composition and properties, or imperfect synchronicity of measurements, where in situ skin measurements represent an average of 30 min but the MODIS measurement represents a shorter time window. Previous studies have shown that cloud masking limits the accuracy of surface temperature products in snow-covered areas (Westermann et al., 2012; Hall et al., 2004). In particular, the presence of clouds can lead to a negative bias because clouds can be misinterpreted as snow surface, and they often have lower temperatures than snow surface temperatures. Yu et al. (1995) suggest that ice crystal precipitation present during inversions may also cause differences between in situ and satellite skin temperatures, though they caused a warm bias rather than a cold bias.
3.2.2 Using in situ cloud data to improve MODIS surface temperature
Using the MMCR data from Summit, we identify periods when there were clouds present above Summit Station. While our IR skin temperature measurements were 10 km away, we believe that this is still a relatively good proxy for cloudiness, as we resample the data to cover a 30 min window, so we feel it is more reflective of a larger area. Figure 10 shows a comparison of IR skin temperature to the MOD/MYD11 reduced data, when cloud-affected pixels are removed. There is an improvement in the RMSE of the data comparison when the cloud-affected data are removed (from 1.6 to 1.0 ∘C) and the mean bias is also reduced from −0.7 to −0.4 ∘C. In determining the strictness of the cloud mask used, there is a trade-off due to the need to mask out all cloud-contaminated pixels but not overflag data, which results in the generation of false positives and removes pixels that were in fact clear. In comparing the MMCR data to the MOD/MYD11, we find that of the 1059 times that the site was within the field of view of the satellites in June and July of 2015, there were 585 instances when both MMCR and MODIS detected cloud cover and 288 instances when both MMCR and MODIS indicated clear sky. This indicates 82 % agreement. There were 86 false negatives (where MMCR indicates clouds and MODIS does not) and 100 false positives (where MMCR indicates clear sky and MODIS indicates clouds). Østby et al. (2014) also use in situ cloud data to filter out MODIS surface temperatures that are impacted by the presence of clouds in their study in Svalbard. They found an overall false negative rate of 17 %, whereas our false negative rate was 8 %. Their work shows that the MOD35 cloud mask performs more poorly in the winter than in the summer, so the difference in false negatives is likely due to more favorable conditions for effective cloud masking due to constant sunlight during our measurement period. Our results indicate that improvements to the MOD35 cloud mask would be beneficial. A stricter threshold would ensure that fewer cloud-covered pixels are included in the surface temperature dataset but would also likely lead to more false positives. Making this threshold decision may depend on the level of error that is acceptable given the analysis at hand. The ideal improvement would not be merely to change the threshold value, but to continue to improve cloud detection algorithms, which is continually done with each MODIS collection iteration (e.g., Riggs et al., 2017).
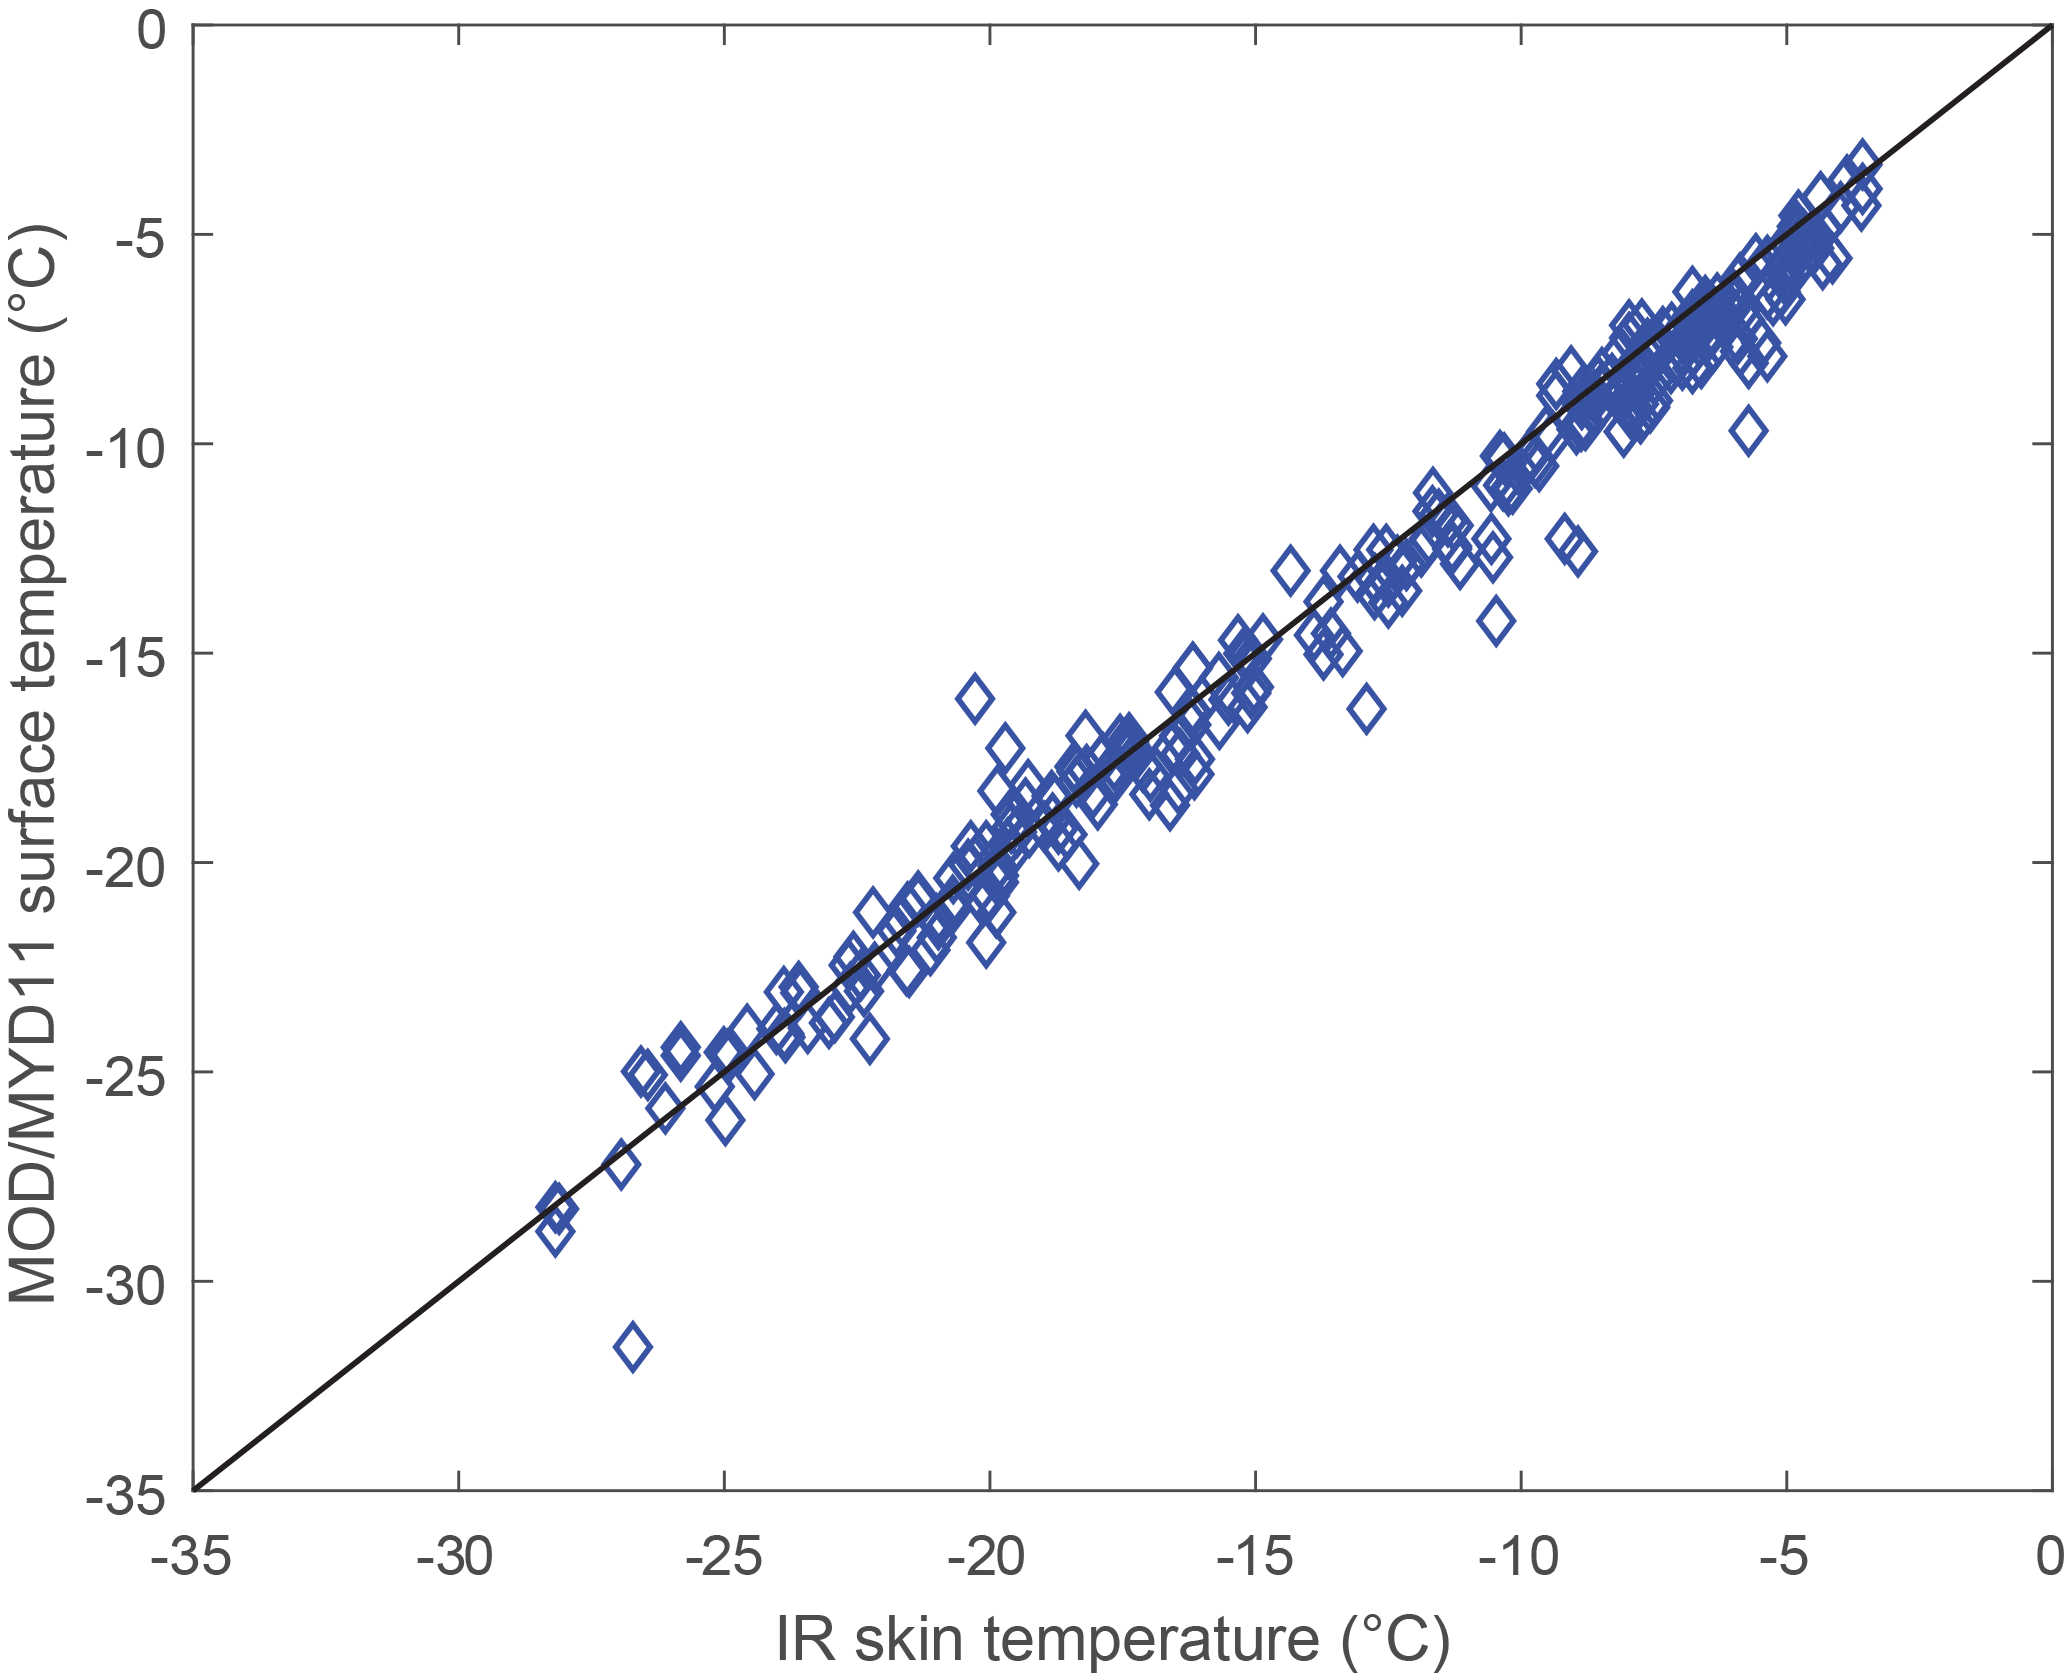
Figure 10Comparison of MOD/MYD11 to in situ IR skin temperature after cloud-affected data are removed. The RMSE is 1.0 ∘C and the mean bias is −0.4 ∘C.
Data collected during a 40-day field campaign at Summit, Greenland, in June and July of 2015 are used to improve understanding of near-surface temperature on an ice sheet, particularly with respect to MODIS LST retrieval products. We find that at Summit, 2 m air temperature is often significantly higher than skin temperature during the summer months, particularly at periods of low incoming solar radiation and low wind speed. This result is important because previous studies that have used 2 m air temperature to validate MODIS surface temperature products have concluded that there was a cold bias in the MODIS data, but our results indicate that the MODIS data have only a very slight cold bias (−0.7 ∘C), and the 2 m air temperature is not necessarily representative of skin temperature. Indeed, it is because of the differences between 2 m air temperature and MODIS temperature that we began to see the pervasiveness of the inversion. We do find that there is a slight cold bias in the MOD/MYD11 surface temperature products as compared to in situ IR skin temperature, but it is not as large as previous studies have reported, and the RMSE is 1.6 ∘C. The lower RMSE and mean bias are likely a result of measuring the skin temperature using an IR instrument directly (instead of using 2 m air temperature, which resulted in an RMSE of 3.1 ∘C and a mean bias of 1.9 ∘C). During our study period, we measured temperatures down to approximately −30 ∘C. In the future, we plan to extend studies of this type to longer spans of time to determine whether these results also are representative of lower temperatures and to capture higher temperatures as well, providing further validation of the MODIS surface temperatures near the melting point. Furthermore, the validation presented in this study of the strong correlation between MODIS surface temperature and snow skin temperature in the summer lays a groundwork for inversions to be studied more extensively in locations where 2 m air temperature is currently measured. Finally, by using in situ cloud radar data, we confirm, as has been noted in previous studies, that the MODIS cloud mask did not remove all cloud-obscured data from the dataset. When we remove data that were cloud-obscured using the MMCR, the RMSE of MOD/MYD11 improves to 1.0 ∘C. This indicates that stricter cloud-masking in the MODIS surface temperature products could improve the accuracy of the data collected.
IR skin temperature data are made publicly available through the NSF Arctic Data Center (Adolph et al., 2018). Data including 2 m air temperature, wind speed, and irradiance were acquired from NOAA's Earth System Research Laboratory Global Monitoring Division (ftp://aftp.cmdl.noaa.gov/data/meteorology/in-situ/sum/2015/, NOAA, 2017). Cloud radar data from the ICECAPS program were acquired from ARM (ARM Climate Research Facility, 2010, https://doi.org/10.5439/1025228). MODIS surface temperature data were acquired from NASA LP DAAC (2014, https://doi.org/10.5067/MODIS/MYD11_L2.006).
The supplement related to this article is available online at: https://doi.org/10.5194/tc-12-907-2018-supplement.
The authors declare that they have no conflict of interest.
We thank the National Science Foundation and Vasilii Petrenko for the
opportunity to conduct this field work and Polar Field Services and staff
at Summit Station for logistical support. We would like to acknowledge the
editor and two anonymous reviewers for their constructive feedback. This
work was funded by NSF-GRFP 2014186404 and NSF-1506155. Dorothy Hall was
funded by NASA-NNX16AP80A.
Edited by: Michiel van den Broeke
Reviewed by: two anonymous referees
Adolph, A., Albert, M., and Hall, D.: Infrared Surface Temperature near Summit, Greenland in June and July of 2015, Arctic Data Center, https://doi.org/10.18739/A2W27K, 2018.
Ahlstrøm, A. P. and PROMICE project team: A new programme for monitoring the mass loss of the Greenland ice sheet, in: Review of survey activities 2007, edited by: Bennike, O. and Higgins, A. K., GEUS, Copenhagen (Geological Survey of Denmark and Greenland Bulletin 15), 2008.
ARM Climate Research Facility: Millimeter Wavelength Cloud Radar (MMCRMOM), updated hourly, 1 June 2015–30 July 2018, Summit Station, Greenland (SMT) External Data (satellites and others) (X1), compiled by: Johnson, K. and Bharadwaj, N., Atmospheric Radiation Measurement (ARM) Climate Research Facility Data Archive, Oak Ridge, Tennessee, USA, https://doi.org/10.5439/1025228 (last access: 7 March 2018), 2010.
Berkelhammer, M., Noone, D. C., Steen-Larsen, H. C., Bailey, A., Cox, C. J., O'Neill, M. S., Schneider, D., Steffen, K., and White, J. W. C.: Surface-atmosphere decoupling limits accumulation at Summit, Greenland, Sci. Adv., 2, e1501704, https://doi.org/10.1126/sciadv.1501704, 2016.
Box, J. E.: Greenland ice sheet surface mass balance reconstruction. Part II: surface mass balance (1840–2010), J. Climate, 26, 6974–6989, https://doi.org/10.1175/JCLI-D-12-00518.1, 2013.
Casey, K. A., Polashenski, C. M., Chen, J., and Tedesco, M.: Impact of MODIS sensor calibration updates on Greenland Ice Sheet surface reflectance and albedo trends, The Cryosphere, 11, 1781–1795, https://doi.org/10.5194/tc-11-1781-2017, 2017.
Comiso, J. C.: Warming trends in the Arctic from clear sky satellite observations, J. Climate, 16, 3498–3510, https://doi.org/10.1175/1520-0442(2003)016<3498:WTITAF>2.0.CO;2, 2003.
Fausto, R., van As, D., and Ahlstrøm, A.: Assessing the accuracy of Greenland ice sheet ice ablation measurements by pressure transducer, J. Glaciol., 58, 1144–1150, https://doi.org/10.3189/2012JoG12J075, 2012.
Fréville, H., Brun, E., Picard, G., Tatarinova, N., Arnaud, L., Lanconelli, C., Reijmer, C., and van den Broeke, M.: Using MODIS land surface temperatures and the Crocus snow model to understand the warm bias of ERA-Interim reanalyses at the surface in Antarctica, The Cryosphere, 8, 1361–1373, https://doi.org/10.5194/tc-8-1361-2014, 2014.
Good, E. J.: An in situ-based analysis of the relationship between land surface “skin” and screen-level air temperatures, J. Geophys. Res.-Atmos., 121, 8801–8819, https://doi.org/10.1002/2016JD025318, 2016.
Guillevic, P., Göttsche, F., Nickeson, J., Hulley, G., Ghent, D., Yu, Y., Trigo, I., Hook, S., Sobrino, J. A., Remedios, J., Román, M., and Camacho, F.: Land Surface Temperature Product Validation Best Practice Protocol. Version 1.0, edited by: Guillevic, P., Göttsche, F., Nickeson, J., and Román, M., Best Practice for Satellite-Derived Land Product Validation (p. 60): Land Product Validation Subgroup (WGCV/CEOS), https://doi.org/10.5067/doc/ceoswgcv/lpv/lst.001, 2018.
Hachem, S., Duguay, C. R., and Allard, M.: Comparison of MODIS-derived land surface temperatures with ground surface and air temperature measurements in continuous permafrost terrain, The Cryosphere, 6, 51–69, https://doi.org/10.5194/tc-6-51-2012, 2012.
Hall, D. K., Key, J. R., Casey, K. A., Riggs, G. A., and Cavalieri, D. J.: Sea ice surface temperature product from MODIS, IEEE T. Geosci. Remote, 42, 1076–1087, https://doi.org/10.1109/TGRS.2004.825587, 2004.
Hall, D. K., Box, J. E., Casey, K. A., Hook, S. J., Shuman, C. A., and Steffen, K.: Comparison of satellite-derived and in situ observations of ice and snow surface temperatures over Greenland, Remote Sens. Environ., 112, 3739–3749, https://doi.org/10.1016/j.rse.2008.05.007, 2008.
Hall, D. K., Comiso, J. C., DiGirolamo, N. E., Shuman, C. A., Key, J. R., and Koenig, L. S.: A satellite-derived climate-quality data record of the clear-sky surface temperature of the Greenland ice sheet, J. Climate, 25, 4785–4798, https://doi.org/10.1175/JCLI-D-11-00365.1, 2012.
Hall, D. K., Comiso, J. C., DiGirolamo, N. E., Shuman, C. A., Box, J. E., and Koenig, L. S.: Variability in the surface temperature and melt extent of the Greenland ice sheet from MODIS, Geophys. Res. Lett., 40, 2114–2120, https://doi.org/10.1002/grl.50240, 2013.
Hall, D. K., Nghiem, S. V., Rigor, I. G., and Miller, J. A.: Uncertainties of temperature measurements on snow-covered land and sea ice from in situ and MODIS data during BROMEX, J. Appl. Meteorol. Climatol., 54, 966–978, https://doi.org/10.1175/JAMC-D-14-0175.1, 2015.
Hook, S. J., Vaughan, R. G., Tonooka, H., and Schladow, S. G.: Absolute Radiometric In-Flight Validation of Mid Infrared and Thermal Infrared Data From ASTER and MODIS on the Terra Spacecraft Using the Lake Tahoe, CA/NV, USA, Automated Validation Site, IEEE T. Geosci. Remote, 45, 1798–1807, https://doi.org/10.1109/TGRS.2007.894564, 2007.
Hudson, S. R. and Brandt, R. E.: A look at the surface-based temperature inversion on the Antarctic Plateau, J. Climate, 18, 1673–1696, https://doi.org/10.1175/JCLI3360.1, 2005.
Kahl, J. D.: Characteristics of the low-level temperature inversion along the Alaskan Arctic coast, Int. J. Climatol., 10, 537–548, https://doi.org/10.1002/joc.3370100509, 1990.
Koenig, L. S. and Hall, D. K.: Comparison of satellite, thermochron and air temperatures at Summit, Greenland, during the winter of 2008/09, J. Glaciol., 56, 735–741, https://doi.org/10.3189/002214310793146269, 2010.
Kuipers Munneke, P., van den Broeke, M. R., King, J. C., Gray, T., and Reijmer, C. H.: Near-surface climate and surface energy budget of Larsen C ice shelf, Antarctic Peninsula, The Cryosphere, 6, 353–363, https://doi.org/10.5194/tc-6-353-2012, 2012.
Lyapustin, A., Wang, Y., Xiong, X., Meister, G., Platnick, S., Levy, R., Franz, B., Korkin, S., Hilker, T., Tucker, J., Hall, F., Sellers, P., Wu, A., and Angal, A.: Scientific impact of MODIS C5 calibration degradation and C6+ improvements, Atmos. Meas. Tech., 7, 4353–4365, https://doi.org/10.5194/amt-7-4353-2014, 2014.
Miller, N. B., Turner, D. D., Bennartz, R., Shupe, M. D., Kulie, M. S., Cadeddu, M. P., and Walden, V. P.: Surface-based inversions above central Greenland, J. Geophys. Res.-Atmos., 118, 495–506, https://doi.org/10.1029/2012JD018867, 2013.
Miller, N. B., Shupe, M. D., Cox, C. J., Walden, V. P., Turner, D. D., and Steffen, K.: Cloud Radiative Forcing at Summit, Greenland, J. Climate, 28, 6267–6280, https://doi.org/10.1175/JCLI-D-15-0076.1, 2015.
Miller, N. B., Shupe, M. D., Cox, C. J., Noone, D., Persson, P. O. G., and Steffen, K.: Surface energy budget responses to radiative forcing at Summit, Greenland, The Cryosphere, 11, 497–516, https://doi.org/10.5194/tc-11-497-2017, 2017.
Moran, K. P., Martner, B. E., Post, M., Kropfli, R. A., Welsh, D. C., and Widener, K. B.: An unattended cloud-profiling radar for use in climate research, B. Am. Meteorol. Soc., 79, 443–455, https://doi.org/10.1175/1520-0477(1998)079<0443:AUCPRF>2.0.CO;2, 1998.
NASA LP DAAC: MODIS/Aqua Land Surface Temperature and Emissivity 5-Minute L2 Swath 1 km V006, NASA EOSDIS Land Processes DAAC, USGS Earth Resources Observation and Science (EROS) Center, Sioux Falls, South Dakota (https://lpdaac.usgs.gov), https://doi.org/10.5067/MODIS/MYD11_L2.006 (last access: 3 February 2017), 2014.
Navari, M., Margulis, S. A., Bateni, S. M., Tedesco, M., Alexander, P., and Fettweis, X.: Feasibility of improving a priori regional climate model estimates of Greenland ice sheet surface mass loss through assimilation of measured ice surface temperatures, The Cryosphere, 10, 103–120, https://doi.org/10.5194/tc-10-103-2016, 2016.
NOAA ESRL Global Monitoring Division. Meteorology measurements at Summit Station, Greenland. Compiled by the Observatory Operations Group. National Oceanic and Atmospheric Administration (NOAA), Earth System Research Laboratory (ESRL), Global Monitoring Division (GMD): Boulder, Colorado, USA, 2017.
Østby, T. I., Schuler, T. V., and Westermann, S.: Severe cloud contamination of MODIS Land Surface Temperatures over an Arctic ice cap, Svalbard, Remote Sens. Environ., 142, 95–102, https://doi.org/10.1016/j.rse.2013.11.005, 2014.
Overland, J. E. and Guest, P. S.: The Arctic snow and air temperature budget over sea ice during winter, J. Geophys.Res.-Oceans (1978–2012), 96, 4651–4662, https://doi.org/10.1029/90JC02264, 1991.
Phillpot, H. R. and Zillman, J. W.: The surface temperature inversion over the Antarctic continent, J. Geophys. Res., 75, 4161–4169, https://doi.org/10.1029/JC075i021p04161, 1970.
Polashenski, C. M., Dibb, J. E., Flanner, M. G., Chen, J. Y., Courville, Z. R., Lai, A. M., Schauer, J. J., Shafer, M. M., and Bergin, M.: Neither dust nor black carbon causing apparent albedo decline in Greenland's dry snow zone: Implications for MODIS C5 surface reflectance, Geophys. Res. Lett., 42, 9319–9327, https://doi.org/10.1002/2015GL065912, 2015.
Rae, J. G. L., Aðalgeirsdóttir, G., Edwards, T. L., Fettweis, X., Gregory, J. M., Hewitt, H. T., Lowe, J. A., Lucas-Picher, P., Mottram, R. H., Payne, A. J., Ridley, J. K., Shannon, S. R., van de Berg, W. J., van de Wal, R. S. W., and van den Broeke, M. R.: Greenland ice sheet surface mass balance: evaluating simulations and making projections with regional climate models, The Cryosphere, 6, 1275–1294, https://doi.org/10.5194/tc-6-1275-2012, 2012.
Reeh, N.: Parameterization of melt rate and surface temperature on the Greenland ice sheet, Polarforschung, 59, 113–128, 1989.
Reeves Eyre, J. E. J. and Zeng, X.: Evaluation of Greenland near surface air temperature datasets, The Cryosphere, 11, 1591–1605, https://doi.org/10.5194/tc-11-1591-2017, 2017.
Riggs, G. A., Hall, D. K., and Román, M. O.: Overview of NASA's MODIS and Visible Infrared Imaging Radiometer Suite (VIIRS) snow-cover Earth System Data Records, Earth Syst. Sci. Data, 9, 765–777, https://doi.org/10.5194/essd-9-765-2017, 2017.
Rignot, E., Velicogna, I., van den Broeke, M. R., Monaghan, A., and Lenaerts, J. T.: Acceleration of the contribution of the Greenland and Antarctic ice sheets to sea level rise, Geophys. Res. Lett., 38, L05503, https://doi.org/10.1029/2011GL046583, 2011.
Shamir, E. and Georgakakos, K. P.: MODIS Land Surface Temperature as an index of surface air temperature for operational snowpack estimation, Remote Sens. Environ., 152, 83–98, https://doi.org/10.1016/j.rse.2014.06.001, 2014.
Shuman, C. A., Steffen, K., Box, J. E., and Stearns, C. R.: A dozen years of temperature observations at the Summit: Central Greenland automatic weather stations 1987–99, J. Appl. Meteorol., 40, 741–752, https://doi.org/10.1175/1520-0450(2001)040<0741:ADYOTO>2.0.CO;2, 2001.
Shuman, C. A., Hall, D. K., DiGirolamo, N. E., Mefford, T. K., and Schnaubelt, M. J.: Comparison of near-surface air temperatures and MODIS ice-surface temperatures at Summit, Greenland (2008–13), J. Appl. Meteorol. Climatol., 53, 2171–2180, https://doi.org/10.1175/JAMC-D-14-0023.1, 2014.
Steffen, K. and Box, J.: Surface climatology of the Greenland ice sheet: Greenland Climate Network 1995–1999, J. Geophys. Res.-Atmos., 106, 33951–33964, https://doi.org/10.1029/2001JD900161, 2001.
Steffen, K., Box, J., and Abdalati, W.: Greenland climate network: GC-Net, US Army Cold Regions Research and Engineering (CRREL), CRREL Special Report, 98–103, 1996.
Stocker, T. F.: Climate change 2013: the physical science basis: Working Group I contribution to the Fifth assessment report of the Intergovernmental Panel on Climate Change, Cambridge University Press, 2014.
Sverdrup, H. U.: Scientific work of the Maud Expedition, 1922–1925, The Scientific Monthly, 22, 400–410, 1926.
Van As, D., Van Den Broeke, M., and Van De Wal, R., Daily cycle of the surface layer and energy balance on the high Antarctic Plateau, Antarctic Science, 17, 121–133, https://doi.org/10.1017/S095410200500252X, 2005.
Van As, D., Fausto, R. S., and PROMICE Project Team: Programme for monitoring of the Greenland Ice Sheet (PROMICE): first temperature and ablation records, in: Review of survey activities 2010, edited by: Bennike, O., Garde, A. A., and Watt, W. S., GEUS, Copenhagen, 73–76 (Geological Survey of Denmark and Greenland Bulletin 23), 2011.
Van Den Broeke, M., Reijmer, C., Van As, D., and Boot, W.: Daily cycle of the surface energy balance in Antarctica and the influence of clouds, Int. J. Climatol., 26, 1587–1605, https://doi.org/10.1002/joc.1323, 2006.
van den Broeke, M. R., Enderlin, E. M., Howat, I. M., Kuipers Munneke, P., Noël, B. P. Y., van de Berg, W. J., van Meijgaard, E., and Wouters, B.: On the recent contribution of the Greenland ice sheet to sea level change, The Cryosphere, 10, 1933–1946, https://doi.org/10.5194/tc-10-1933-2016, 2016.
Van Lipzig, N. P. M., Van Meijgaard, E., and Oerlemans, J.: The effect of temporal variations in the surface mass balance and temperature-inversion strength on the interpretation of ice-core signals, J. Glaciol., 48, 611–621, https://doi.org/10.3189/172756502781831106, 2002.
Vernon, C. L., Bamber, J. L., Box, J. E., van den Broeke, M. R., Fettweis, X., Hanna, E., and Huybrechts, P.: Surface mass balance model intercomparison for the Greenland ice sheet, The Cryosphere, 7, 599–614, https://doi.org/10.5194/tc-7-599-2013, 2013.
Waddington, E. D. and Morse, D. L.: Spatial variations of local climate at Taylor Dome, Antarctica: Implications for paleoclimate from ice cores, Ann. Glaciol., 20, 219–225, https://doi.org/10.3189/172756494794587014, 1994.
Wan, Z: MODIS Land-Surface Temperature Algorithm Theoretical Basis Document (LST ATBD) Version 3.3, available at: https://modis.gsfc.nasa.gov/data/atbd/atbd_mod11.pdf (last access: 4 March 2018), 1999.
Wan, Z.: New refinements and validation of the MODIS land-surface temperature/emissivity products, Remote Sens. Environ., 112, 59–74, https://doi.org/10.1016/j.rse.2006.06.026, 2008.
Wan, Z.: New refinements and validation of the collection-6 MODIS land-surface temperature/emissivity product, Remote Sens. Environ., 140, 36–45, https://doi.org/10.1016/j.rse.2013.08.027, 2014.
Wan, Z. and Dozier, J.: A generalized split-window algorithm for retrieving land-surface temperature from space, IEEE T. Geosci. Remote, 34, 892–905, https://doi.org/10.1109/36.508406, 1996.
Warren, S. G. and Brandt, R. E.: Optical constants of ice from the ultraviolet to the microwave: A revised compilation, J. Geophys. Res., 113, D14220 https://doi.org/10.1029/2007jd009744, 2008.
Wenny, B., Xiong, X., and Madhavan, S.: Evaluation of Terra and Aqua MODIS thermal emissive band calibration consistency, in: SPIE Remote Sensing, 853317–853317, International Society for Optics and Photonics, https://doi.org/10.1117/12.974230, 2012.
Westermann, S., Langer, M., and Boike, J.: Systematic bias of average winter-time land surface temperatures inferred from MODIS at a site on Svalbard, Norway, Remote Sens. Environ., 118, 162–167, https://doi.org/10.1016/j.rse.2011.10.025, 2012.
Williamson, S. N., Hik, D. S., Gamon, J. A., Jarosch, A. H., Anslow, F. S., Clarke, G. K., and Rupp, T. S.: Spring and summer monthly MODIS LST is inherently biased compared to air temperature in snow covered sub-Arctic mountains, Remote Sens. Environ., 189, 14–24, https://doi.org/10.1016/j.rse.2016.11.009, 2017.
Yu, Y., Rothrock, D. A., and Lindsay, R. W.: Accuracy of sea ice temperature derived from the advanced very high resolution radiometer, J. Geophys. Res.-Oceans (1978–2012), 100, 4525–4532, https://doi.org/10.1029/94JC02244, 1995.
Xiong, X., Wu, A.,Wenny, B. N., Madhavan, S., Wang, Z., Li, Y., Chen, N., Barnes, W. L., and Salomonson, V. V.: Terra and Aqua MODIS Thermal Emissive Bands On-Orbit Calibration and Performance, IEEE T. Geosci. Remote, 53, 5709–5721, https://doi.org/10.1109/TGRS.2015.2428198, 2015.