the Creative Commons Attribution 4.0 License.
the Creative Commons Attribution 4.0 License.
 | 11 Dec 2019
Brief communication: An alternative method for estimating the scavenging efficiency of black carbon by meltwater over sea ice
Zhiheng Du
Shutong Li
Yulan Zhang
Qi Zhang
Mingju Hao
Chuanjin Li
Biao Tian
Minghu Ding
Cunde Xiao
The meltwater scavenging coefficient (MSC) of black carbon (BC) is a crucial parameter in snow and sea ice models, as it determines the BC enrichment in the surface layer of melting snow over sea ice and therefore modulates the BC–snow–albedo feedbacks. We present a new method for MSC estimation by sampling the melt–refreeze ice layer that is produced from refreezing of the meltwater within snowpack and its overlying snow and measuring their physical characteristics in Elson Lagoon northeast of Utqiaġvik (formerly Barrow), Alaska, during the melting season. The bias of estimated MSC ranges from −5.4 % to 7.3 %, which is not exactly dependent on the degree of ablation. The average MSC value calculated with this proposed method is slightly lower than that derived from the repeating sampling (RS) method in Elson Lagoon while still being within its best estimate range. Further estimation demonstrates that the MSC in the Canada Basin (23.6 %±2.1 %) is close to that in Greenland (23.0 %±12.5 %) and larger than that in the Chukchi Sea (17.9 %±5.0 %) in the northwest of Utqiaġvik. Elson Lagoon has the lowest MSC (14.5 %±2.6 %) in the study areas. The method suggested in this study provides a possible approach for large-scale measurements of MSC over the sea ice area in the Arctic. Of course, this method depends on the presence of a melt–refreeze ice layer in the observation area.


Black carbon (BC) is among the most efficient particulate species at absorbing visible light, which can reduce the surface albedo and potentially accelerate snowmelt (Flanner et al., 2007; Goldenson et al., 2012; Dou et al., 2012; 2017). Previous studies suggested an annual-mean radiative forcing of 0.1–0.3 W m−2 over the Arctic region from BC deposition (Flanner et al., 2009; Jiao et al., 2014). However, significant uncertainties still exist in the sea ice region due to lack of field measurements and poor understanding of BC enrichment by overlying snowmelt.
The enrichment of BC in melting snow largely depends on meltwater scavenging coefficient (MSC), as it reflects the ratio of BC concentration in the meltwater departing the snow layer to the bulk concentration in the exact layer (Flanner et al., 2007). MSC which leads to enhanced concentrations of BC in surface snow is considerably less than 100 % according to very few previous studies (e.g. Conway et al., 1996; Xu et al., 2012; Doherty et al., 2013). In present snow and sea ice models (e.g. Flanner et al., 2007; Goldenson et al., 2012; Holland et al., 2012), MSC is valued as a constant of 20 % and 3 % for hydrophilic BC and hydrophobic BC, respectively, which were derived from the observations conducted at Snow Dome (2050 m) of the mid-latitude Blue Glacier (Conway et al., 1996).
More recently, the MSC of BC was re-evaluated based on the field measurements in Elson Lagoon (Utqiaġvik, formerly Barrow, Alaska) and at DYE-2 station (Greenland) during the melting season (Doherty et al., 2013). They suggested a rough range of 10 % to 30 % in the study area. The method adopted in previous studies requires continuous sampling for about 2–3 weeks at each site and thus is laborious to apply for large-scale measurements in the polar area. Here, as an alternative, an experimental approach for calculating MSC is proposed which may provide a new way for MSC measuring, and a further comparison between the regional differences of MSCs is presented as well.
The melt–refreeze ice layer within the snowpack resulted from the refreezing of meltwater percolating into the snow. The suspended particles, especially those with larger surface areas, such as BC, may stay in place and freeze in the crystal lattice during the refreezing of meltwater (Novotny and Krenkel, 2002). That said, the freezing process does not preferentially exclude BC. Accordingly, here we assume that the BC concentration in the ice layer is identical to that in the meltwater. The BC concentrations in the melt–refreeze ice layer and its overlying snow layer together were used to determine the MSC, considering the thickness and density of the two layers. We conducted the field measurements and sampling in Elson Lagoon, the Chukchi Sea and the Canada Basin during the melt season (Fig. 1). After constraining the uncertainties of this new method, the estimated MSC is compared to those derived from the repeating sampling (RS) method in the same area; further, the spatial variability of MSC in the western Arctic will be discussed.

Figure 1The locations of snow and ice layer sampling and the measurements of snow thickness and density in this study. Barrow expeditions include the field measurements carried out in the Elson Lagoon in 2015, and in the Chukchi Sea in 2017 and 2018; the third Chinese Arctic Expedition was conducted over the Canada Basin and the centre region of Arctic Ocean in 2008; the first South Korean Arctic Expedition was conducted over the Canada Basin in 2010; the North Pole Expedition refers to the first Chinese expedition hiking through the North Pole from 88 to 90∘ N in 1995 (Xiao et al., 1997). The open circle indicates the point at which the ice layer was observed. The solid triangles and circles mark the locations for both sampling and on-site measurements.
We collected the snow samples in Elson Lagoon northeast of Utqiaġvik (Barrow Expedition), in the Chukchi Sea (Barrow Expedition) and in the Canada Basin (first South Korean Arctic Ocean Expedition) during the late spring and summer over the past decade (2010 to 2018). The snow physics were also measured during the three Barrow sea ice expeditions (years 2015, 2017 and 2018) and the first South Korean Arctic Ocean Expedition (year 2010). In the third Chinese Arctic Expedition (year 2008), only snow physics were observed.
The field measurement involves the snow thickness, snow density and stratification. In Elson Lagoon, we measured the snow depth along a 10 km line before melt onset (15 April 2015) and determined the average snow depth in this region. A far-shore site was chosen ∼12 km away from the coast where the snow depth was close to the mean value (31.6±5.4 cm) of this region (Fig. 1). The snow stratification was firstly recorded, and then snow density was measured at 2.5 cm vertical resolution using the Snow Fork instrument. Four points were measured per time in each layer. We applied the average value of snow density to characterise the snow layer. The snow depth was recorded at ablation stakes next to the snow pit. In the Chukchi Sea, the spatial variation of snow depth is more significant as compared with the Elson Lagoon due to the presence of ice ridge. We firstly selected a relatively smooth area of sea ice and measured the snow depth along a 200 m line in the centre region of the flat ice on 6 April 2017. The observation site was chosen at a location close to the average snow depth, and the measurement procedure was the same as that applied in Elson Lagoon. Note that there was a deviation between the observation sites of 2017 and 2018 due to the interannual variation in the ice condition over the Chukchi Sea (Fig. 1). In the Canada Basin, we conducted the measurements of snow depth at a 100 m line over floe ice due to the smaller ice size and limited operating time. Snow density was measured using Tel-Tru densitometer (Tel-Tru Manufacturing Co., Inc., Rochester, NY) with an accuracy of 1 g, and a snow shovel of 2.5 cm in thickness. The thickness of the snow layer and the position of melt–refreeze ice layer were measured using a ruler.
The sample collection was performed at three stages in Elson Lagoon and the Chukchi Sea during the expeditions in 2015 and 2017. At the stage before snow-melting onset, we collected snow from 4 cm above the sea ice up to the snow surface. At the early stage of melting, the upper snow layer was firstly collected, and then the underlying ice layer was sampled separately in the same snow pit. The newly fallen snow was also collected once new snowfall occurred. In order to study the spatial distribution of BC, we dug up three snow pits to sample parallelly at each site (50 m apart from each other) and measured the physical characteristics synchronously. Observations show that the differences in BC concentrations of the three snow pits are negligible, as the standard deviation value was 1 order of magnitude lower than the mean concentration. We took the average BC concentration from all three pits as the BC concentration at that exact site. At the end of the snow-melting season and when most of the snowpack had melted, we collected the top 4 cm layer of snow to analyse the BC concentration in the melted snow. In 2018, we just collected samples of melting snow in the Chukchi Sea. Table 1 shows the details of sample collecting.
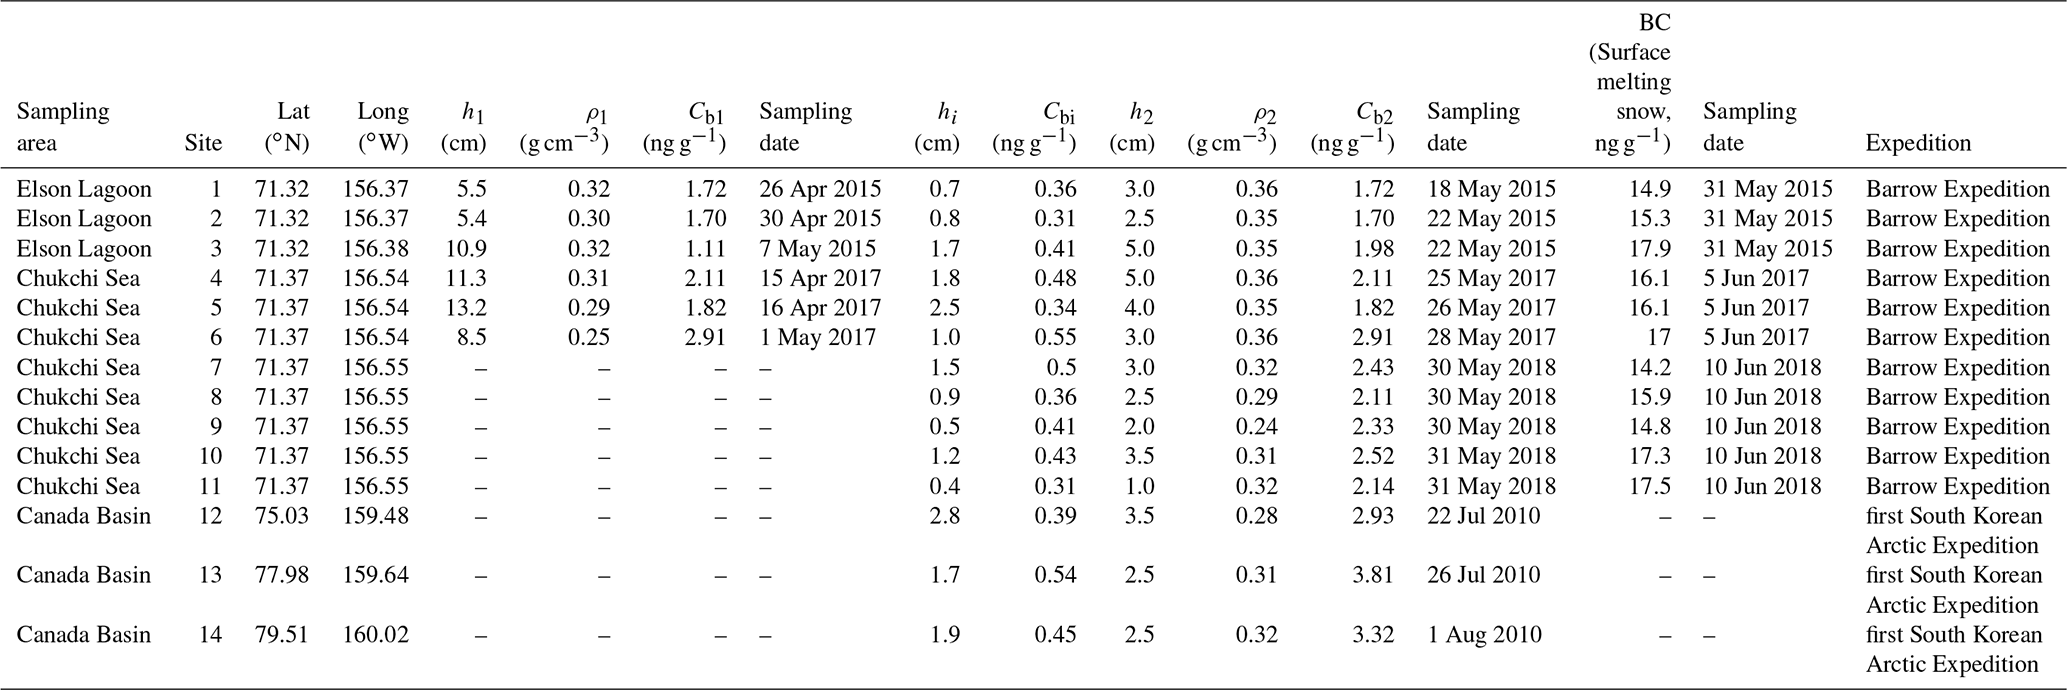
Table 1The concentrations of BC observed in the melt–refreeze ice layer and its overlying snow. The thickness of snow and ice layer and snow density observed simultaneously are shown. Note that the observations before and after the ablation events in Elson Lagoon and the Chukchi Sea during the Barrow Expedition are shown as sites 1–6. The sampling locations and dates are also shown. Refer to Fig. 3 for the description of variable names. “BC (surface melting snow)” denotes BC concentration in the top 4 cm layer of melting snow at the end of melt season when most of the snowpack had melted.
Sampling was performed using a pre-cleaned plastic shovel and single-use vinyl gloves. Samples were stored in polyethylene bags that had been thoroughly washed with abundant deionised ultrapure water in the laboratory before use. In the laboratory, the snow samples were allowed to melt at ambient temperature (18–20 ∘C) and were immediately filtered through quartz-fibre filters (25 mm, Whatman® QM-A). The filters were stored in an insulated cabinet with blue ice, kept at low temperature, which prevented bacteria from producing, and transported to the laboratory at the University of Chinese Academy of Sciences for analysis.
We used two analytical methods to measure the concentration of BC. The quartz filters were firstly dried between 60 and 70 ∘C and then measured using an optical transmission analytical method (Model OT-21, Magee Scientific, California, USA). The OT-21 is widely used in the measurement of atmospheric BC aerosol. After that, a 1.0 cm2 punch was cut from each filter and was analysed for elemental carbon (EC) using the Thermos-optical NIOSH 5040 method (Sunset Laboratory Inc., Forest Grove, USA), which has been applied to measure EC in Svalbard snow (Forsström et al., 2013). A comparison between EC and BC in a previous study (Dou et al., 2017) showed that the values obtained from two different methods are highly correlated (R2=0.97). For consistency, we adopt BC referring to BC and EC. Five blanks were processed following the same analytical procedure as the samples, except that they were filtered with ultrapure water. The measured BC background of the filters (0.03±0.02 ng g−1) is an order of magnitude lower than the concentration of the ice layer. The values in Table 1 have been corrected by excluding blanks.
During two Arctic Ocean expeditions (years 2008 and 2010), ice layers developed in almost all snowpacks over sea ice in the measurement area, and the snow stratigraphy and thickness exhibited highly spatial variabilities. The observed thickness of ice layers ranges from ∼0.3 to ∼2.8 cm. During the field measurements in Elson Lagoon in 2015, we recorded that the ice layer came into existence on 18 and 22 May, the early stage of the sea-ice melting season. The ice layer was observed in the Chukchi Sea on 25–28 May 2017 and on 30–31 May 2018.
The ice layer results from the refreeze meltwater that percolates into cold snow along with layer-parallel capillary barriers by heat conduction into surrounding subfreezing snow (Pfeffer and Humphrey, 1998; Massom et al., 2001; Colbeck et al., 2009). It detains BC particles in the meltwater, leaving the upper snow layer. Except for the formation mechanism mentioned above, ice layers could also generate from the radiation crust or liquid precipitation refreezing (Massom et al., 2001). However, the BC concentrations in these two types of ice layers are of the same order of magnitude as those of new or recently fallen snow. Besides, the radiation crust usually forms on the snow surface (Colbeck et al., 2009; Dou and Xiao, 2013). The ice layer frozen from liquid precipitation is mostly formed during winter season before the snowmelt onset (Sturm et al., 2002; Langlois et al., 2017). These two types of ice layers cannot reflect the BC scavenging with meltwater and thus were not considered in this study.
By measuring BC in the selected melt–refreeze ice layer and its overlying snow, we observed that the concentration of the ice layer is 0.42±0.08 ng g−1 in the measurement area, suggesting that ∼0.42 ng of BC particles can be carried away from the snow layer by 1 g water. Before estimating MSC, we compared the BC concentration in the ice layer with those of other snow layers in the measurement area at different ablation stages. The BC concentration increased from 1.32±0.20 ng g−1 in the new snow to 2.42±0.63 ng g−1 in the generally melting snow (Fig. 2), and the concentration in the surface layer increased up to 15.91±1.12 ng g−1 at the end of snow ablation.
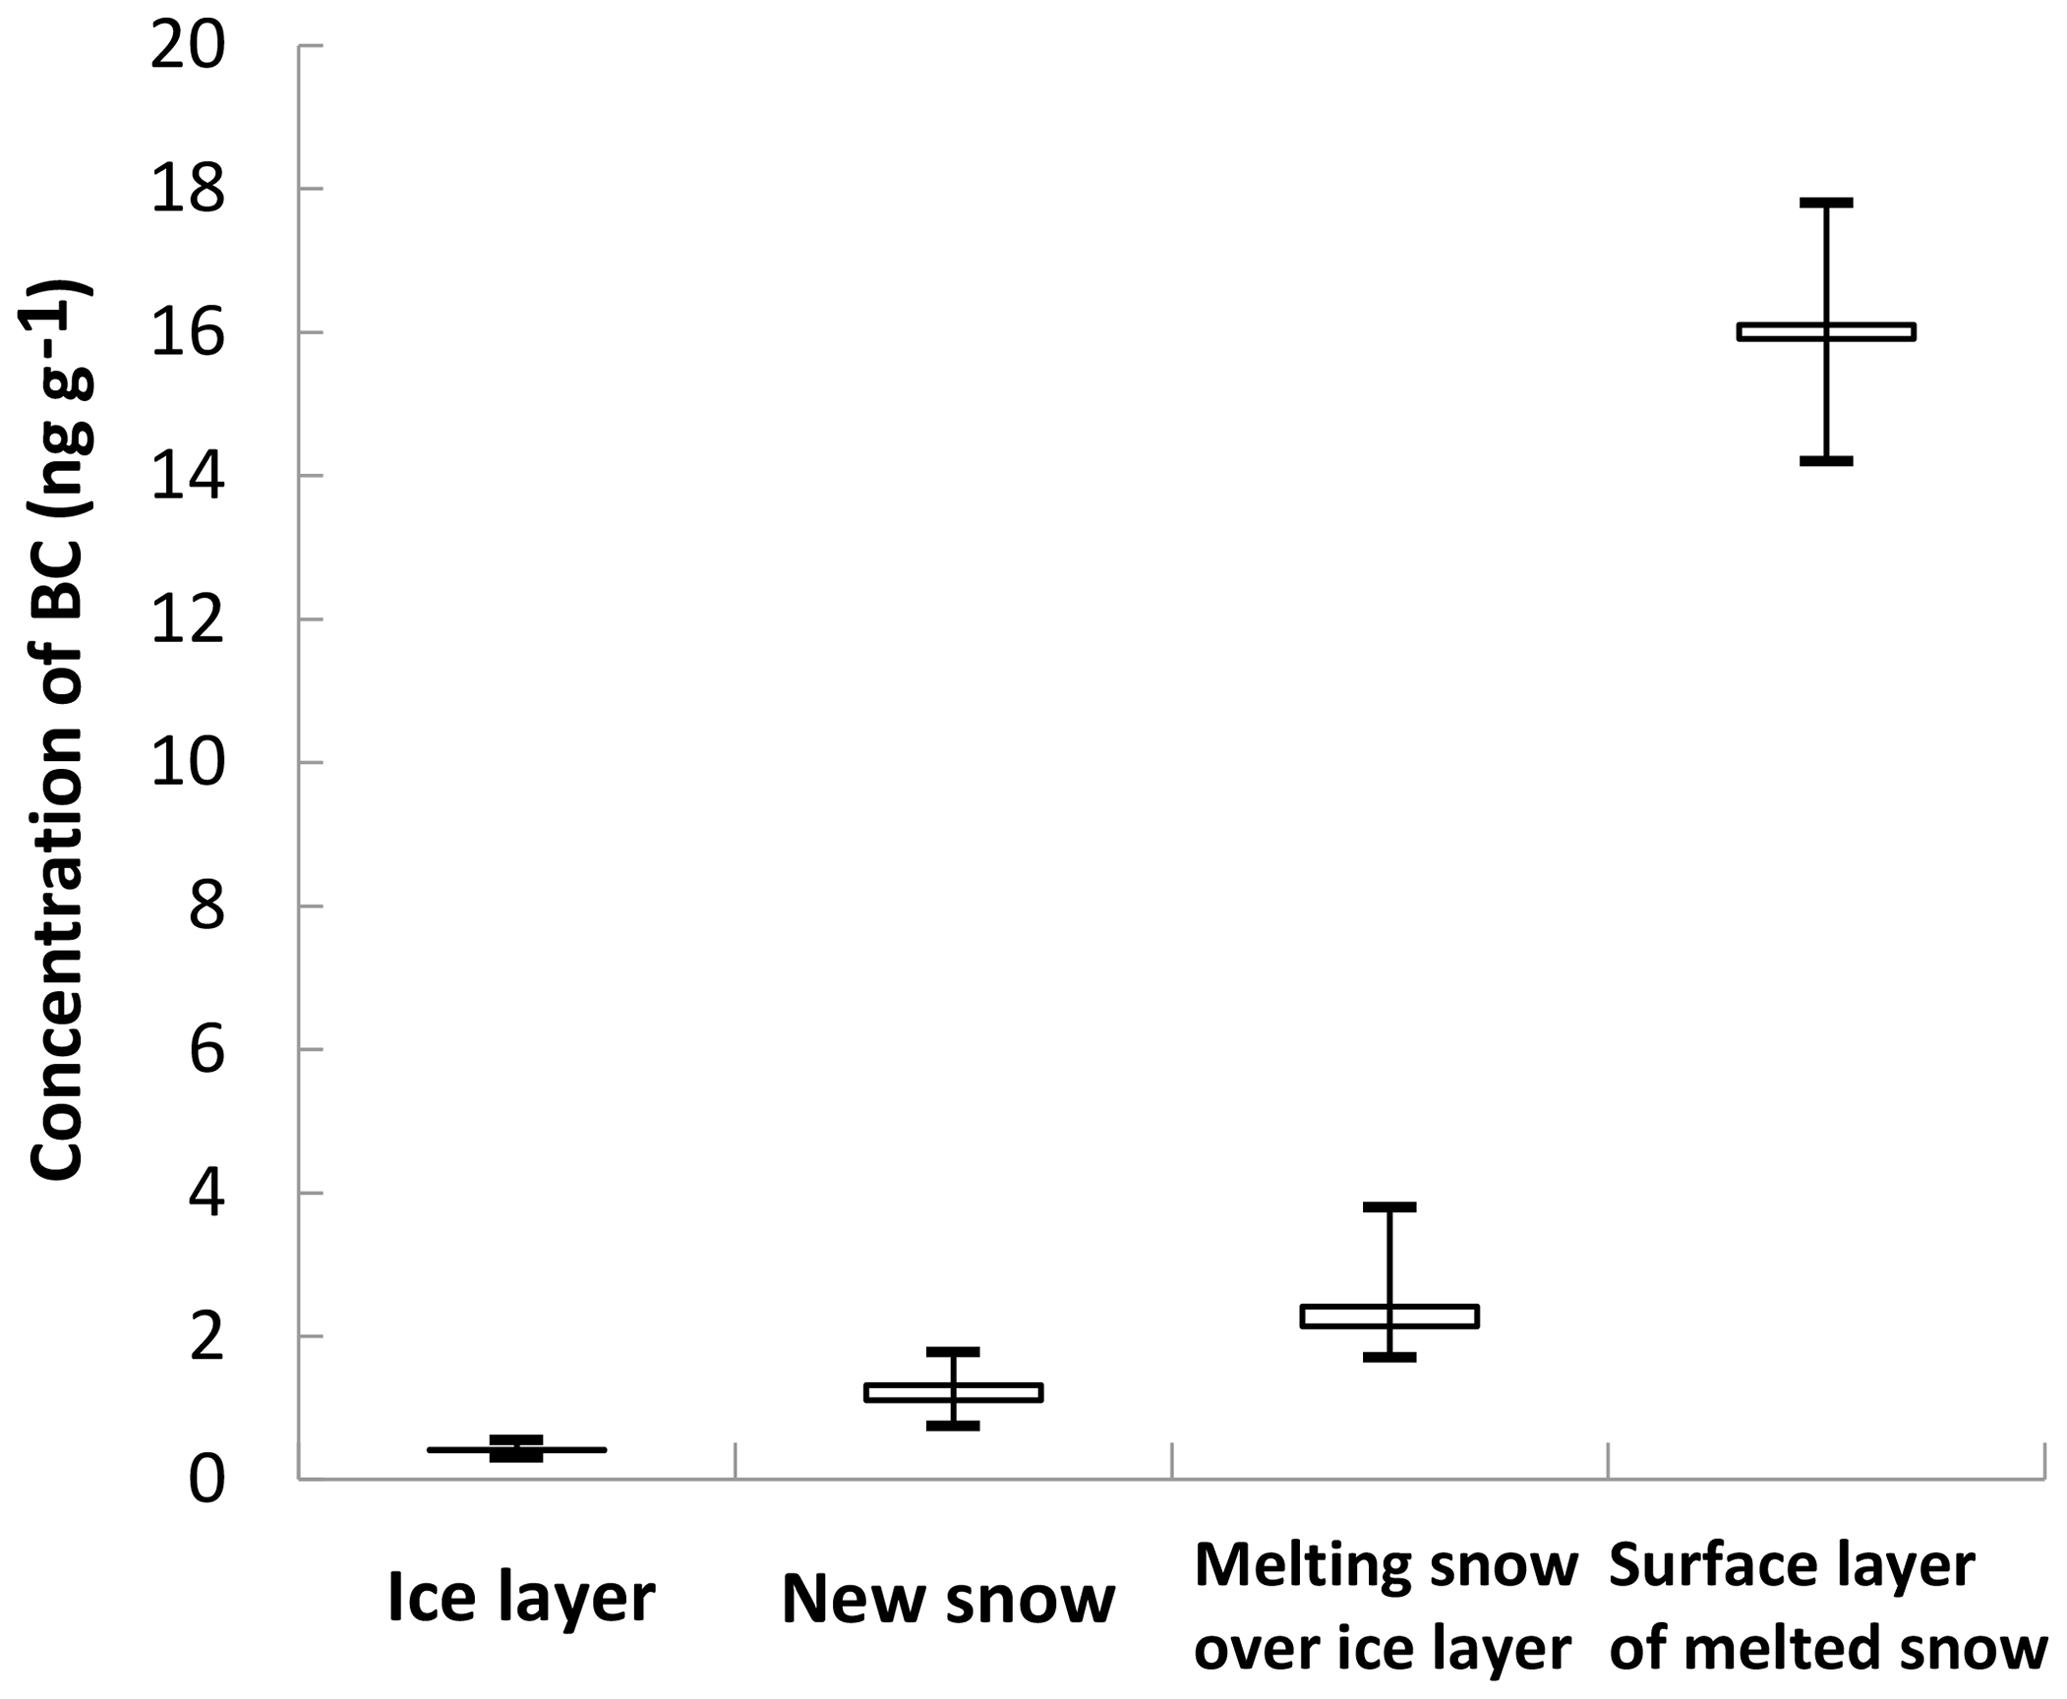
Figure 2The BC concentrations in the melt–refreeze ice layer and melting snow, and its concentrations in the new snow and the surface layer of melting snow are also shown as a comparison. New-snow samples were only collected in Elson Lagoon and the Chukchi Sea during the measurement period. The box indicates the mean (upper) and median (bottom) values of the observations, and the whiskers constrain the full extent of the observations.
The MSC is estimated based on the observations of BC, snow density and thickness. By determining the burden of BC per area (ng BC cm−2) in the ice layer and the average original BC mass per unit area in the unmelted snowpack, the scavenging efficiency (MSC) is given by
where hi (cm), ρi (g cm−3) and Cbi (ng g−1) are respectively the thickness, density and BC mass concentration of the ice layer (Fig. 3); h1 (cm), ρ1 (g cm−3) and Cb1 (ng g−1) are the same variables but for the snow layer before the melt event (Fig. 3). Note that determining scavenging efficiency with this method requires measuring the above factors at a given site at least twice, before and after the melt event.
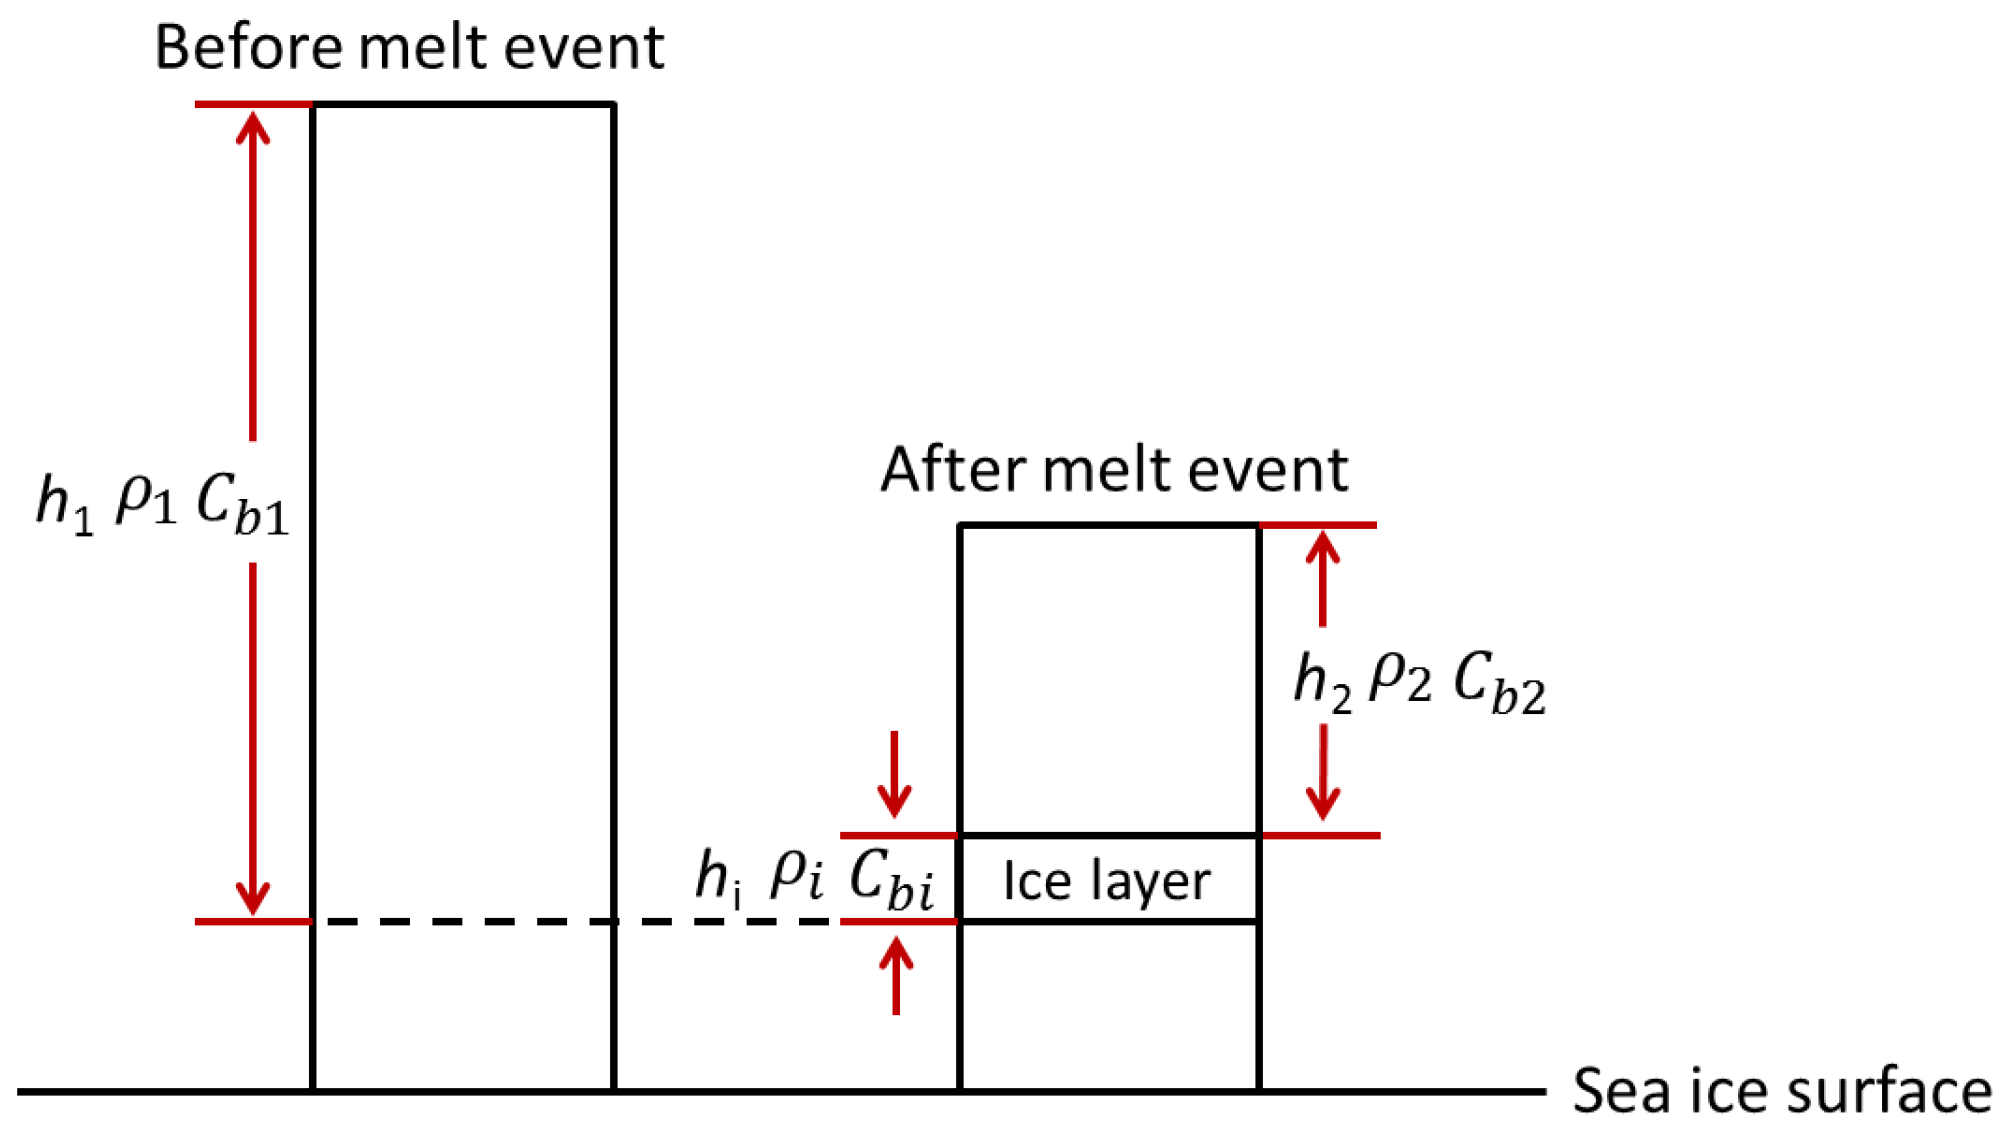
If snow physics and BC concentration were not measured before the melt event, we would choose another method to calculate MSC. We assumed that as the surface snow melts, BC particles scavenged by meltwater are refrozen in the melt–refreeze ice layer, that is, , where h2 (cm), ρ2 (g cm−3) and Cb2 (ng g−1) are respectively the thickness, snow density and BC mass concentration of the melting snow overlying the ice layer (Fig. 3) so that
The assumption behind the proposed new method also implies that all of the meltwater generated from the original snow column is conserved in the ice layer and its overlying snow. Thus, h1⋅ρ1 is also equal to in the assumption.
Since the new method largely depends on the conservation of snow mass and BC content before and after the ablation event, we validate the above presumption using the observations that involve snow sampling both before and after the melt event at six sites during the Barrow expeditions (Table 1). The average of the snow density and BC concentration of the whole layer of snow were used to represent the situation (ρ1Cb1) of the upper part (h1) of the snow layer before ablation. Here, deviations from 100 % conserved are used to measure the conservation of BC (( %) and snow (( %), and to evaluate the uncertainty in the derived scavenging efficiencies. The loss of snow mass and BC content after the ablation event are both smaller than 7.0 % (Fig. 4a), indicating that most of the meltwater and BC within it was re-frozen in the ice layer and the BC content was substantially conserved. The assumption of the proposed new method is valid in the measurement area during the sampling period.
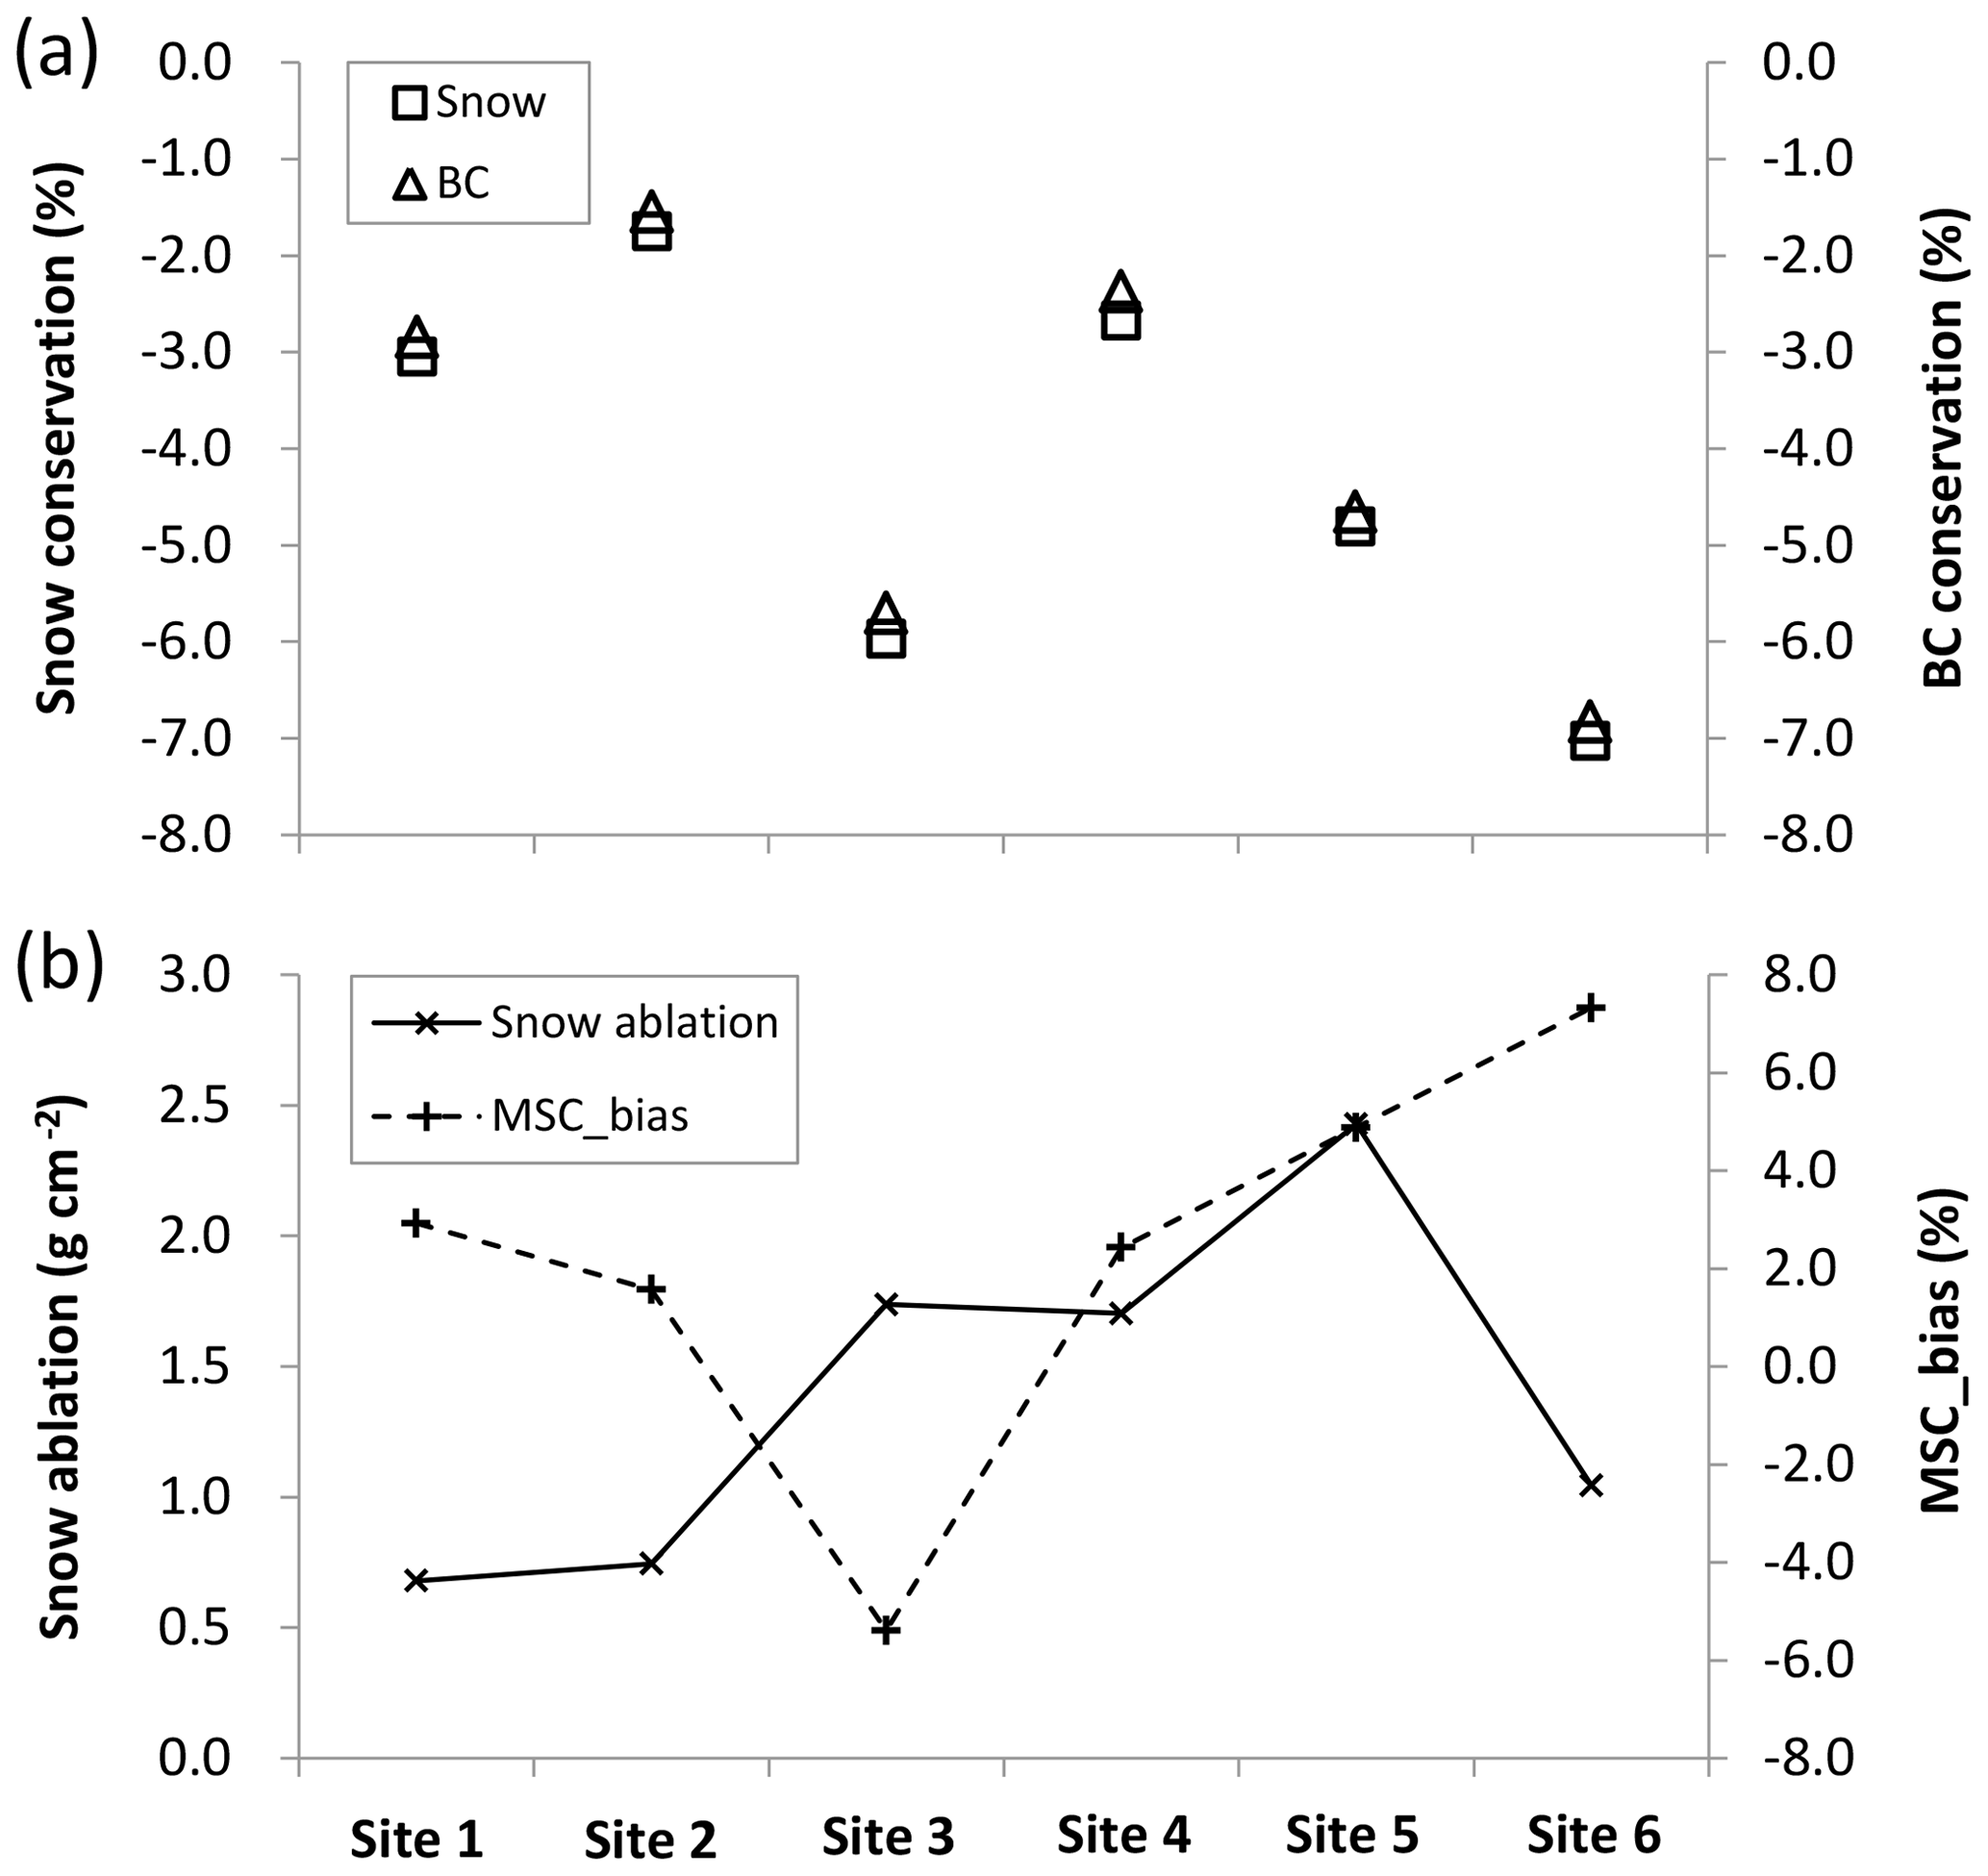
Figure 4The deviations from 100 % conserved for snow and BC after ablation (a), snow ablation () during the melt event and the bias ((MSC_2-MSC_1)/MSC_1)∗100 % of estimated MSC based on Eq. (2) (b). The ticks on the x axis are matching sites given in Table 1.
According to Eq. (2), we estimated the MSC (MSC_2) in the measurement area and compared it with the MSC_1 calculated based on Eq. (1). The result indicates that there is a slight difference in the MSCs calculated separately by the two methods. The bias of MSC ((MSC_2-MSC_1)/MSC_1) caused by the deviation of snow and BC from 100 % conserved before and after melt is smaller than 7.2 % (Fig. 4b). Further analysis showed that there is no apparent correlation between the estimated bias of MSC and the degree of snowmelt (Fig. 4b).
With the new method, we calculated the MSC in Elson Lagoon and compared it with that estimated according to Eq. (2) in Doherty et al. (2013). Results indicate that the MSC (14.5 %) calculated by the new method is smaller than that (20.4 %) by the method of Doherty et al. (2013) based on the observations in this study. The difference in MSCs estimated by these two methods is reasonable since the latter represents the upper limits of MSC. Our estimation is close to the average value (16.2 %) derived by repeated sampling (RS) introduced by Doherty et al. (2013) in the same area and is still within its best estimation (14.0 %–20.0 %).
The scavenging efficiency of BC is mainly determined by the particle size and the hydrophobicity, which interfered with other impurities since BC usually occurs in the particles as an “internal mixture” in the Arctic (Doherty et al., 2013). These influencing factors show significant regional differences due to various sources of BC and distinguishing deposition and transport processes (Korhonen et al., 2008; AMAP, 2011; Sharma et al., 2013; Schulz et al., 2019), leading to spatial variations in MSCs, which has been confirmed by the observations at Utqiaġvik and DYE-2 station, Greenland (Doherty et al., 2013). Conway et al. (1996) found that the hydrophilic BC is much more efficiently scavenged by meltwater than the hydrophobic one. Flanner et al. (2007) further estimated that the MSC for hydrophilic BC is about 10 times that for hydrophobic one, meaning that the relative ratios of the two types of BC in the snow also have impacts on the spatial distribution of the MSCs. From the observations in this study (Chukchi Sea, Elson Lagoon and Canada Basin) and the results of Doherty et al. (2013) (Elson Lagoon and DYE-2, Greenland), we investigated the spatial differences of MSC in the western Arctic. The average of the MSCs in the Canada Basin (23.6 %±2.1 %) is basically the same as that at the DYE-2 site, Greenland (23.0 %±12.5 %), while it is more significant than that of the Chukchi Sea (17.9 %±5.0 %); Elson Lagoon has the lowest MSC (14.5 %±2.6 %) (Fig. 5). We further analysed the statistical significance of the differences in MSC at various locations. The Jonckheere–Terpstra test indicated that it is highly significant (p<0.01) for Elson Lagoon < Chukchi Sea < Canada Basin, and the Mann–Whitney U test demonstrated that the difference from each other is moderately significant (p<0.1). The average of the MSCs in the western Arctic is 18.0 %±3.8 %.
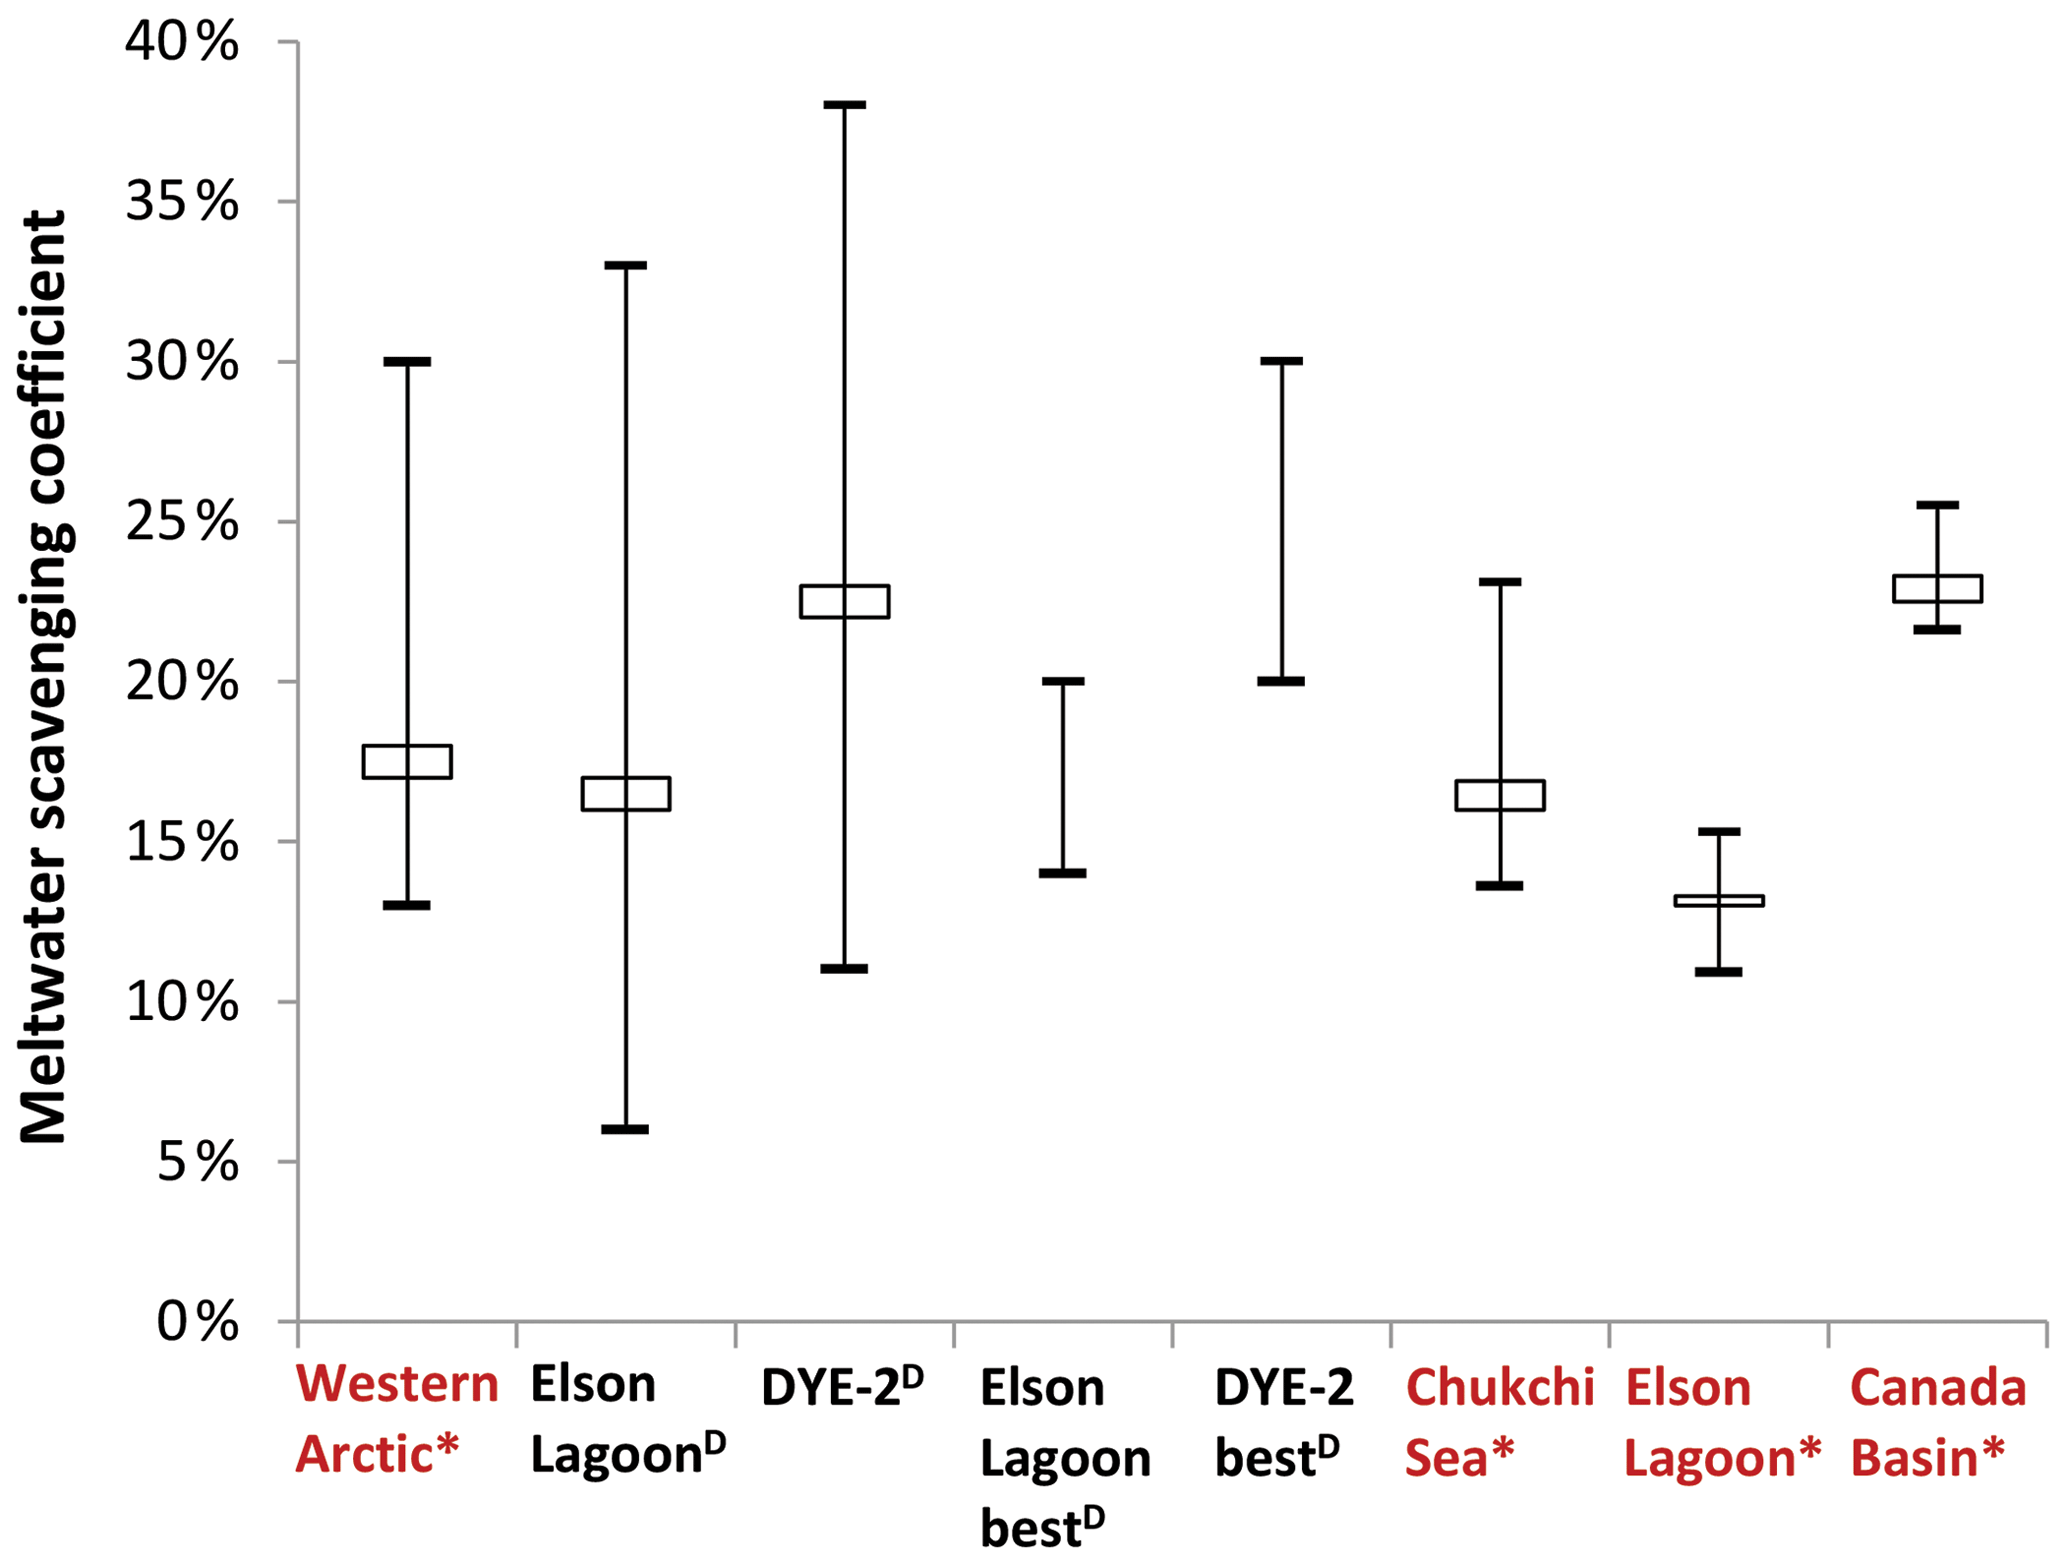
Figure 5MSC of BC in different regions over the western Arctic. Superscript “*” indicates the results of this study (red), and “D” indicates the results of Doherty et al. (2013). Elson Lagoon bestD and DYE-2 bestD indicate the best-estimated range of MSC, respectively, in Elson Lagoon and DYE-2, Greenland, published in Doherty et al. (2013). The values of the western Arctic were estimated based on the observations in all measurement regions, and the best-estimated values in DYE-2 and Elson Lagoon were employed in the estimation. The box shows the mean (upper) and median (bottom) values, and the whiskers depict the extent.
This study proposes a new method for large-scale measurements of MSC over the Arctic sea ice. The estimation of MSC requires the existence of a melt–refreeze ice layer. However, the limited data from our measurements cannot support a more extensive investigation. We reviewed the snow stratigraphy records obtained during the third Chinese Arctic Expedition in summer 2008 and the expedition hiking through the North Pole from 88 to 90∘ N in late spring 1995 (Xiao et al., 1997). The records show that the melt–refreeze ice layers were widely developing over high latitudes of the Arctic, which is also confirmed by the observations in Svalbard in late spring 2007–2009 (Eckerstorfer and Christiansen, 2011). The widely distributed melt–refreeze ice layer in the Arctic suggests broader applicability for this new method in estimating the MSC of BC in the Arctic, for example, along the cruise lines where it is not pragmatic to carry out long-term continuous sampling. Nevertheless, we need to note that a melt-season ice layer may not form in regions of intense melt, where we cannot obtain the MSC value using the proposed approach in this study.
This technique assumes that BC particles are not preferentially removed during meltwater freezing. We do not rule out that very few BC particles can still be discharged during this process. Thus, this assumption may result in an underestimation of the BC content in the meltwater, in turn leading to an underestimation of MSC. Besides, this method does not account for influxes of BC from snowfall during the melt season, which may also lead to an underestimation of MSC in the case of snowfall occurring after melt onset. The method provides an estimate of the average seasonal MSC but does not capture temporal variations efficiently.
The MSC of BC is much less than 100 % according to the few previous studies, leading to enhanced concentrations of BC in surface snow, lowering albedo and accelerating the rate of snowmelt. This study proposes a new experimental approach to determine the MSC by sampling the melt–refreeze ice layer and its overlying snow in the snow pits during the melting season, assuming the complete conservation of snow and BC content before and after the ablation event. The method is different from the established methods which require repeated sampling (RS method) over an extended period. The present observations confirm that the theory adopted in the proposed method is valid in the study area, and the estimation bias of the calculated MSCs is not dependent on the melting degree during the ablation.
Further estimation with the new method demonstrated that the MSC exhibits regional differences in the western Arctic. In the measurement period, the average MSC in the Canada Basin is the largest, which is close to that estimated in Greenland, followed by those in the Chukchi Sea and Elson Lagoon. The spatial difference is suggested to be considered in the future simulation of BC in snow over the sea ice, rather than setting MSC as a constant in the snow and sea ice model. Combined with all available observations, we estimated an average of MSC in the western Arctic of 18.0 %±3.8 % ranging from 13.0 % to 30.0 %.
The observations are shown in Table 1.
TD designed the experiments and performed the analyses. TD, ZD, SL, YZ, QZ, MH and CL conceived field measurements and snow sampling. All authors participated in the writing of the paper.
The authors declare that they have no conflict of interest.
We appreciate the State Key Laboratory of Cryosphere Science of the Chinese Academy of Sciences for the accommodation and ice logistics support during the visit in Utqiaġvik. We also thank UIC Corporation for providing the logistic support for the field measurements over sea ice.
This research has been supported by the National Key Research and Development Program of China (grant no. 2018YFC1406103), the National Natural Science Foundation of China (NSFC grant nos. 41971084 and 41425003) and the Strategic Priority Research Program of the Chinese Academy of Sciences (grant no. XDA19070103).
This paper was edited by John Yackel and reviewed by Howard Conway and one anonymous referee.
AMAP: The Impact of Black Carbon on Arctic Climate (2011), edited by: Quinn, P. K., Stohl, A., Arneth, A., Berntsen, T., Burkhart, J. F., Christensen, J., Flanner, M., Kupiainen, K., Lihavainen, H., Shepherd, M., Shevchenko, V., Skov, H., and Vestreng, V.: Arctic Monitoring and Assessment Programme (AMAP), Oslo, 72 pp., 2011.
Colbeck, S., Akitaya, E., Armostrong, R., Gubler, H., Lafeuille, J., and Morris, E.: The international classification for seasonal snow on the ground, International Hydrological Programme of the United Nations Educational, Scientific and Cultural Organization (UNESCO-IHP), Paris, in the series of IHP Technical Documents in Hydrology: IACS Contribution, 2009.
Conway, H., Gades, A., and Raymond, C. F.: Albedo of dirty snow during conditions of melt, Water Resour. Res., 32, 1713–1718, https://doi.org/10.1029/96WR00712, 1996.
Doherty, S. J., Grenfell, T. C., Forsström, S., Hegg, D. L., Brandt, R. E., and Warren, S. G.: Observed vertical redistribution of black carbon and other insoluble light-absorbing particles in melting snow, J. Geophys. Res.-Atmos., 118, 5553–5569, https://doi.org/10.1002/jgrd.50235, 2013.
Dou, T., Xiao, C., Shindell, D. T., Liu, J., Eleftheriadis, K., Ming, J., and Qin, D.: The distribution of snow black carbon observed in the Arctic and compared to the GISS-PUCCINI model, Atmos. Chem. Phys., 12, 7995–8007, https://doi.org/10.5194/acp-12-7995-2012, 2012.
Dou, T. and Xiao, C.: Measurements of physical characteristics of summer snow cover on sea ice during the Third Chinese Arctic Expedition, Sci. Cold Arid Reg., 5, 0309–0315, 2013.
Dou, T., Xiao, C., Du, Z., Schauer, J. J., Ren, H., Ge, B., Xie, A., Tan, J., Fu, P., and Zhang, Y.: Sources, evolution and impacts of EC and OC in snow on sea ice: a measurement study in Barrow, Alaska, Sci. Bull., 62, 1547–1554, 2017.
Eckerstorfer, M. and Christiansen, H. H.: The “High Arctic Maritime Snow Climate” in Central Svalbard, Arct. Antarct. Alp. Res., 43, 11–21, 2011.
Flanner, M. G., Zender, C. S., Randerson, J. T., and Rasch, P. J.: Present-day climate forcing and response fromblack carbon in snow, J. Geophys. Res., 112, D11202, https://doi.org/10.1029/2006JD008003, 2007.
Flanner, M. G., Zender, C. S., Hess, P. G., Mahowald, N. M., Painter, T. H., Ramanathan, V., and Rasch, P. J.: Springtime warming and reduced snow cover from carbonaceous particles, Atmos. Chem. Phys., 9, 2481–2497, https://doi.org/10.5194/acp-9-2481-2009, 2009.
Forsström, S., Isaksson, E., Skeie, R. B., Ström, J., Pedersen, C. A., Hudson, S. R., Berntsen, T. K., Lihavainen, H., Godtliebsen, F., and Gerland S.: Elemental carbon measurements in European Arctic snow packs, J. Geophys. Res.-Atmos., 118, 13614–13627, 2013.
Goldenson, N., Doherty, S. J., Bitz, C. M., Holland, M. M., Light, B., and Conley, A. J.: Arctic climate response to forcing from light-absorbing particles in snow and sea ice in CESM, Atmos. Chem. Phys., 12, 7903–7920, https://doi.org/10.5194/acp-12-7903-2012, 2012.
Holland, M., Bailey, D. A., Briegleb, B. P., Light, B., and Hunke, E.: Improved sea ice shortwave radiation physics in CCSM4: The impact of melt ponds and aerosols on Arctic sea ice, J. Climate, 25, 1413–1430, https://doi.org/10.1175/JCLI-D-11-00078.1, 2012.
Jiao, C., Flanner, M. G., Balkanski, Y., Bauer, S. E., Bellouin, N., Berntsen, T. K., Bian, H., Carslaw, K. S., Chin, M., De Luca, N., Diehl, T., Ghan, S. J., Iversen, T., Kirkevåg, A., Koch, D., Liu, X., Mann, G. W., Penner, J. E., Pitari, G., Schulz, M., Seland, Ø., Skeie, R. B., Steenrod, S. D., Stier, P., Takemura, T., Tsigaridis, K., van Noije, T., Yun, Y., and Zhang, K.: An AeroCom assessment of black carbon in Arctic snow and sea ice, Atmos. Chem. Phys., 14, 2399–2417, https://doi.org/10.5194/acp-14-2399-2014, 2014.
Korhonen, H., Carslaw, K. S., Spracklen, D. V., Ridley, D. A., and Ström, J.: A global model study of processes controlling aerosol size distributions in the Arctic spring and summer, J. Geophys. Res., 113, D08211, https://doi.org/10.1029/2007JD009114, 2008.
Langlois, A., Johnson, C. A., Montpetit, B., Royer, A., Blukacz-Richards, E.A., Neave, E., Dolant, C., Roy, A., Arhonditsis, G., Kim, D.-K., Kaluskar, S., and Brucker, L.: Detection of rain-on-snow (ROS) events and ice layer formation using passive microwave radiometry: A context for Peary caribou habitat in the Canadian Arctic, Remote Sens. Environ. 189, 84–95, 2017.
Massom, R. A., Eicken, H., Haas, C., Jeffries, M. O., Drinkwater, M. R., Sturm, M., Worby, A. P., Wu, X., Lytle, V. I., Ushio, S., Morris, K., Reid, P. A., Warren, S. G., and Allison, I.: Snow on Antarctic sea ice, Rev. Geophys., 39, 413–445, 2001.
Novotny, V. and Krenkel, P. A.: Water Quality: Diffuse Pollution and Watershed Management, 2nd Edition, Hoboken, NJ: J. Wiley, c2003, 2002.
Pfeffer, W. T. and Humphrey, N. F.: Formation of ice layers by infiltration and refreezing of meltwater, Ann. Glaciol., 26, 83–91, 1998.
Schulz, H., Zanatta, M., Bozem, H., Leaitch, W. R., Herber, A. B., Burkart, J., Willis, M. D., Kunkel, D., Hoor, P. M., Abbatt, J. P. D., and Gerdes, R.: High Arctic aircraft measurements characterising black carbon vertical variability in spring and summer, Atmos. Chem. Phys., 19, 2361–2384, https://doi.org/10.5194/acp-19-2361-2019, 2019.
Sharma, S., Ishizawa, M., Chan, D., Lavoué, D. Andrews, E., Eleftheriadis, K., and Maksyutov, S.: 16-year simulation of Arctic black carbon: Transport, source contribution, and sensitivity analysis on deposition, J. Geophys. Res.-Atmos., 118, 943–964, 2013.
Sturm, M., Holmgren, J., and Perovich, D. K.: Winter snow cover on the sea ice of the Arctic Ocean at the Surface Heat Budget of the Arctic Ocean (SHEBA): Temporal evolution and spatial variability, J. Geophys. Res., 107, 8047, https://doi.org/10.1029/2000JC000400, 2002.
Xiao, C., Qin, D., and Ren, J.: The feature of sea ice cover, snow distribution and its densification in the central Arctic, Sci. Geol. Sinica, 17, 289–296, 1997.
Xu, B., Cao, J., Joswiak, D. R., Liu, X., Zhao, H., and He, J.: Postdepositional enrichment of black soot in snow-pack and accelerated melting of Tibetan glaciers, Environ. Res. Lett., 7, 014022, https://doi.org/10.1088/1748-9326/7/014022, 2012.