the Creative Commons Attribution 4.0 License.
the Creative Commons Attribution 4.0 License.
 | 05 Feb 2020
Soil moisture and hydrology projections of the permafrost region – a model intercomparison
David M. Lawrence
Cathy J. Wilson
A. David McGuire
Charles Koven
Kevin Schaefer
Elchin Jafarov
Shushi Peng
Xiaodong Chen
Isabelle Gouttevin
Eleanor Burke
Sarah Chadburn
Duoying Ji
Guangsheng Chen
Daniel Hayes
Wenxin Zhang
This study investigates and compares soil moisture and hydrology projections of broadly used land models with permafrost processes and highlights the causes and impacts of permafrost zone soil moisture projections. Climate models project warmer temperatures and increases in precipitation (P) which will intensify evapotranspiration (ET) and runoff in land models. However, this study shows that most models project a long-term drying of the surface soil (0–20 cm) for the permafrost region despite increases in the net air–surface water flux (P-ET). Drying is generally explained by infiltration of moisture to deeper soil layers as the active layer deepens or permafrost thaws completely. Although most models agree on drying, the projections vary strongly in magnitude and spatial pattern. Land models tend to agree with decadal runoff trends but underestimate runoff volume when compared to gauge data across the major Arctic river basins, potentially indicating model structural limitations. Coordinated efforts to address the ongoing challenges presented in this study will help reduce uncertainty in our capability to predict the future Arctic hydrological state and associated land–atmosphere biogeochemical processes across spatial and temporal scales.


Hydrology plays a fundamental role in permafrost landscapes by modulating complex interactions among biogeochemical cycling (Frey and Mcclelland, 2009; Newman et al., 2015; Throckmorton et al., 2015), geomorphology (Grosse et al., 2013; Kanevskiy et al., 2017; Lara et al., 2015; Liljedahl et al., 2016), and ecosystem structure and function (Andresen et al., 2017; Avis et al., 2011; Oberbauer et al., 2007). Permafrost has a strong influence on hydrology by controlling surface and subsurface distribution and the storage, drainage and routing of water. Permafrost prevents vertical water flow, which often leads to saturated soil conditions in continuous permafrost while confining subsurface flow through perennially unfrozen zones (a.k.a. taliks) in discontinuous permafrost (Jafarov et al., 2018; Walvoord and Kurylyk, 2016). However, with the observed (Streletskiy et al., 2008) and predicted (Slater and Lawrence, 2013) thawing of permafrost, there is a large uncertainty in the future hydrological state of permafrost landscapes and in the associated responses such as the permafrost carbon–climate feedback.
The timing and magnitude of the permafrost carbon–climate feedback is, in part, governed by changes in surface hydrology, through the regulation by soil moisture of the form of carbon emissions from thawing labile soils and microbial decomposition as either CO2 or CH4 (Koven et al., 2015; Schädel et al., 2016; Schaefer et al., 2011). The impact of soil moisture changes on the permafrost carbon feedback could be significant. Lawrence et al. (2015) found that the impact of the soil drying projected in simulations with the Community Land Model decreased the overall global warming potential of the permafrost carbon–climate feedback by 50 %. This decrease was attributed to a much slower increase in CH4 emissions if surface soils dry, which is partially compensated for by a stronger increase in CO2 emissions under drier soil conditions.
Earth system models project an intensification of the hydrological cycle characterized by a general increase in the magnitude of water fluxes (e.g., precipitation, evapotranspiration and runoff) in northern latitudes (Rawlins et al., 2010; Swenson et al., 2012). In addition, intensification of the hydrological cycle is likely to modify the spatial and temporal patterns of water in the landscape. However, the spatial variability, timing and reasons for future changes in hydrology in terrestrial landscapes in the Arctic are unclear, and variability in projections of these features by current terrestrial hydrology applied in the Arctic has not been well documented. Therefore, there is an urgent need to assess and better understand hydrology simulations in land models and how differences in process representation affect projections of permafrost landscapes.
Upgrades in permafrost representation such as freeze and thaw processes in the land component of Earth system models have improved understanding of the evolution of hydrology in high northern latitudes. Particularly, soil thermal dynamics and active-layer hydrology upgrades include the effects of unfrozen water on phase change, insulation by snow (Peng et al., 2016), organic soils (Jafarov and Schaefer, 2016; Lawrence et al., 2008) and the hydraulic properties of frozen soils (Swenson et al., 2012). Nonetheless, large discrepancies in projections remain as the current generation of models substantially differ in soil thermal dynamics (e.g., Peng et al., 2016; Wang et al., 2016). In particular, variability among current models' simulations of the impact of permafrost thaw on soil water and hydrological states is not well documented. Therefore, in this study we analyze the output of a collection of widely used permafrost-enabled land models. These models participated in the Permafrost Carbon Network Model Intercomparison Project (PCN-MIP; McGuire et al., 2018, 2016) and contained the state-of-the-art representations of soil thermal dynamics in high latitudes at that time. In particular, we assess how changes in active-layer thickness and permafrost thaw influence near-surface soil moisture and hydrology projections under climate change. In addition, we provide comments on the main gaps and challenges in permafrost hydrology simulations and highlight the potential implications for the permafrost carbon–climate feedback.
2.1 Models and simulation protocol
This study assesses a collection of terrestrial simulations from models that participated in the PCN-MIP (McGuire et al., 2018, 2016; Table 1). The analysis presented here is unique as it focuses on the hydrological component of these models. Table 2 describes the main hydrological characteristics for each model. Additional details on participating models regarding soil thermal properties, snow, soil carbon and forcing trends can be found in previous PCN-MIP studies (e.g., McGuire et al., 2016; Koven et al., 2015; Wang et al., 2016; Peng et al., 2016). It is important to note that the versions of the models presented in this study are from McGuire et al. (2016, 2018) and some additional improvements to individual models may have been made since then.
The simulation protocol is described in detail in McGuire et al. (2016, 2018). In brief, models' simulations were conducted from 1960 to 2299, partitioned by historic (1960–2009) and future simulations (2010–2299), where future simulations were forced with a common projected climate derived from a fully coupled climate model simulation (CCSM4; Gent et al., 2011). Historic atmospheric forcing datasets (Table 1; e.g., climate, atmospheric CO2, N deposition and disturbance) and spin-up time were specific to each modeling group. The horizontal resolution (0.5–1.25∘) and soil hydrological column configurations (depths ranging from 2 to 47 m and 3 to 30 soil layers) also vary across models (Fig. 1). We focus on results from simulations forced with climate and CO2 from the Representative Concentration Pathway (RCP) 8.5 scenario, which represents unmitigated, business-as-usual emissions of greenhouse gases. Future simulations were calculated from monthly CCSM4 (Gent et al., 2011) climate anomalies for the Representative Concentration Pathway (RCP 8.5, 2006–2100) and the Extension Concentration Pathway (ECP 8.5, 2101–2299) scenarios, relative to repeating (1996–2005) forcing atmospheric datasets from the different modeling groups (Table 1).
The PCN model intercomparison uses the output from a single Earth system model climate projection and was motivated by a desire to keep the experimental design simple and computationally tractable. Clearly, using just one climate projection does not allow us to explore the impact of the broad range of potential climate outcomes that are seen across the CMIP5 (Coupled Model Intercomparison Project Phase 5) models. Instead, the PCN suite of simulations allows for a relatively controlled analysis of the spread of model responses to a single representative climate trajectory. The selection of CCSM4 as the climate projection model was motivated partly by convenience and also because it was one of the only models that had been run out to the year 2300 at the time of the PCN experiments. Further, as noted in McGuire et al. (2018), CCSM4 late 20th-century climate biases in the Arctic were among the lowest across the CMIP5 model archive. It should be noted that the use of a single climate projection means that the results presented here should be viewed as indicative of just one possible permafrost hydrologic trajectory. As we will show, even under this single climate trajectory, the range of hydrologic responses in the models is broad, indicating high structural uncertainty across models with respect to this particular aspect of the Arctic system response to global climate change.
2.2 Permafrost and hydrology variables analyzed
Our analysis focused on the permafrost regions in the Northern Hemisphere north of 45∘ N. This qualitative hydrology comparison was based on the full permafrost domain for each model rather than a common subset among models in order to fully portray the overall changes in permafrost hydrology for participating models. For each model, we define a grid cell as containing near-surface permafrost based on soil temperature where the annual monthly maximum active-layer thickness (ALT) is at or less than the 3 m depth layer depending on the model soil configuration (Fig. 1; McGuire et al., 2016; Slater and Lawrence, 2013). We calculated the depth of maximum ALT by identifying the underlying annual permafrost table depth of continuous monthly temperatures <273.15 K in the top 3 m or equivalent soil layer depth (Fig. 1). Models with a soil configuration at 3 m or less (UWVIC, CoLM, JULES and TEM; see Table 1 for descriptions of the models referenced in this paper) follow the same calculation with an exemption for their bottom depth, where a soil depth temperature threshold of <273.5 K was applied to be considered as permafrost; this was based on soil temperature trends observed for models with soil depths greater than 3 m and allows models to have an ALT of 3 m when soil configuration is limiting. We assessed how permafrost changes affect near-surface soil moisture, defined here as the soil water content (kg m−2) of the 0–20 cm soil layer. We focused on the top 20 cm of the soil column due to its relevance to near-surface biogeochemical processes. We added the weighted fractions for each depth interval to calculate near-surface soil moisture (0–20 cm) to account for the differences in the vertical resolution of the soil grid cells among models (Fig. 1). To better understand the causes and consequences of changes in soil moisture, we examined several principal hydrology variables including evapotranspiration (ET), runoff (R; surface and subsurface), and precipitation (P; snow and rain). Representation of ET, R and soil hydrology varies across participating models and is summarized in Table 2.
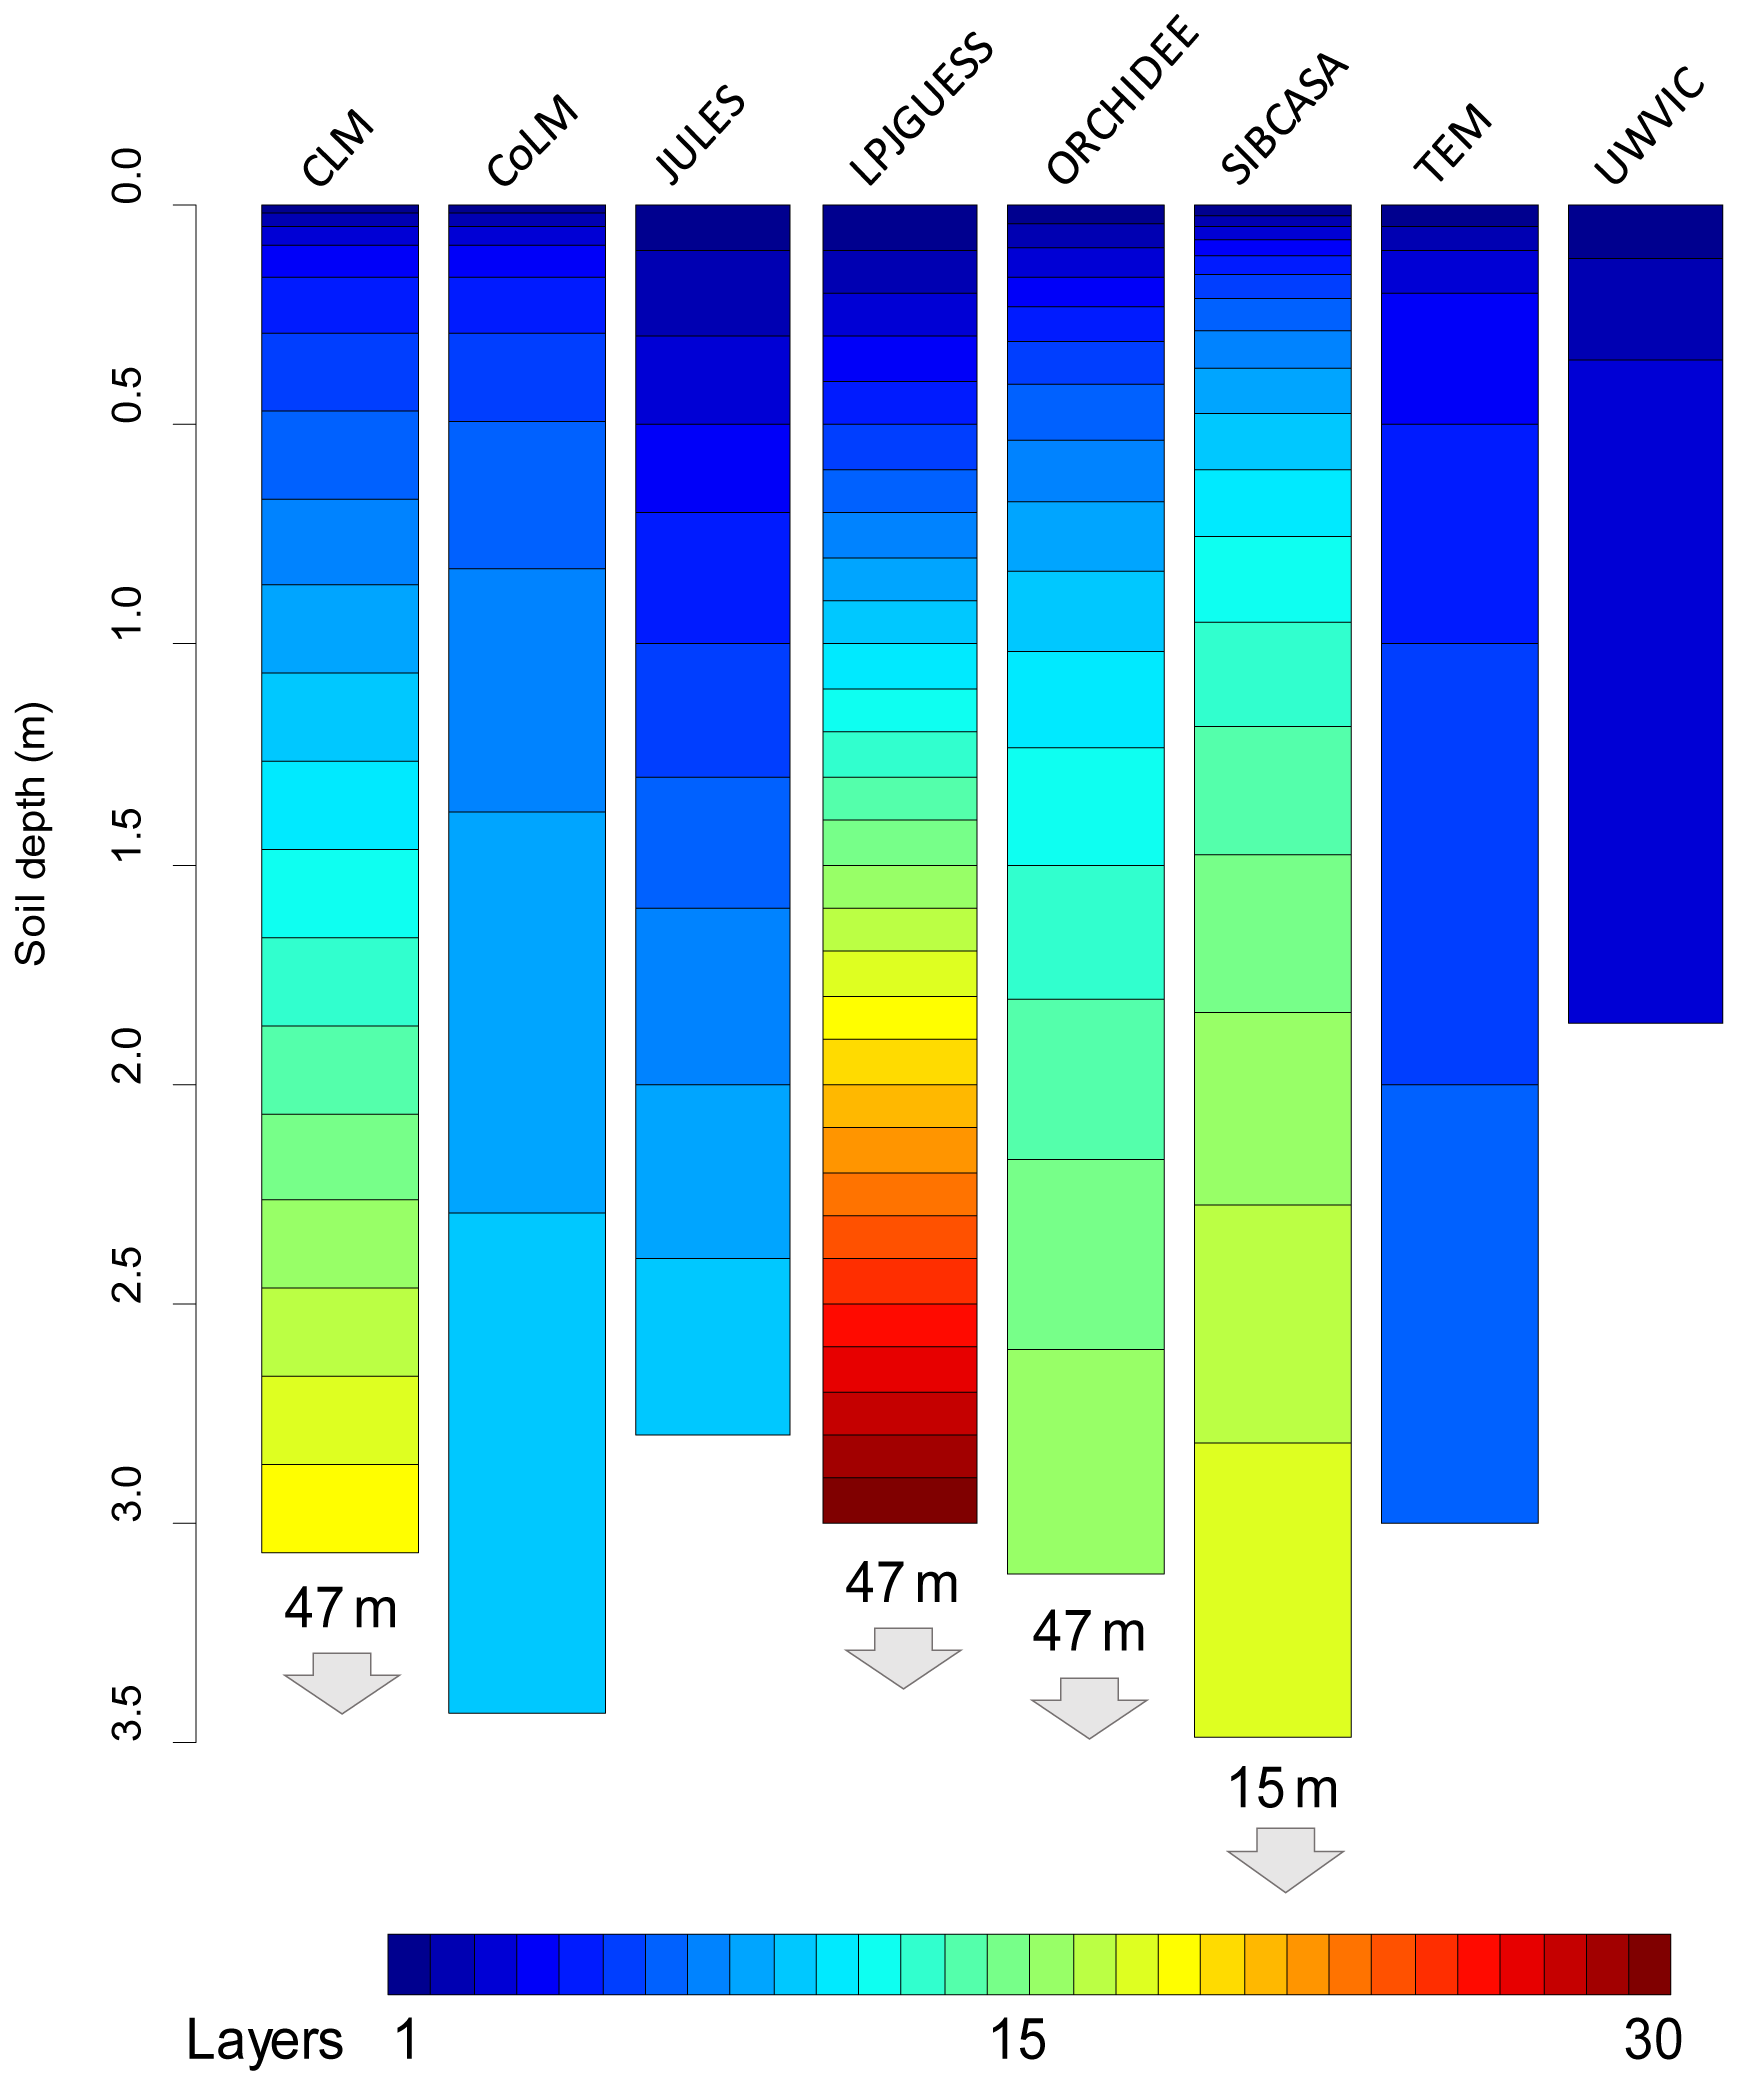
Figure 1Soil hydrologically active column configuration for each participating model. Numbers and arrows indicate full soil configuration of nonhydrologically active bedrock layers. Colors represent the number of layers.
Table 1Model descriptions and driving datasets.
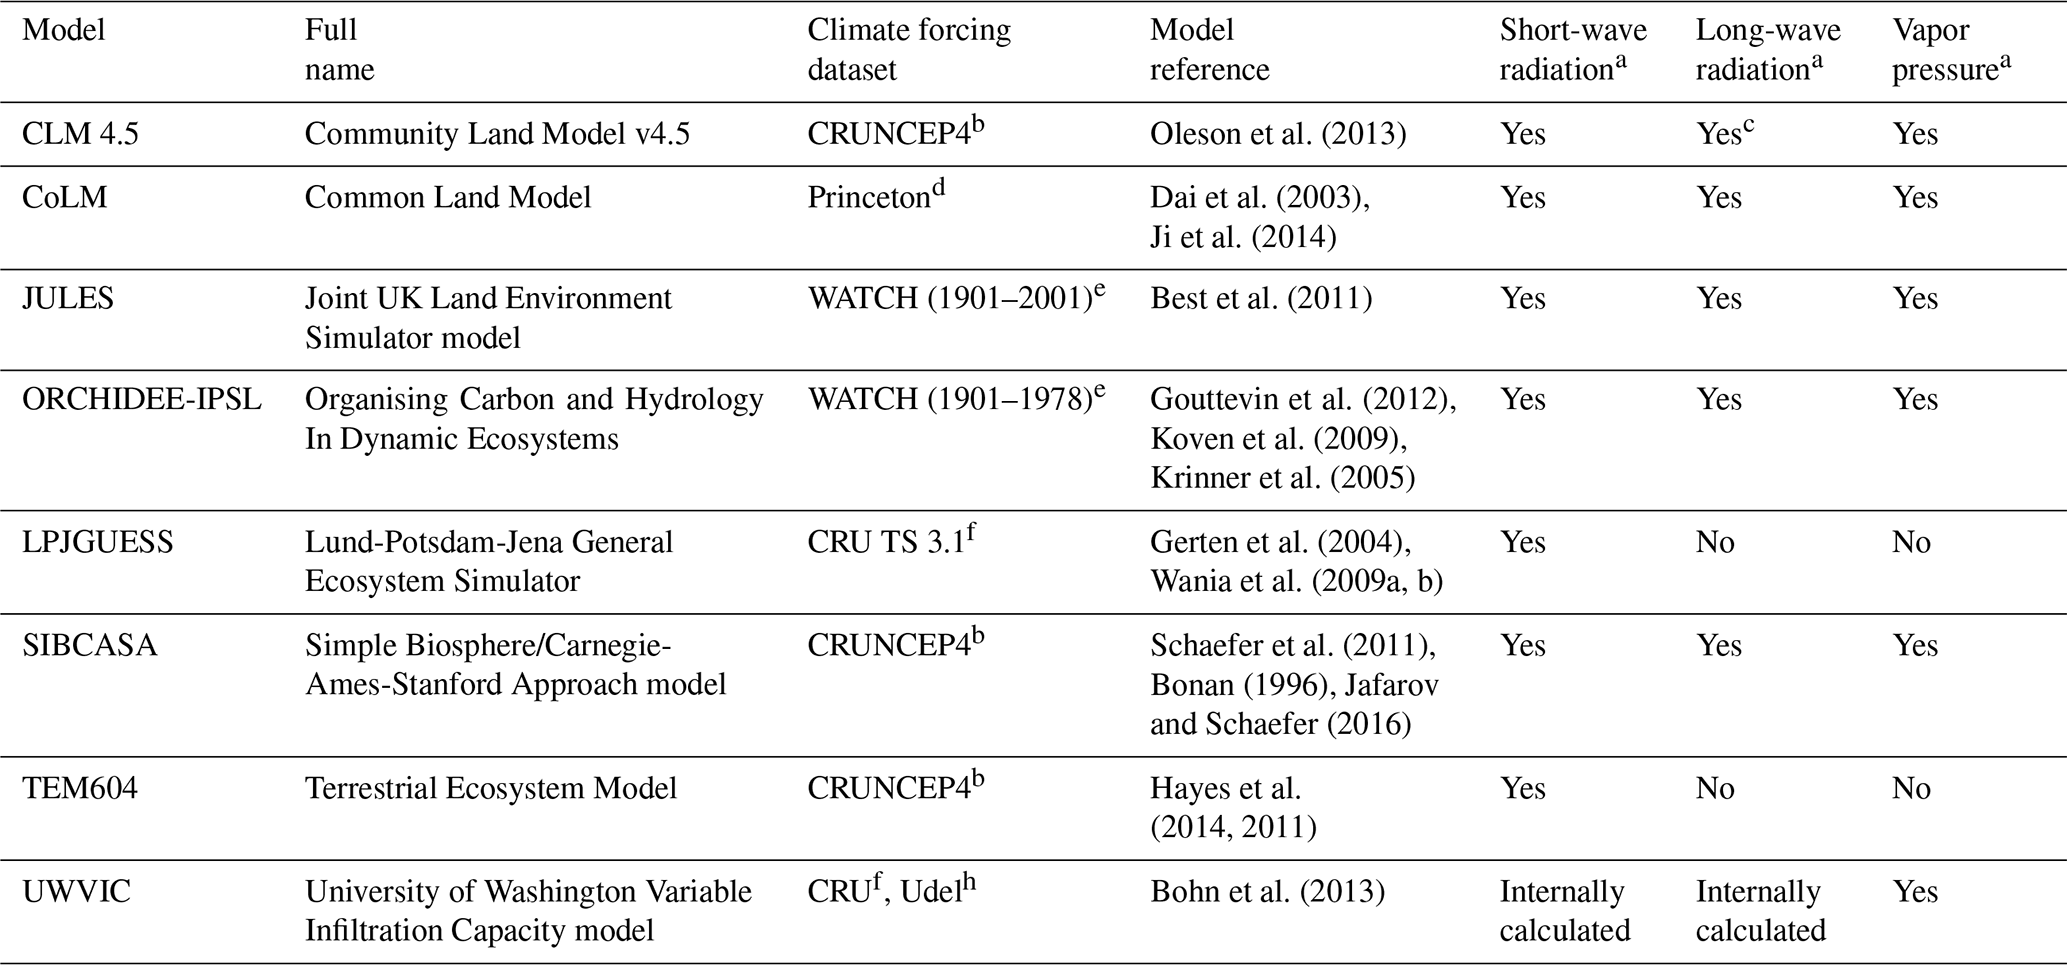
a Simulations driven by temporal variability. b Viovy and Ciais (http://dods.extra.cea.fr/, last access: 13 March 2016). c Long-wave dataset not from CRUNCEPT4.
d Sheffield et al. (2006) (http://hydrology.princeton.edu/data.pgf.php, last access: 13 March 2016).
e http://www.eu-watch.org/gfx_content/documents/README-WFDEI.pdf (last access: 13 March 2016). f Harris et al. (2014). g Mitchell and Jones (2005) for temperature.
h Willmott and Matsuura (2001) for wind speed and precipitation with corrections (see Bohn et al., 2013).
We compared model simulations with long-term (1970–1999) mean monthly discharge data from Dai et al. (2009). We computed model total annual discharge (sum of surface and subsurface runoff) for the main river basins in the permafrost region of North America (Mackenzie, Yukon) and Russia (Yenisey, Lena). In particular, we compared (i) annual runoff anomalies, (ii) correlation coefficients, and (iii) distributions of annual discharge between gauge data and models' simulations for the 30-year period of 1970–1999. Gauge stations from major permafrost river basins used for simulation comparison include (i) Arctic Red, Canada (67.46∘ N, 133.74∘ W), for Mackenzie River; (ii) Pilot Station, Alaska (61.93∘ N 162.88∘ W), for Yukon River; (iii) Igarka, Russia (67.43∘ N, 86.48∘ E), for Yenisey River; and (iv) Kusur, Russia (70.68∘ N, 127.39∘ E), for Lena River.
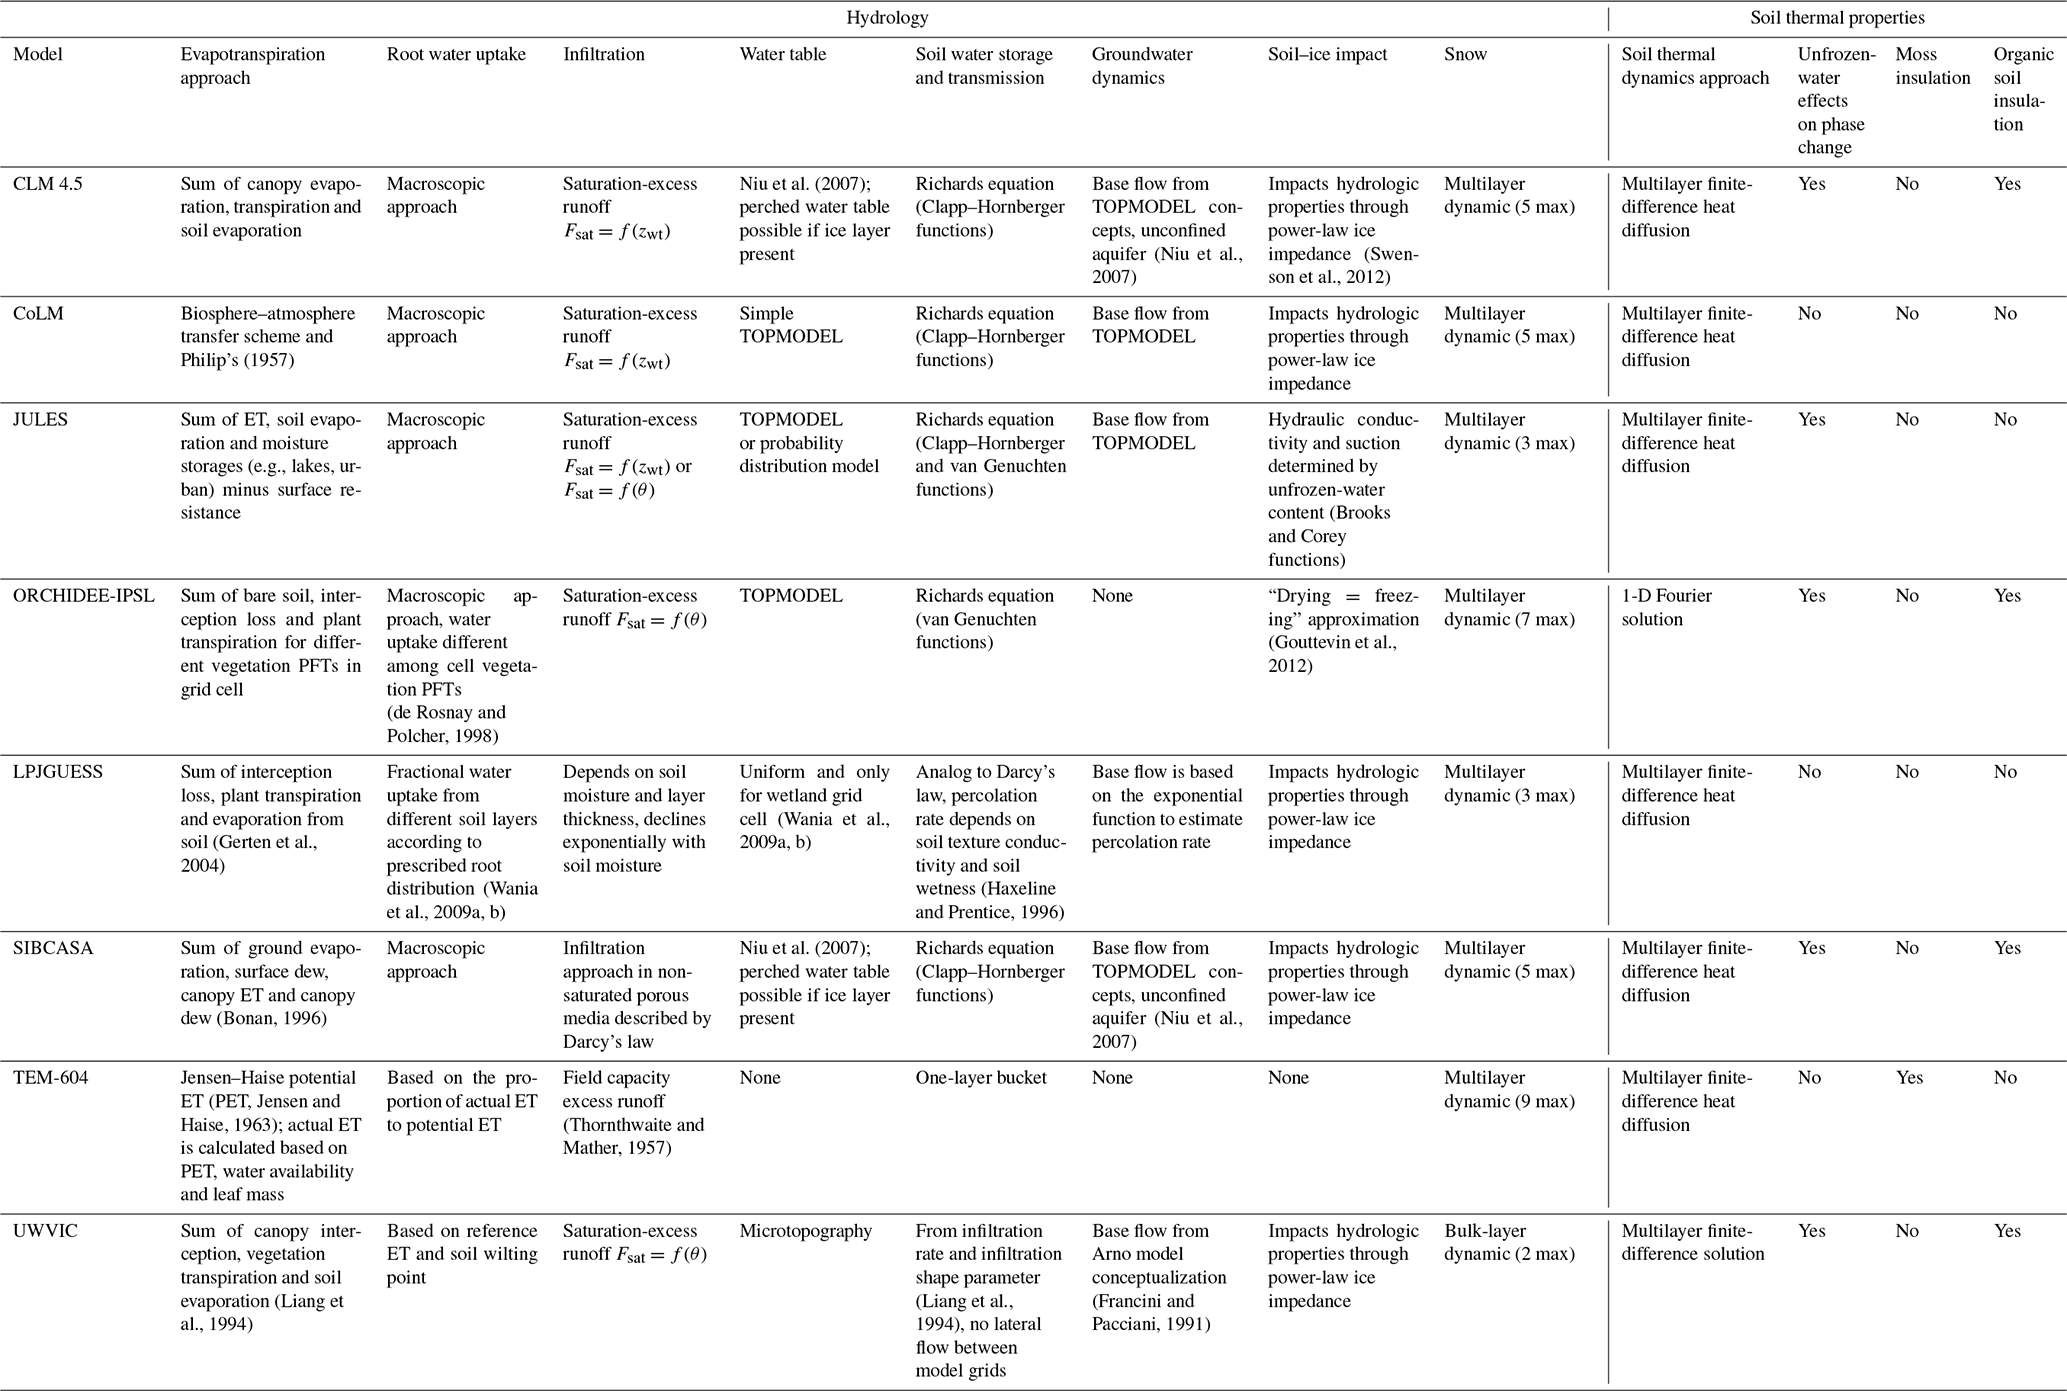
Table 2Hydrology and soil thermal characteristics of participating models.
3.1 Soil moisture
Air temperature forcing from greenhouse-gas emissions shows an increase of ∼15 ∘C in the permafrost domain over the simulation period (Fig. 2a). With increases in air temperature, models project an ensemble mean decrease of ∼13 000 000 km2 (91 %) of the permafrost domain by 2299 (Fig. 2b). Coincident with these changes, most models projected a long-term drying of the near-surface soils when averaged over the permafrost landscape (Fig. 2c). However, the simulations diverged greatly with respect to both the permafrost-domain average soil moisture response and their associated spatial patterns (Figs. 2c, 3). The models' ensemble mean indicated a change of −10 % in near-surface soil moisture for the permafrost region by the year 2299, but the spread across models was large. CoLM and LPJGUESS simulate an increase in soil moisture of 10 % and 48 %, respectively. CLM, JULES, TEM and UWVIC exhibit qualitatively similar decreasing trends in soil moisture ranging between −5 % and −20 %. SIBCASA and ORCHIDEE projected a large soil moisture change of approximately −50 % by 2299. Spatially, models show diverse wetting and drying patterns and magnitudes across the permafrost zone (Fig. 3). Several models tend to get wetter in the colder northern permafrost zones and are more susceptible to drying along the southern permafrost margin. Other models, such as TEM and UWVIC, show the opposite pattern with drying more common in the northern part of the permafrost domain.
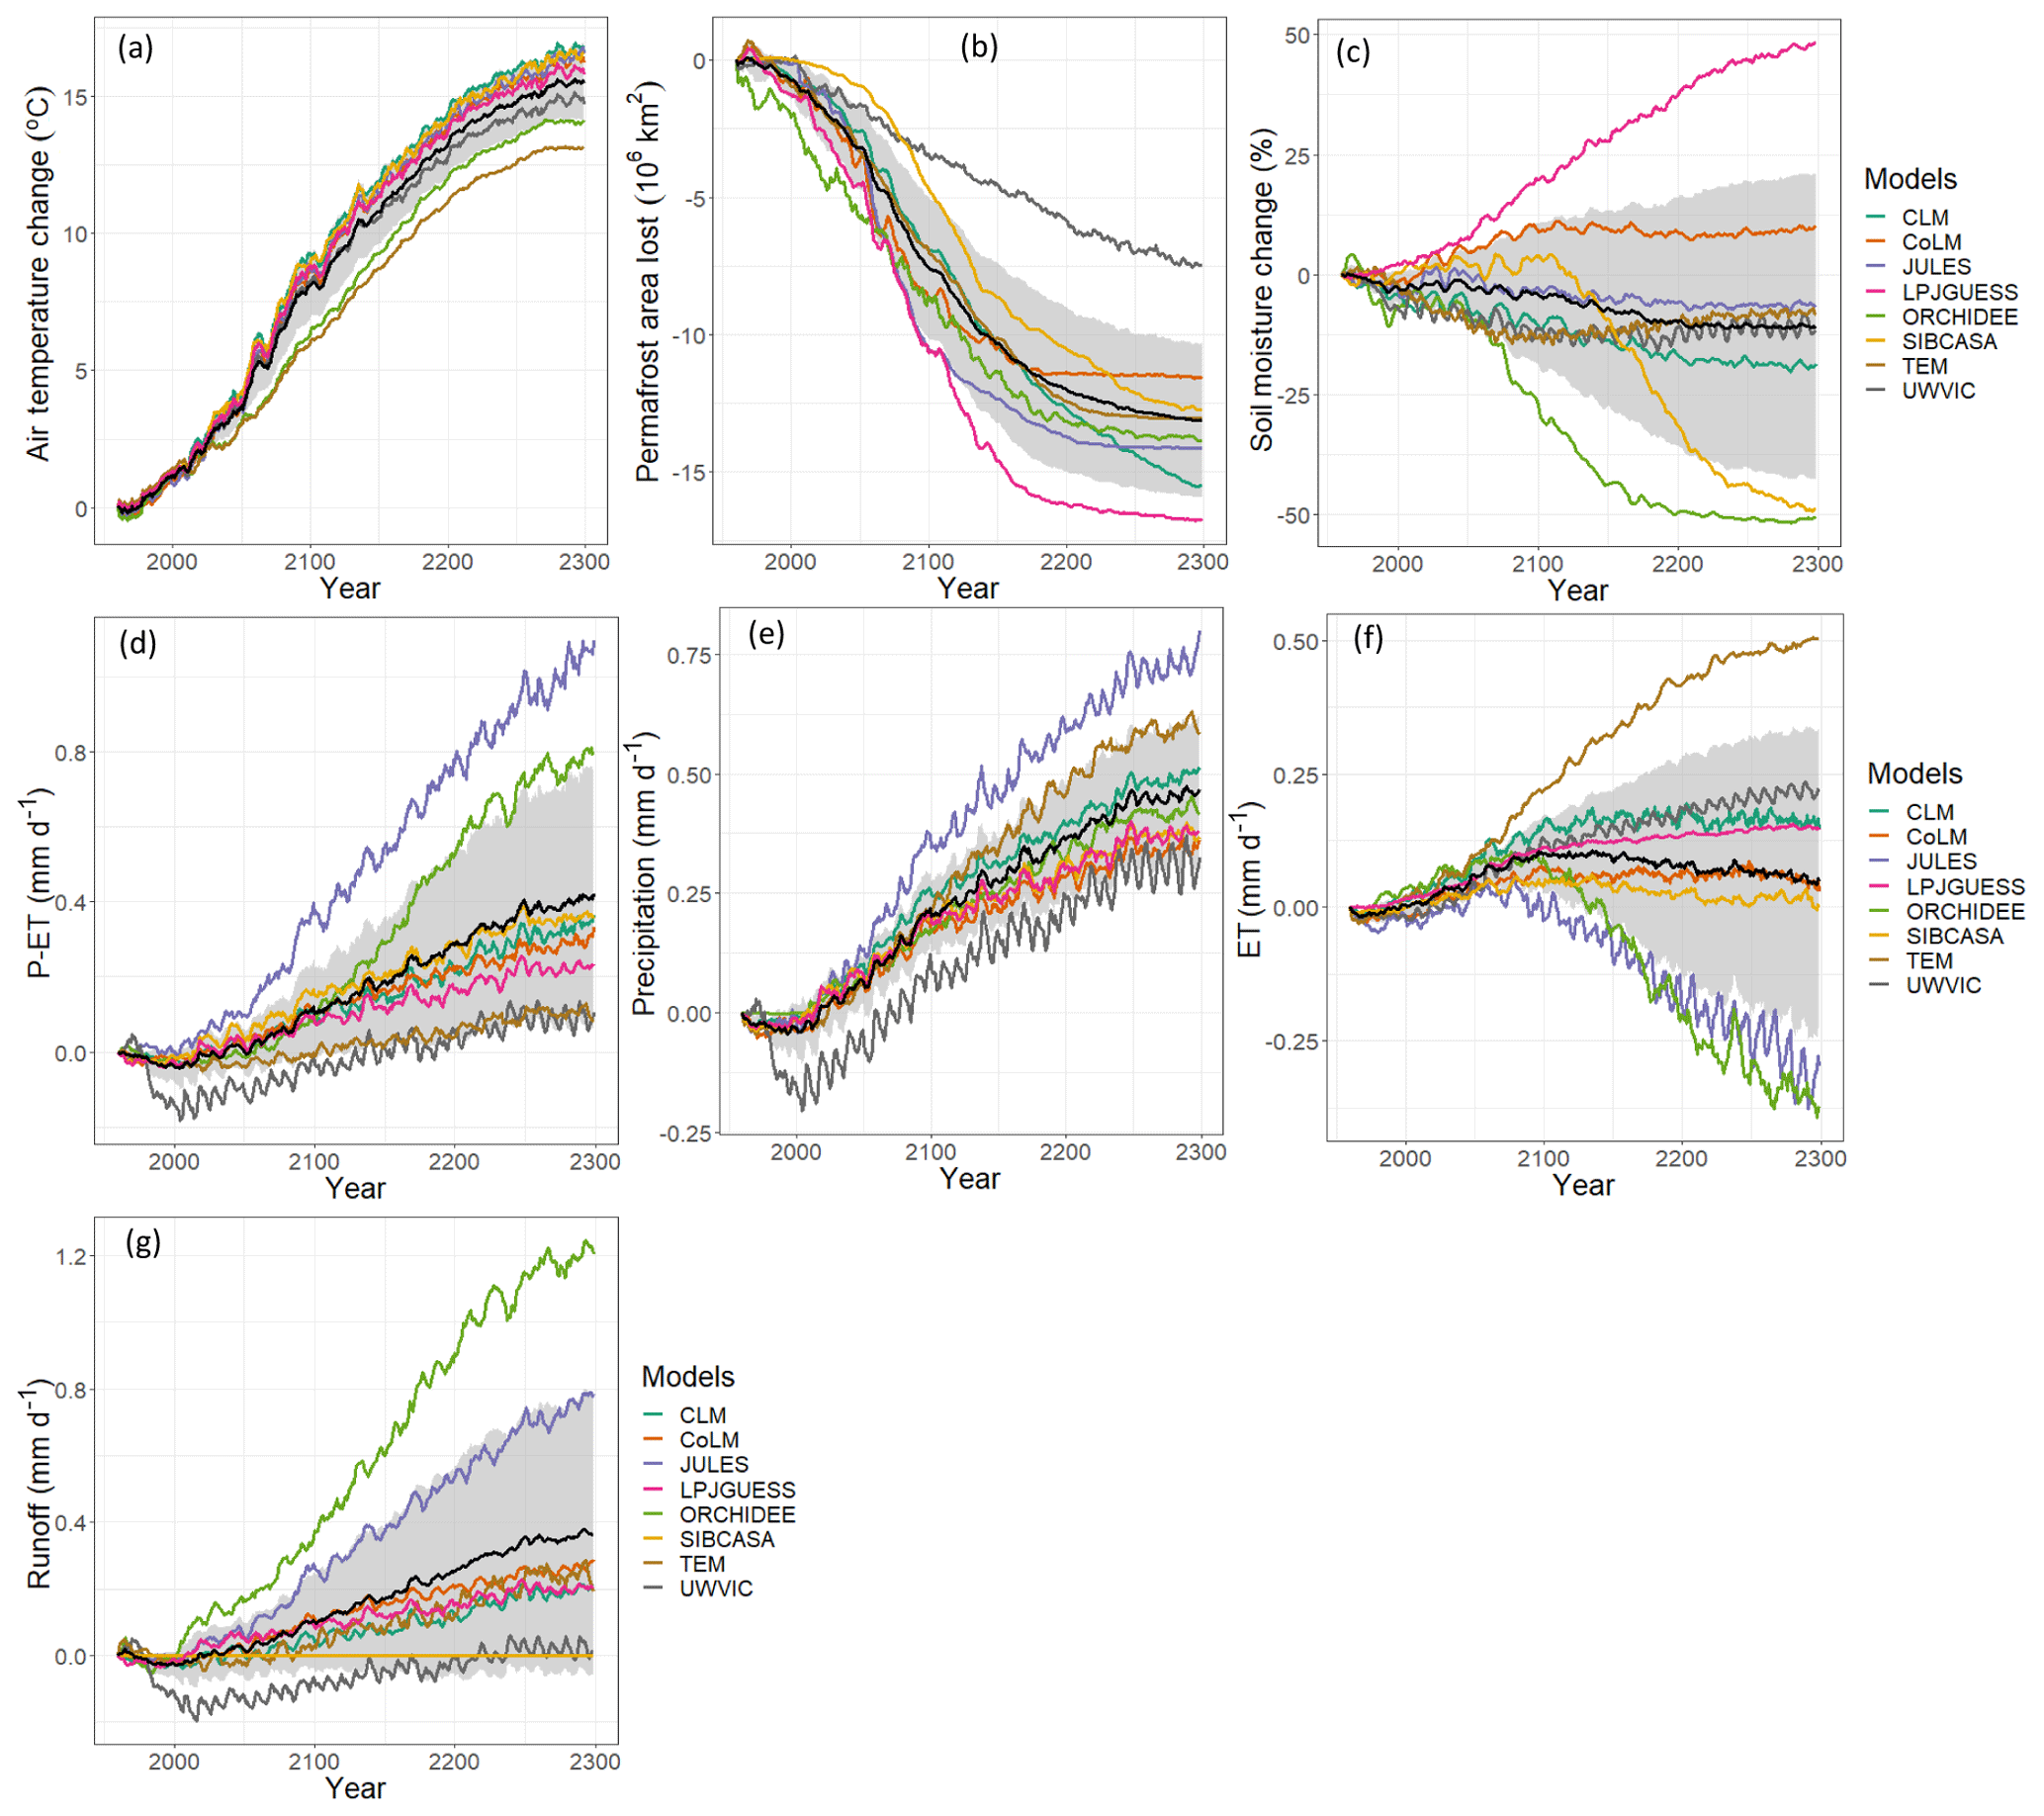
Figure 2Simulated annual mean changes in air temperature, near-surface permafrost area, near-surface soil moisture and hydrology variables relative to 1960 (RCP 8.5). Annual mean is computed from monthly output values. The black line represents the models' ensemble mean, and the gray area is the ensemble standard deviation. Panels (d), (e), (f), and (g) are represented as change from 1960 values. Time series are smoothed with a 7-year running mean for clarity and calculated over the initial permafrost domain of each model in 1960 for latitude >45∘ N.

Figure 3Spatial variability of projected changes in surface soil moisture (%) among models. Depicted changes are calculated as the difference between the 2071 to 2100 average and the 1960 to 1989 average. Colored area represents the initial simulated permafrost domain of 1960 for each model.
3.2 Drivers of soil moisture change
To understand why models projected upper soil drying despite increases in the net precipitation (P-ET) into the soil, we examined whether or not increases in active-layer thickness (ALT) and/or the complete thaw of near-surface permafrost could be related to surface soil drying of the top 0–20 cm ALT. We observed a general significant negative correlation in most models (except SIBCASA and LPJGUESS) where cells with greater increases in active-layer thickness have greater drying (decrease) in near-surface soil moisture (Fig. 4). However, there is a large spread between soil moisture and ALT changes (Fig. 4). This spread may be influenced by many interacting factors that can be difficult to assess directly and are out of the scope of this study. In addition, the coarse soil column discretization in UWVIC limited this analysis for this model (Fig. 1). However, most models show some indication that as the active layer deepens, soils tend to get drier at the surface.

Figure 4Responses of August near-surface (0–20 cm) soil moisture to ALT changes. Each box represents a range of ±0.25 m of ALT change. ALT and soil moisture change are calculated as the 2270–2299 average minus the 1960–1989 average for cells in the initial permafrost domain of 1960. For cells where ALT exceeded 3 m (no permafrost) during the 2270–2299 period, we subtracted the initial active-layer thickness (1960–1989 average) to 3 m. Population Pearson correlations (r) significant at and .
3.3 Precipitation, ET and runoff
Models may project surface soil drying, but the hydrological pathways through which this drying occurs appear to differ across models. The diversity of precipitation partitioning (Fig. 5) demonstrates that specific representations and parameterizations for ET and runoff are not consistent across models. Though some models maintain a similar R∕P ratio throughout the simulation (e.g., CLM, CoLM, LPJGUESS), others show shifts from an ET-dominated system to a runoff-dominated system (e.g., JULES) and vice versa (e.g., TEM and UWVIC).
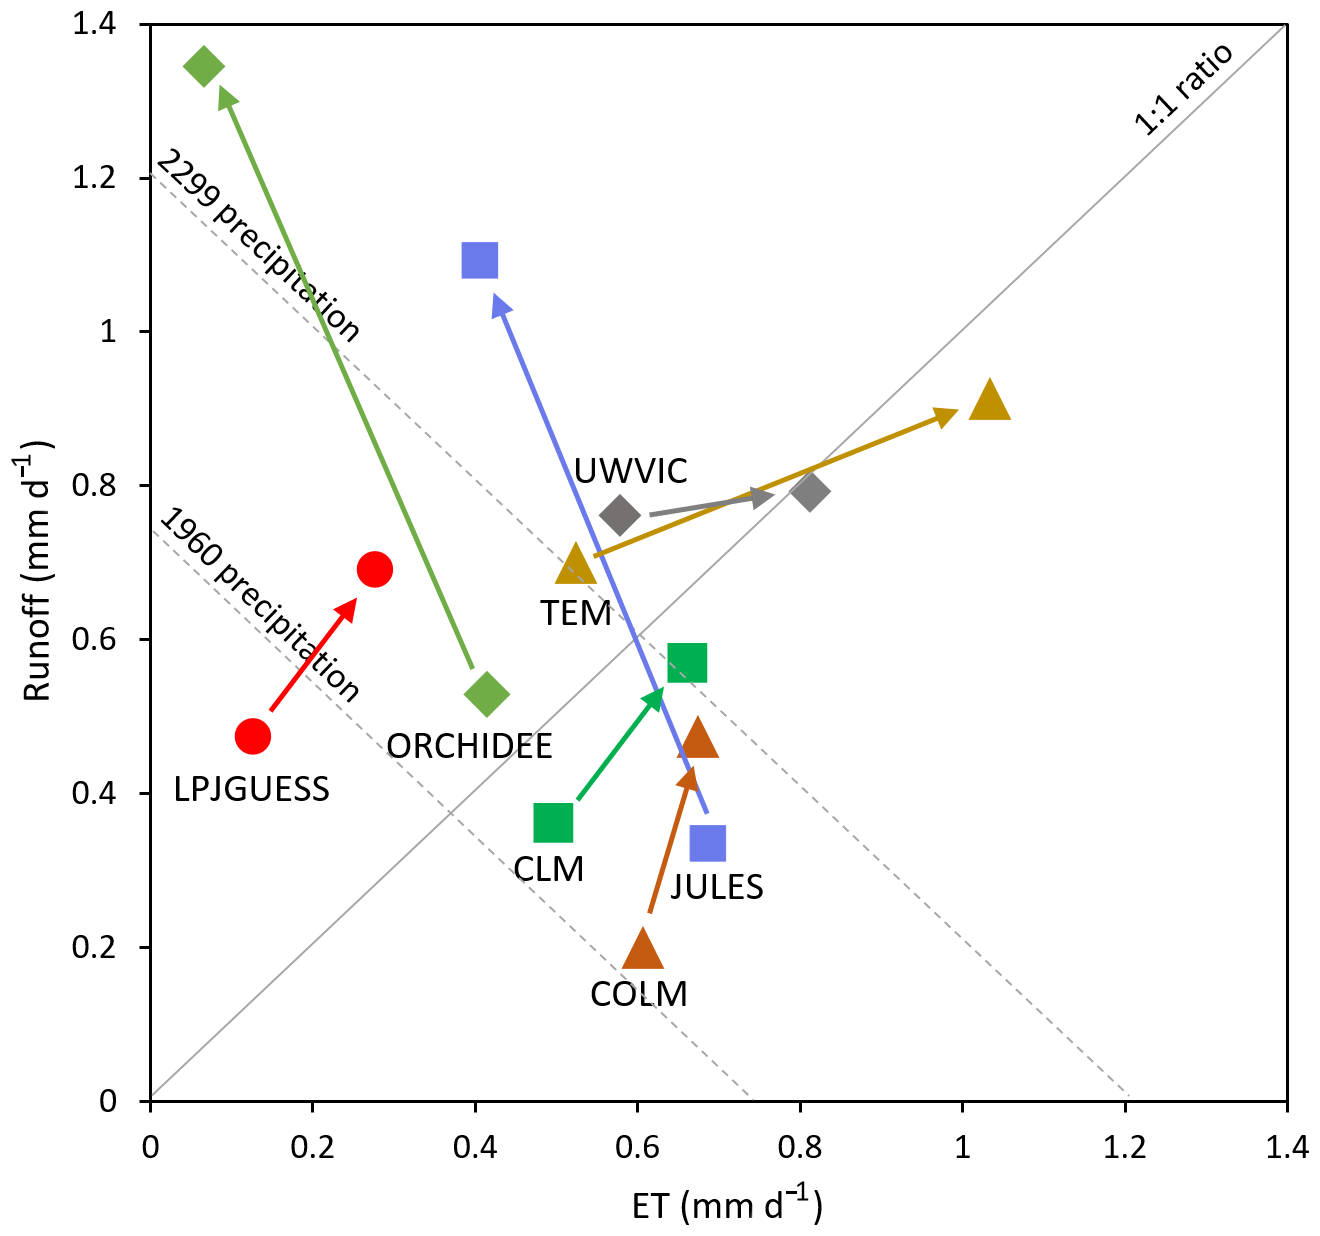
Figure 5Precipitation partitioning between total runoff and evapotranspiration for participating models. Markers and arrows indicate the change from initial period (1960–1989 average) to final period (2270–2299 average). Diagonal dashed lines represent the ensemble rainfall mean for the initial (0.74 mm d−1) and final (1.2 mm d−1) simulation years. At any point along the dashed diagonals, runoff and ET sum to precipitation.
Evapotranspiration from the permafrost area is projected to rise in all models driven by warmer air temperatures and more productive vegetation, but the amplitude of that trend varies widely. The average projected evapotranspiration increase is 0.1±0.1 mm d−1 (mean ±SD hereafter) by 2100, which represents about a 25 % increase over 20th-century levels. Beyond 2100, the ET projections diverge (Fig. 2e).
Runoff is also projected to increase with projections across models being highly variable (Fig. 2g). The change in the models' ensemble mean between 1960 and 2299 was 0.2±0.2 mm d−1. CLM, CoLM, LPJGUESS and TEM simulated runoff changes of 0.2 to 0.3 mm d−1 by 2299. UWVIC exhibits small to null changes in runoff while SIBCASA shows surface runoff only.
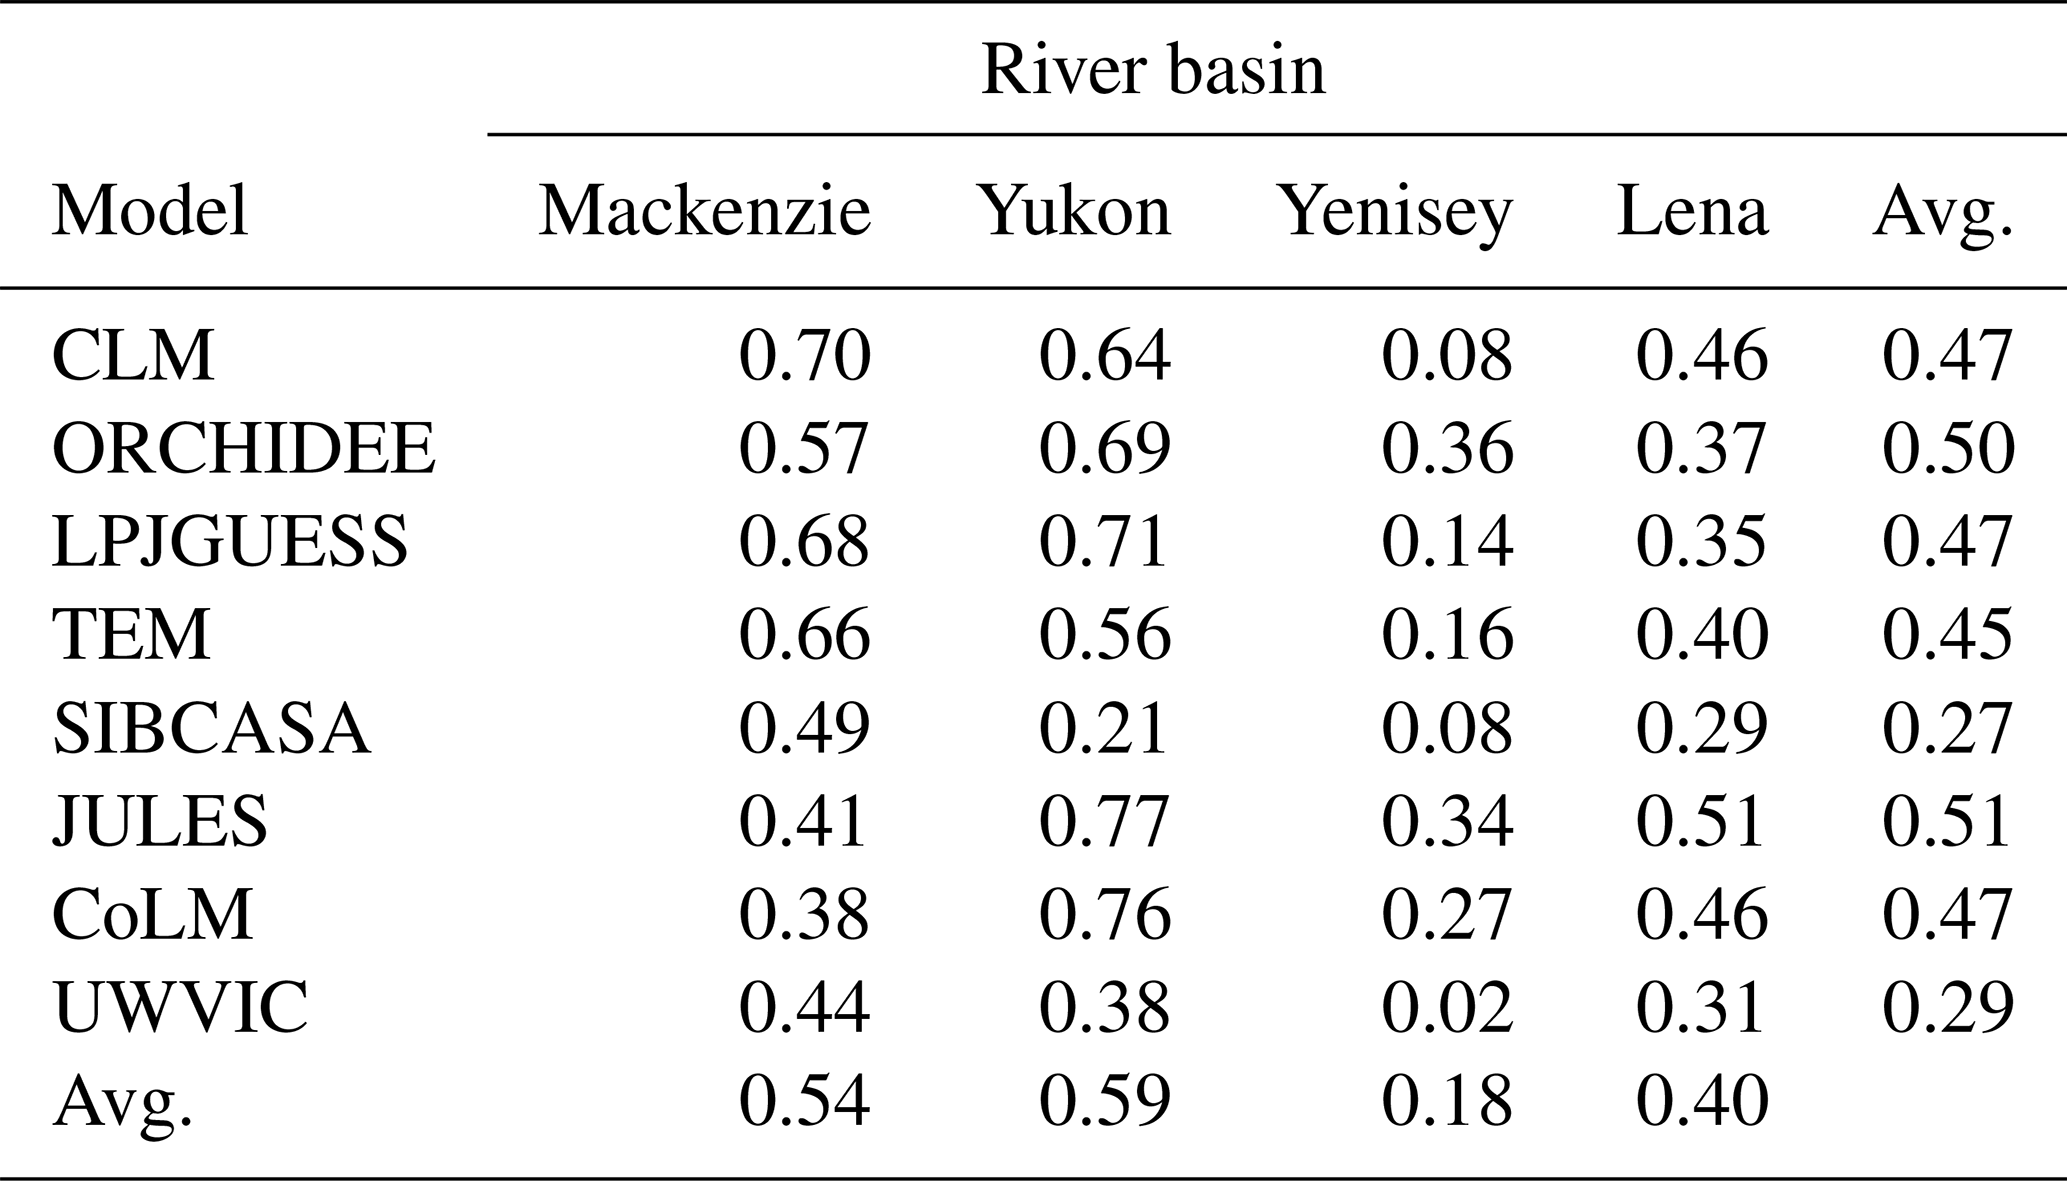
Comparison between gauge station data and runoff simulations from the major river basins in the permafrost region shows that most models agree on the long-term timing (Fig. 6, Table 3), but the magnitude is generally underestimated (Fig. 7). The gauge discharge mean for the four river basins is 219±36 mm yr−1 compared to the models' ensemble mean of 101±82 mm yr−1 for the period 1970–1999. Excluding SIBCASA, the models' ensemble mean is 134±69 mm yr−1. However, models show reasonable correlations between runoff output and observed annual-discharge time series (Table 3). SIBCASA horizontal subsurface runoff was disabled on the simulation because it tended to drain the active layer completely, resulting in very low and unrealistic soil moisture. Therefore, SIBCASA runoff values shown in this study are only for surface runoff.
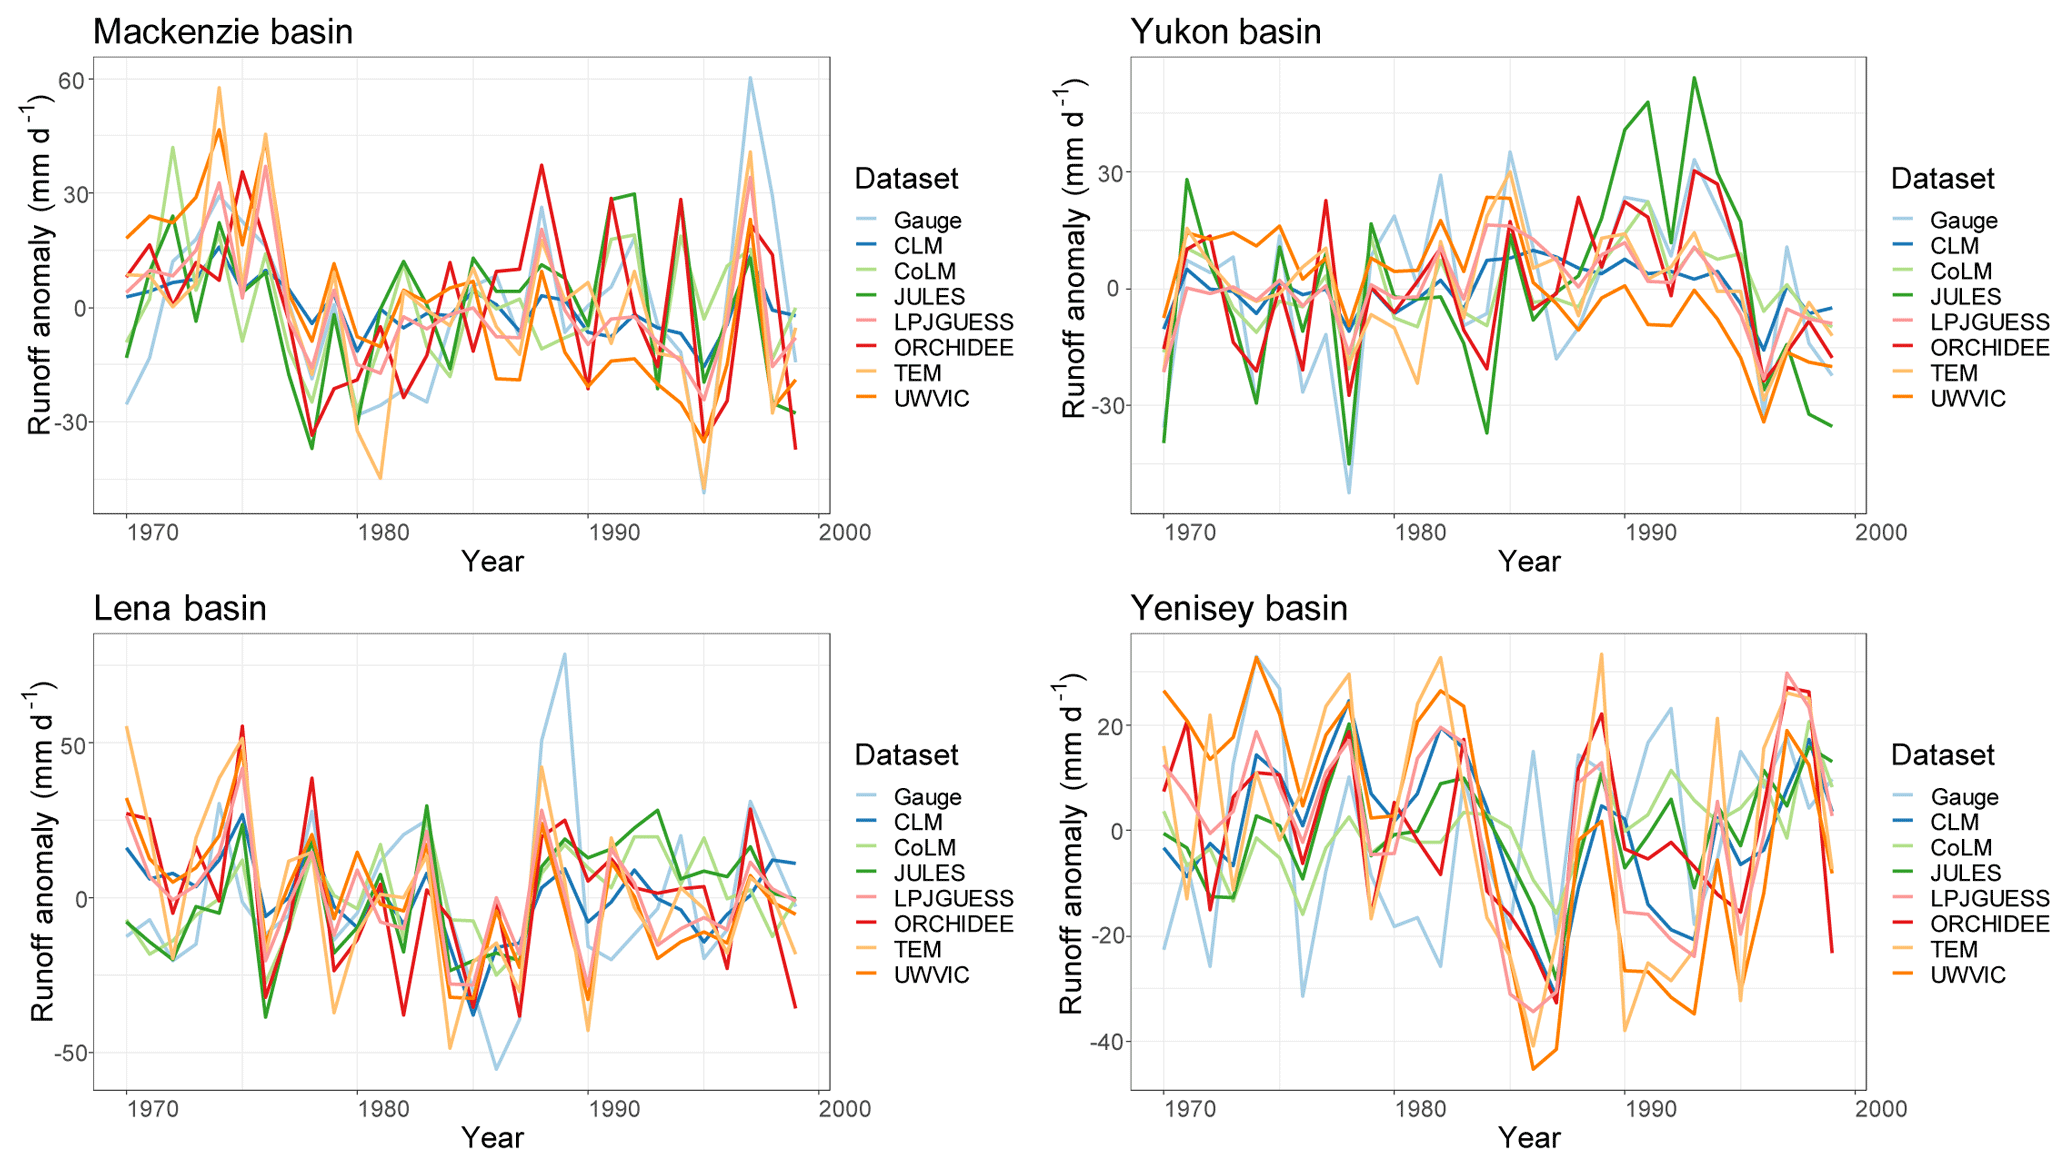
Figure 6Runoff anomaly comparison between gauge data and models simulations for the period 1970–1999.
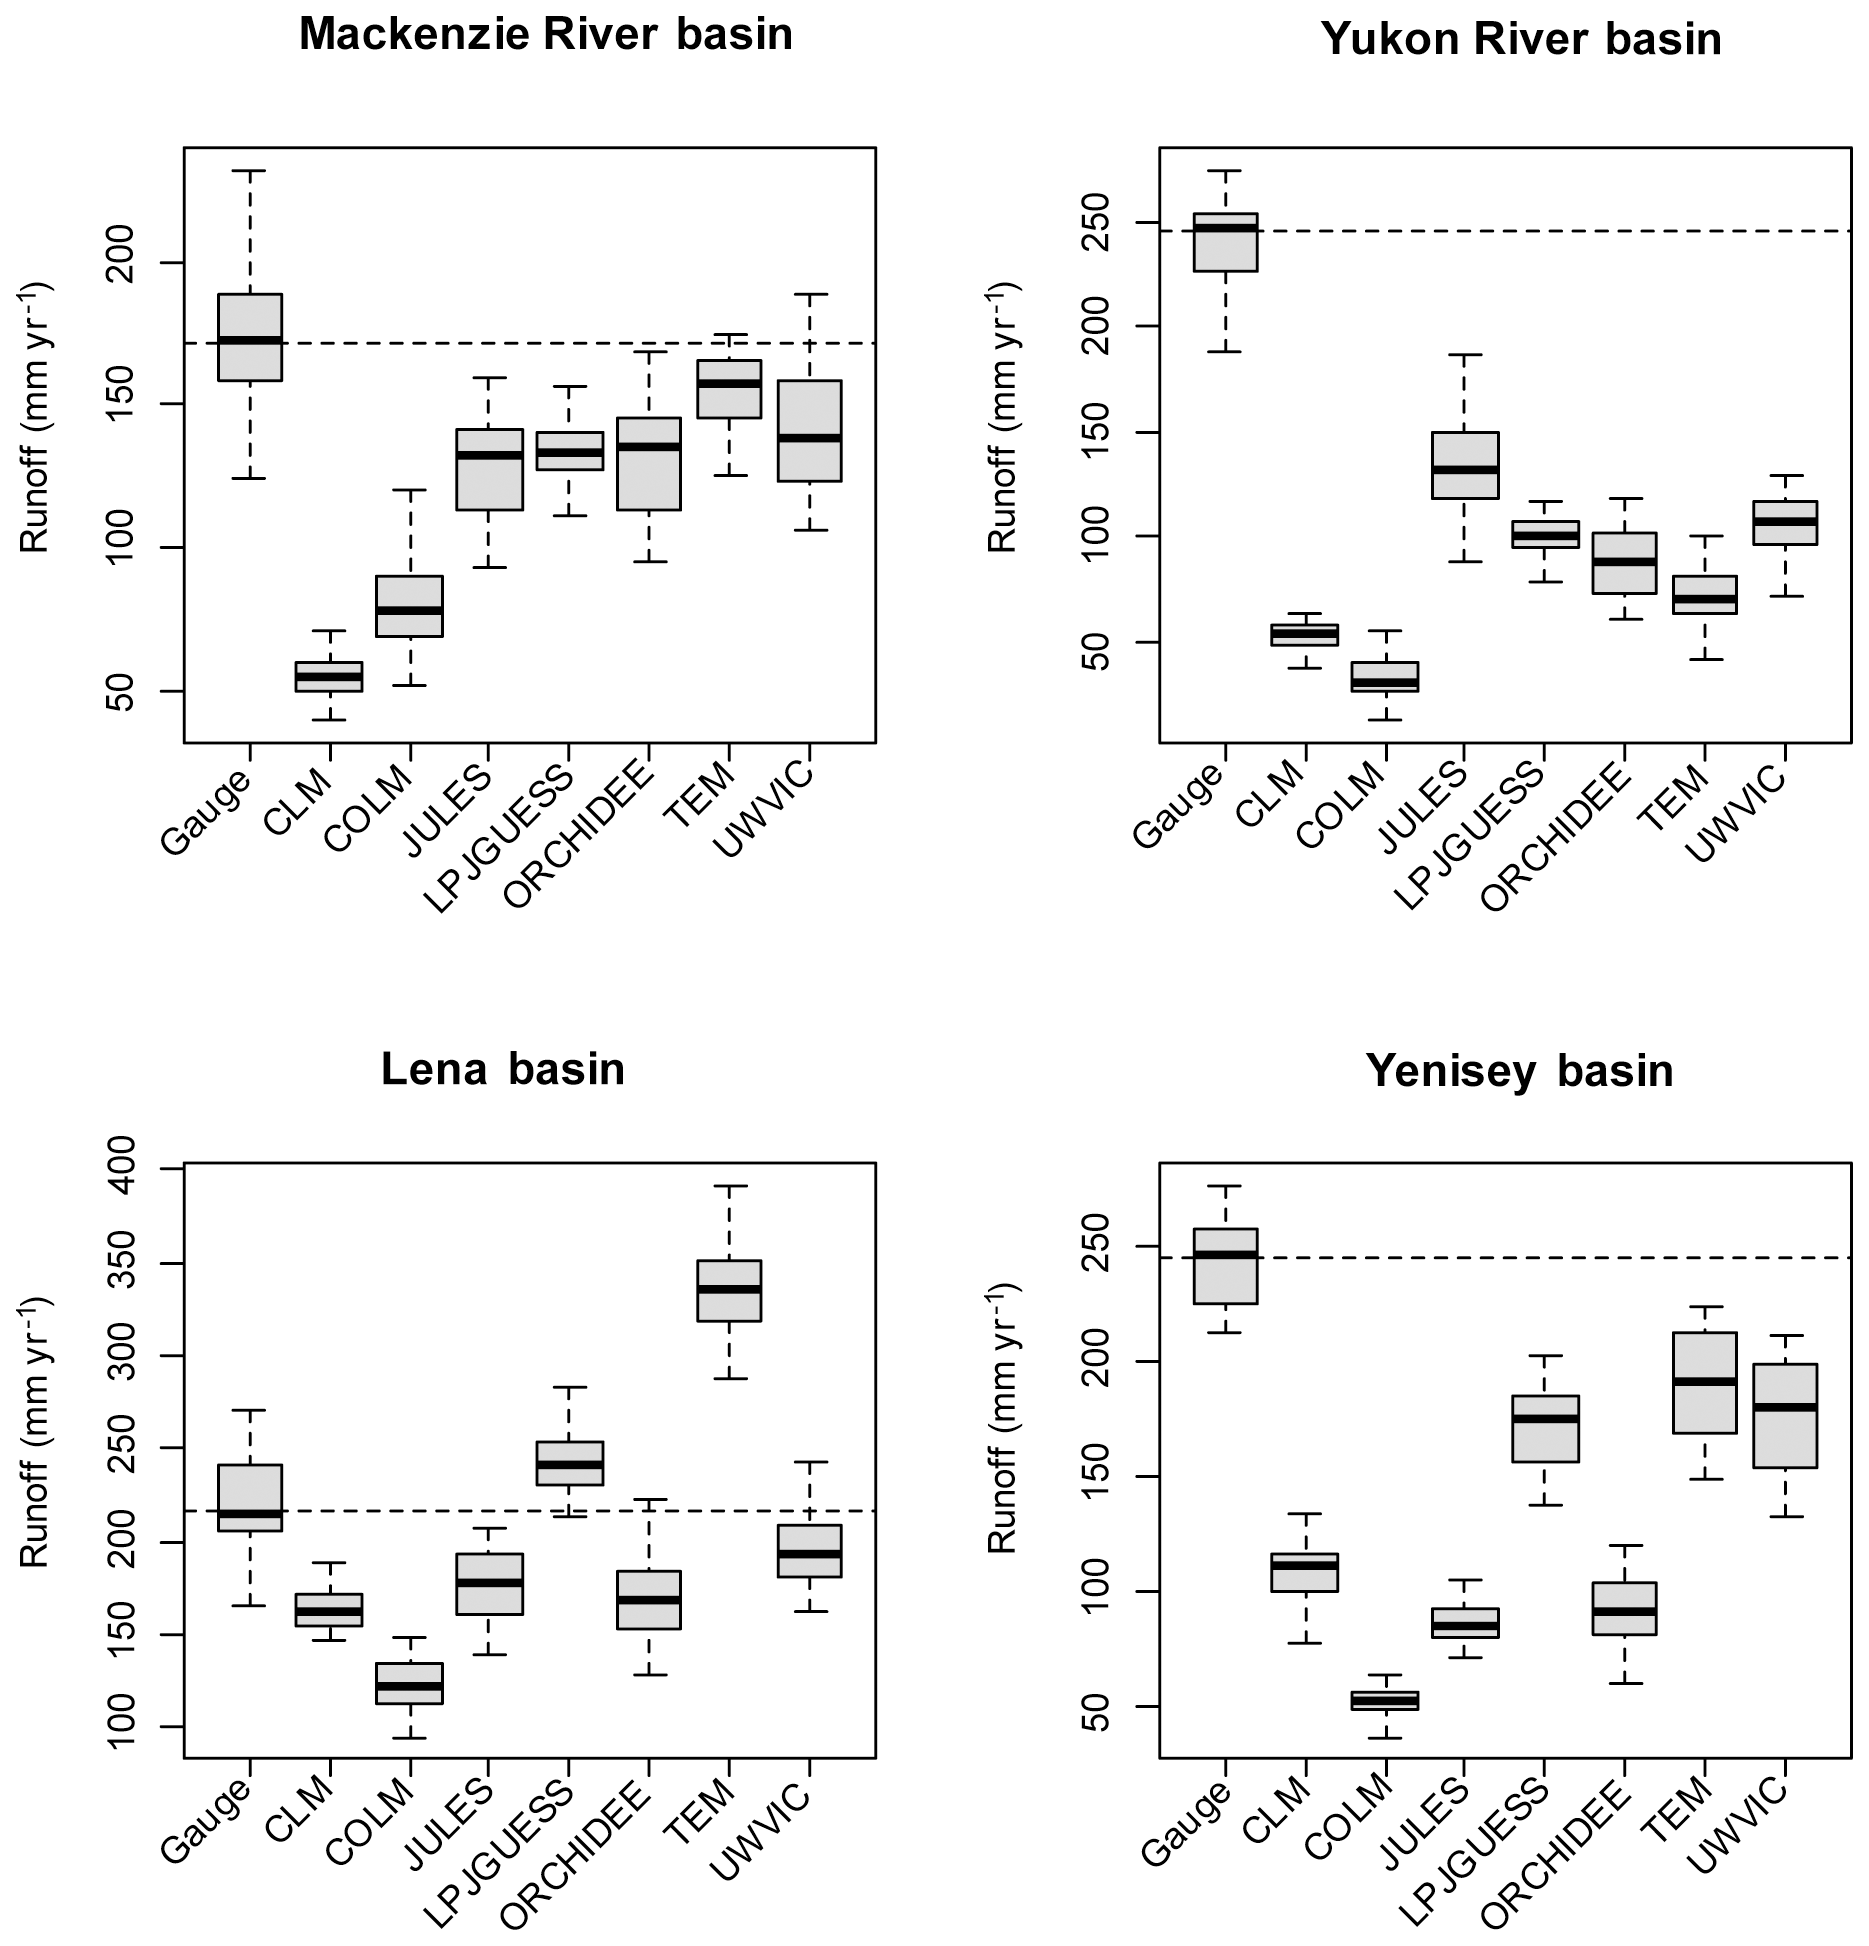
Figure 7Discharge comparison between gauge station data and model output for each river basin. Dashed line indicates mean annual discharge at gauge station. Boxplots derived from mean annual-discharge (total runoff) simulations for the period of 1970 to 1999.
The net water balance (P-ET-R) is projected to increase for most models with precipitation increases outpacing the sum of ET and runoff changes. All models except TEM show an increase in the net water balance over the simulation period, which suggests that models are collecting soil water deeper in the soil column, presumably in response to increasing ALT, even while the top soil layers dry.
Table 3Correlation coefficients between simulated annual total runoff and gauge mean annual discharge 1970 to 1999. SIBCASA correlations are for surface runoff.
This study assessed near-surface soil moisture and hydrology projections in the permafrost region using widely used land models that represent permafrost. Most models showed near-surface drying despite the externally forced intensification of the water cycle driven by climate change. Drying was generally associated with increases of active-layer thickness and permafrost degradation in a warming climate. We show that the timing and magnitude of projected soil moisture changes vary widely across models, pointing to an uncertain future in permafrost hydrology and associated climatic feedbacks. In this section, we review the role of projected permafrost loss and active-layer thickening on soil moisture changes and some potential sources of variability among models. In addition, we comment on the potential effects of soil moisture projections on the permafrost carbon–climate feedback. It is important to note that this study is more qualitative in nature and does not focus on the detail of magnitude or spatial patterns of model signatures.
4.1 Permafrost degradation and drying
Increases in net precipitation and the counterintuitive drying of the top soil in the permafrost region suggest that soil column processes such as changes in active-layer thickness (ALT) and activation of subsurface drainage with permafrost thaw are acting to dry the top soil layers (Fig. 8a). In general, models represent impermeable soils when frozen. Then, as soils thaw at progressive depths in the summer, liquid water infiltrates further into the active layer, draining deeper into the thawed soil column (Avis et al., 2011; Lawrence et al., 2015; Swenson et al., 2012). However, relevant soil column processes related to thermokarst by thawing of excess ground ice (Lee et al., 2014) are limited in these simulations despite their significant occurrence in the permafrost region (Olefeldt et al., 2016). As permafrost thaws, ground ice melts, potentially reducing the volume of the soil column and changing the hydrological properties of the soil (Aas et al., 2019; Nitzbon et al., 2019). This would occur where soil surface elevation drops through sudden collapse or slow deformation by an amount equal to or greater than the increased depth of annual thaw (Fig. 8b). This mechanism, not represented in current large-scale models, could result in projected increases or no change in the water table over time as observed by long-term studies (Andresen and Lougheed, 2015; Mauritz et al., 2017; Natali et al., 2015). Subsidence of 12–13 cm has been observed in northern Alaska over a 5-year period, which represents a volume loss of about 25 % of the average ALT for that region (∼50 cm; Streletskiy et al., 2008). These lines of evidence may suggest that permafrost thaw may not dry the Arctic as fast as simulated by land models but rather maintain or enhance soil water saturation depending on the water balance of the modeled cell column.

Figure 8Schematic of changes in the soil column moisture (a) without subsidence (current models) and (b) with subsidence from thawing ice-rich permafrost (not represented by models), a process that may accumulate soil moisture and slow down drying over time.
Recent efforts have been made to address the high subgrid heterogeneity of fine-scale mechanisms including soil subsidence (Aas et al., 2019), hillslope hydrology, talik and thermokarst development (Jafarov et al., 2018), ice wedge degradation (Abolt et al., 2018; Liljedahl et al., 2016; Nitzbon et al., 2019), vertical and lateral heat transfer on permafrost thaw and groundwater flow (Kurylyk et al., 2016), and lateral water fluxes (Nitzbon et al., 2019). These processes are known to have a major role on surface and subsurface hydrology, and their implementation in large-scale models is needed. Other important challenges in land models' hydrology include representation of the significant area dynamics of the ubiquitous smaller, shallow water bodies observed over recent decades (Andresen and Lougheed, 2015; Jones et al., 2011; Roach et al., 2011; Smith et al., 2005). These systems are either lacking in simulations (polygon ponds and small lakes) or assumed to be static systems in simulations (large lakes). The implementation of surface hydrology dynamics and permafrost processes in large-scale land models will help reduce uncertainty in our ability to predict the future hydrological state of the Arctic and the associated climatic feedbacks. It is important to note that all these processes require data for model calibration, verification and evaluation that are commonly absent at large scales. Permafrost hydrology will only advance through synergistic efforts between field researchers and modelers.
4.2 Uncertainty in soil moisture and hydrology simulations
Differences in representations of soil thermal dynamics can directly affect hydrology through timing of the freezing–thawing cycle and by altering the rates of permafrost loss and subsurface drainage (Finney et al., 2012). McGuire et al. (2016) and Peng et al. (2016) show that these models exhibit considerable differences in permafrost quantities such as active-layer thickness and the mean and trends in near-surface (0–3 m) permafrost extent even though all the models are forced with observed climatology. However, these differences are smaller than those seen across the CMIP5 models (Koven et al., 2013). All models except ORCHIDEE employ a multilayer finite-difference heat diffusion for soil thermal dynamics (Table 2). Organic soil insulation, snow insulation and unfrozen-water effects on phase change are the most common structural differences among models for soil thermal dynamics but do not explain the variability in the simulated changes in ALT and permafrost area as shown by McGuire et al. (2016). Half of the participating models include organic matter in the soil properties (CLM, ORCHIDEE, SIBCASA and UWVIC), which can significantly impact soil thermal properties and lead to an increase in the hydraulic conductivity of the soil column, thereby enhancing drainage and redistribution of water in the soil column. Soil vertical characterization is another important aspect for soil thermal dynamics and hydrology (Chadburn et al., 2015; Nicolsky et al., 2007). Lawrence et al. (2008) indicated that a high-resolution soil column representation is necessary for accurate simulation of long-term trends in active-layer depth. However, McGuire et al. (2016) showed that soil column depth did not clearly explain variability of the simulated loss of permafrost area across models.
Water table representation can result in a first-order effect on soil moisture. Most models (CLM, CoLM, SIBCASA and ORCHIDEE) use some version of TOPMODEL (Niu et al., 2007), which employs a prognostic water table where subgrid-scale topography is the main driver of soil moisture variability in the cell. However, the water table is not explicitly represented in other models such as LPJGUESS, which has a uniform water table which is only applied for wetland areas. In addition to the water table, the storage and transmission of water in soils is a fundamental component of an accurate representation of soil moisture (Niu and Yang, 2006). The representation of soil water storage and transmission varies across models from Richards equations based on Clapp–Hornberger (1978) and/or van Genuchten (1980) functions (e.g., CLM, CoLM, SIBCASA and ORCHIDEE) to a simplified one-layer bucket (e.g., TEM). It is also important to note that most models differ in their numerical implementations of processes such as water movement through frozen soils (Gouttevin et al., 2012; Swenson et al., 2012) and in the use of iterative solutions and vertical discretization of water transmission (De Rosnay et al., 2000).
Differences in representation of vertical fluxes through evapotranspiration (ET) are also likely adding to the high variability in soil moisture projections. ET sources (e.g., interception loss, plant transpiration and soil evaporation) were similar across models but had different formulations (Table 2). The diversity of ET implementations (e.g., evaporative resistances from fractional areas) and of vegetation maps used by the modeling groups (Ottlé et al., 2013) can also contribute to the big spread on the temporal simulations for ET and soil moisture. Along with projected increases in ET, net precipitation (P-ET) is projected to increase for all models, suggesting that drying is not only attributed to soil evaporation, and the increasing net water balance (P-ET-R) proposes that models are storing water more deeply in the soil column as permafrost near the surface thaws.
Despite runoff improvements (Swenson et al., 2012), underestimation of river discharge has been a challenge in previous versions in models (Slater et al., 2007). The differences between models and observations in mean annual discharge may stem from several sources, particularly the substantial variation in the precipitation forcing for these models (Fig. 2e). This is attributed, in part, to the sparse observational networks in high latitudes. River discharge at high latitudes can differ substantially when different reanalysis forcing datasets are used. For example, river discharge for Arctic rivers differs substantially in CLM4.5 simulations when forced with GSWP3v1 compared to CRUNCEPv7 reanalysis datasets (not shown is runoff for Mackenzie, +32 %; Yukon, +78 %; Lena, −2 %; and Yenisey, +22 %). Other factors include potential deficiencies in the parameterization and/or implementation of ET and runoff processes as well as vegetation processes.
4.3 Implications for the permafrost carbon–climate feedback
If drying of the permafrost region occurs, carbon losses from the soil will be dominated by CO2 as a result of increased heterotrophic respiration rates compared to moist conditions (Elberling et al., 2013; Oberbauer et al., 2007; Schädel et al., 2016). With projected drying, CH4 flux emissions will slow down by the reduction of soil saturation and inundated areas through lowering the water table in grid cells (Fig. 8a). In a sensitivity study using CLM, the slower increase of methane emissions associated with surface drying could potentially lead to a reduction in the global warming potential of permafrost carbon emissions by up to 50 % compared to saturated soils (Lawrence et al., 2015). However, we need to also consider that current land models lack representation of important CH4 sources and pathways in the permafrost region such as lake and wetland dynamics that can counteract the suppression of CH4 fluxes by projected drying. Seasonal wetland area variation, which is not represented or is poorly represented in current models, can contribute to a third of the annual CH4 flux in boreal wetlands (Ringeval et al., 2012). Although this paper may raise more questions than answers, this study highlights the importance of advancing hydrology and hydrological heterogeneity in land models to help determine the spatial variability, timing and reasons for changes in the hydrology of terrestrial landscapes of the Arctic. These improvements may constrain projections of land–atmosphere carbon exchange and reduce uncertainty on the timing and intensity of the permafrost carbon feedback.
The simulation data analyzed in this paper are available through the National Snow and Ice Data Center (NSIDC; http://nsidc.org, last access: 24 January 2020). For inquiries please contact Kevin Schaefer (kevin.schaefer@nsidc.org).
This paper is a collective effort of the modeling groups of the Permafrost Carbon Network (http://www.permafrostcarbon.org, last access: 24 January 2020). CGA, DML, CJW and ADM wrote the initial draft with additional contributions from all authors. Figures were prepared by CGA.
The authors declare that they have no conflict of interest.
This paper is dedicated to the memory of Andrew G. Slater (1971–2016) for his scientific contributions in advancing Arctic hydrology modeling. This work was performed under the Next-Generation Ecosystem Experiments (NGEE Arctic, DOE ERKP757) project supported by the Biological and Environmental Research program in the Office of Science, U.S. Department of Energy. The study was also supported by the National Science Foundation through the Research Coordination Network (RCN) program and through the Study of Environmental Arctic Change (SEARCH) program in support of the Permafrost Carbon Network. We also acknowledge the joint DECC/Defra Met Office Hadley Centre Climate Programme (GA01101) and the European Union FP7-ENVIRONMENT project PAGE21.
This research has been supported by the Office of Science, U.S. Department of Energy (grant no. ERKP757).
This paper was edited by Ylva Sjöberg and reviewed by two anonymous referees.
Aas, K. S., Martin, L., Nitzbon, J., Langer, M., Boike, J., Lee, H., Berntsen, T. K., and Westermann, S.: Thaw processes in ice-rich permafrost landscapes represented with laterally coupled tiles in a land surface model, The Cryosphere, 13, 591–609, https://doi.org/10.5194/tc-13-591-2019, 2019.
Abolt, C. J., Young, M. H., Atchley, A. L., and Harp, D. R.: Microtopographic control on the ground thermal regime in ice wedge polygons, The Cryosphere, 12, 1957–1968, https://doi.org/10.5194/tc-12-1957-2018, 2018.
Andresen, C. G. and Lougheed, V. L.: Disappearing arctic tundra ponds: Fine-scale analysis of surface hydrology in drained thaw lake basins over a 65 year period (1948–2013), J. Geophys. Res., 120, 1–14, https://doi.org/10.1002/2014JG002778, 2015.
Andresen, C. G., Lara, M. J., Tweedie, C. T., and Lougheed, V. L.: Rising plant-mediated methane emissions from arctic wetlands, Glob. Change Biol., 23, 1128–1139, https://doi.org/10.1111/gcb.13469, 2017.
Avis, C. A., Weaver, A. J., and Meissner, K. J.: Reduction in areal extent of high-latitude wetlands in response to permafrost thaw, Nat. Geosci., 4, 444–448, https://doi.org/10.1038/ngeo1160, 2011.
Best, M. J., Pryor, M., Clark, D. B., Rooney, G. G., Essery, R. L. H., Ménard, C. B., Edwards, J. M., Hendry, M. A., Porson, A., Gedney, N., Mercado, L. M., Sitch, S., Blyth, E., Boucher, O., Cox, P. M., Grimmond, C. S. B., and Harding, R. J.: The Joint UK Land Environment Simulator (JULES), model description – Part 1: Energy and water fluxes, Geosci. Model Dev., 4, 677–699, https://doi.org/10.5194/gmd-4-677-2011, 2011.
Bohn, T. J., Podest, E., Schroeder, R., Pinto, N., McDonald, K. C., Glagolev, M., Filippov, I., Maksyutov, S., Heimann, M., Chen, X., and Lettenmaier, D. P.: Modeling the large-scale effects of surface moisture heterogeneity on wetland carbon fluxes in the West Siberian Lowland, Biogeosciences, 10, 6559–6576, https://doi.org/10.5194/bg-10-6559-2013, 2013.
Bonan, G. B.: A Land Surface Model (LSM v1.0) for Ecological, Hydrological and Atmospheric studies: Technical descripton and user's guide, 1996.
Chadburn, S. E., Burke, E. J., Essery, R. L. H., Boike, J., Langer, M., Heikenfeld, M., Cox, P. M., and Friedlingstein, P.: Impact of model developments on present and future simulations of permafrost in a global land-surface model, The Cryosphere, 9, 1505–1521, https://doi.org/10.5194/tc-9-1505-2015, 2015.
Dai, Y., Zeng, X., Dickinson, R. E., Baker, I., Bonan, G. B., Bosilovich, M. G., Denning, A. S., Dirmeyer P, Houser, P. R., Niu, G., Oleson, K. W., Schlosser, C. A., and Yang, Z.: The Common Land Model (CoLM), B. Am. Meteorol. Soc., 84, 1013–1023, https://doi.org/10.1175/BAMS-84-8-1013, 2003.
Dai, A., Qian, T., Trenberth, K. E., and Milliman, J. D.: Changes in continental freshwater discharge from 1948 to 2004, J. Climate, 22, 2773–2792, https://doi.org/10.1175/2008JCLI2592.1, 2009.
de Rosnay, P. and Polcher, J.: Modelling root water uptake in a complex land surface scheme coupled to a GCM, Hydrol. Earth Syst. Sci., 2, 239–255, https://doi.org/10.5194/hess-2-239-1998, 1998.
De Rosnay, P., Bruen, M., and Polcher, J.: Sensitivity of surface fluxes to the number of layers in the soil model used in GCMs, Geophys. Res. Lett., 27, 3329–3332, https://doi.org/10.1029/2000GL011574, 2000.
Elberling, B., Michelsen, A., Schädel, C., Schuur, E. A. G., Christiansen, H. H., Berg, L., Tamstorf, M. P., and Sigsgaard, C.: Long-term CO2 production following permafrost thaw, Nat. Clim. Change, 3, 890–894, https://doi.org/10.1038/nclimate1955, 2013.
Finney, D. L., Blyth, E., and Ellis, R.: Improved modelling of Siberian river flow through the use of an alternative frozen soil hydrology scheme in a land surface model, The Cryosphere, 6, 859–870, https://doi.org/10.5194/tc-6-859-2012, 2012.
Franchini, M. and Pacciani, M.: Comparative Analysis of Several Conceptual Rainfall-Runoff Models, J. Hydrol., 122, 161–219, https://doi.org/10.1016/0022-1694(91)90178-K, 1991.
Frey, K. E. and Mcclelland, J. W.: Impacts of permafrost degradation on arctic river biogeochemistry, Hydrol. Process., 23, 169–182, https://doi.org/10.1002/hyp, 2009.
Gent, P. R., Danabasoglu, G., Donner, L. J., Holland, M. M., Hunke, E. C., Jayne, S. R., Lawrence, D. M., Neale, R. B., Rasch, P. J., Vertenstein, M., Worley, P. H., Yang, Z. L., and Zhang, M.: The community climate system model version 4, J. Climate, 24, 4973–4991, https://doi.org/10.1175/2011JCLI4083.1, 2011.
Gerten, D., Schaphoff, S., Haberlandt, U., Lucht, W., and Sitch, S.: Terrestrial vegetation and water balance – hydrological evaluation of a dynamic global vegetation model, J. Hydrol., 286, 249–270, https://doi.org/10.1016/j.jhydrol.2003.09.029, 2004.
Gouttevin, I., Krinner, G., Ciais, P., Polcher, J., and Legout, C.: Multi-scale validation of a new soil freezing scheme for a land-surface model with physically-based hydrology, The Cryosphere, 6, 407–430, https://doi.org/10.5194/tc-6-407-2012, 2012.
Grosse, G., Jones, B., and Arp, C.: Thermokarst lakes, drainage, and drained basins, in: Treatise on Geomorphology, 8, 325–353., 2013.
Harris, I., Jones, P. D., Osborn, T. J., and Lister, D. H.: Updated high-resolution grids of monthly climatic observations – the CRU TS3.10 Dataset, Int. J. Climatol., 34, 623–642, https://doi.org/10.1002/joc.3711, 2014.
Hayes, D. J., Mcguire, A. D., Kicklighter, D. W., Gurney, K. R., Burnside, T. J., and Melillo, J. M.: Is the northern high-latitude land-based CO2 sink weakening?, Global Biogeochem. Cy., 25, 1–14, https://doi.org/10.1029/2010GB003813, 2011.
Hayes, D. J., Kicklighter, D. W., McGuire, A. D., Chen, M., Zhuang, Q., Yuan, F., Melillo, J. M., and Wullschleger, S. D.: The impacts of recent permafrost thaw on land–atmosphere greenhouse gas exchange, Environ. Res. Lett., 9, 045005, https://doi.org/10.1088/1748-9326/9/4/045005, 2014.
Haxeltine, A. and Prentice, I. C.: A General Model for the Light-Use Efficiency of Primary Production, Funct. Ecol., 10, 551–561, 1996.
Jafarov, E. and Schaefer, K.: The importance of a surface organic layer in simulating permafrost thermal and carbon dynamics, The Cryosphere, 10, 465–475, https://doi.org/10.5194/tc-10-465-2016, 2016.
Jafarov, E. E., Coon, E. T., Harp, D. R., Wilson, C. J., Painter, S. L., Atchley, A. L., and Romanovsky, V. E.: Modeling the role of preferential snow accumulation in through talik development and hillslope groundwater flow in a transitional permafrost landscape, Environ. Res. Lett., 13, 105006, https://doi.org/10.1088/1748-9326/aadd30, 2018.
Jensen, M. E. and Haise, H. R.: Estimating evapotranspiration from solar radiation, J. Irrig. Drain. Div. ASCE, 89, 15–41, 1963.
Ji, D., Wang, L., Feng, J., Wu, Q., Cheng, H., Zhang, Q., Yang, J., Dong, W., Dai, Y., Gong, D., Zhang, R.-H., Wang, X., Liu, J., Moore, J. C., Chen, D., and Zhou, M.: Description and basic evaluation of Beijing Normal University Earth System Model (BNU-ESM) version 1, Geosci. Model Dev., 7, 2039–2064, https://doi.org/10.5194/gmd-7-2039-2014, 2014.
Jones, B. M., Grosse, G., Arp, C. D., Jones, M. C., Walter Anthony, K. M., and Romanovsky, V. E.: Modern thermokarst lake dynamics in the continuous permafrost zone, northern Seward Peninsula, Alaska, J. Geophys. Res., 116, G00M03, https://doi.org/10.1029/2011JG001666, 2011.
Kanevskiy, M., Shur, Y., Jorgenson, T., Brown, D. R. N., Moskalenko, N., Brown, J., Walker, D. A., Raynolds, M. K., and Buchhorn, M.: Degradation and stabilization of ice wedges: Implications for assessing risk of thermokarst in northern Alaska, Geomorphology, 297, 20–42, https://doi.org/10.1016/j.geomorph.2017.09.001, 2017.
Koven, C., Friedlingstein, P., Ciais, P., Khvorostyanov, D., Krinner, G., and Tarnocai, C.: On the formation of high-latitude soil carbon stocks: Effects of cryoturbation and insulation by organic matter in a land surface model, Geophys. Res. Lett., 36, 1–5, https://doi.org/10.1029/2009GL040150, 2009.
Koven, C. D., Riley, W. J., and Stern, A.: Analysis of permafrost thermal dynamics and response to climate change in the CMIP5 earth system models, J. Climate, 26, 1877–1900, https://doi.org/10.1175/JCLI-D-12-00228.1, 2013.
Koven, C. D., Lawrence, D. M., and Riley, W. J.: Permafrost carbon-climate feedback is sensitive to deep soil carbon decomposability but not deep soil nitrogen dynamics, P. Natl. Acad. Sci. USA, 112, 3752–3757, https://doi.org/10.1073/pnas.1415123112, 2015.
Krinner, G., Viovy, N., de Noblet-Ducoudré, N., Ogée, J., Polcher, J., Friedlingstein, P., Ciais, P., Sitch, S., and Prentice, I. C.: A dynamic global vegetation model for studies of the coupled atmosphere-biosphere system, Global Biogeochem. Cy., 19, 1–33, https://doi.org/10.1029/2003GB002199, 2005.
Kurylyk, B. L., Hayashi, M., Quinton, W. L., McKenzie, J. M., and Voss, C. I.: Influence of vertical and lateral heat transfer on permafrost thaw, peatland landscape transition, and groundwater flow, Water Resour. Res., 52, 1286–1305, https://doi.org/10.1002/2015WR018057, 2016.
Lara, M. J., McGuire, A. D., Euskirchen, E. S., Tweedie, C. E., Hinkel, K. M., Skurikhin, A. N., Romanovsky, V. E., Grosse, G., Bolton, W. R., and Genet, H.: Polygonal tundra geomorphological change in response to warming alters future CO2 and CH4 flux on the Barrow Peninsula, Glob. Change Biol., 21, 1663–1651, https://doi.org/10.1111/gcb.12757, 2015.
Lawrence, D. M., Slater, A. G., Romanovsky, V. E., and Nicolsky, D. J.: Sensitivity of a model projection of near-surface permafrost degradation to soil column depth and representation of soil organic matter, J. Geophys. Res., 113, F02011, https://doi.org/10.1029/2007JF000883, 2008.
Lawrence, D. M., Koven, C. D., Swenson, S. C., Riley, W. J., and Slater, A. G.: Permafrost thaw and resulting soil moisture changes regulate projected high-latitude CO2 and CH4 emissions, Environ. Res. Lett., 10, 094011, https://doi.org/10.1088/1748-9326/10/9/094011, 2015.
Lee, H., Swenson, S. C., Slater, A. G., and Lawrence, D. M.: Effects of excess ground ice on projections of permafrost in a warming climate, Environ. Res. Lett., 9, 124006, https://doi.org/10.1088/1748-9326/9/12/124006, 2014.
Liang, X., Lettenmaier, D. P., Wood, E. F., and Burges, S.: A simple hydrologically based model of land surface water and energy fluxes for general circulation models, J. Geophys. Res., 99, 14415–14418, 1994.
Liljedahl, A., Boike, J., Daanen, R. P., Fedorov, A. N., Frost, G. V., Grosse, G., Hinzman, L. D., Iijma, Y., Jorgenson, J. C., Matveyeva, N., Necsoiu, M., Raynolds, M. K., Romanovsky, V., Schulla, J., Tape, K. D., Walker, D. A., Wilson, C., Yabuki, H., and Zona, D.: Pan-Arctic ice-wedge degradation in warming permafrost and influence on tundra hydrology, Nat. Geosci., 9, 312–319, https://doi.org/10.1038/ngeo2674, 2016.
Mauritz, M., Bracho, R., Celis, G., Hutchings, J., Natali, S. M., Pegoraro, E., Salmon, V. G., Schädel, C., Webb, E. E., and Schuur, E. A. G.: Nonlinear CO2 flux response to 7 years of experimentally induced permafrost thaw, Glob. Change Biol., 23, 3646–3666, https://doi.org/10.1111/gcb.13661, 2017.
McGuire, A. D., Lawrence, D. M., Koven, C., Clein, J. S., Burke, E., Chen, G., Jafarov, E., MacDougall, A. H., Marchenko, S., Nicolsky, D., Peng, S., Rinke, A., Ciais, P., Gouttevin, I., Hayes, D. J., Ji, D., Krinner, G., Moore, J. C., Romanovsky, V., Schädel, C., Schaefer, K., Schuur, E. A. G., and Zhuang, Q.: The Dependence of the Evolution of Carbon Dynamics in the Northern Permafrost Region on the Trajectory of Climate Change, P. Natl. Acad. Sci. USA, 115, 3882–3887, https://doi.org/10.1073/pnas.1719903115, 2018.
McGuire, D. A., Koven, C. D., Lawrence, D. M., Burke, E., Chen, G., Chen, X., Delire, C., and Jafarov, E.: Variability in the sensitivity among model simulations of permafrost and carbon dynamics in the permafrost region between 1960 and 2009, Global Biogeochem. Cy., 30, 1015–1037, https://doi.org/10.1002/2016GB005405, 2016.
Mitchell, T. D. and Jones, P. D.: An improved method of constructing a database of monthly climate observations and associated high-resolution grids, Int. J. Climatol., 25, 693–712, https://doi.org/10.1002/joc.1181, 2005.
Natali, S. M., Schuur, E. A. G., Mauritz, M., Schade, J. D., Celis, G., Crummer, K. G., Johnston, C., Krapek, J., Pegoraro, E., Salmon, V. G., and Webb, E. E.: Permafrost thaw and soil moisture driving CO2 and CH4 release from upland tundra, J. Geophys. Res.-Biogeo., 120, 525–537, https://doi.org/10.1002/2014JG002872.Received, 2015.
Newman, B. D., Throckmorton, H. M., Graham, D. E., Gu, B., Hubbard, S. S., Liang, L., Wu, Y., Heikoop, J. M., Herndon, E. M., Phelps, T. J., Wilson, C. J., and Wullschleger, S. D.: Microtopographic and depth controls on active layer chemistry in Arctic polygonal ground, Geophys. Res. Lett., 42, 1808–1817, https://doi.org/10.1002/2014GL062804, 2015.
Nicolsky, D. J., Romanovsky, V. E., Alexeev, V. A., and Lawrence, D. M.: Improved modeling of permafrost dynamics in a GCM land-surface scheme, Geophys. Res. Lett., 34, L08501, https://doi.org/10.1029/2007GL029525, 2007.
Nitzbon, J., Langer, M., Westermann, S., Martin, L., Aas, K. S., and Boike, J.: Pathways of ice-wedge degradation in polygonal tundra under different hydrological conditions, The Cryosphere, 13, 1089–1123, https://doi.org/10.5194/tc-13-1089-2019, 2019.
Niu, G. and Yang, Z.: Effects of Frozen Soil on Snowmelt Runoff and Soil Water Storage at a Continental Scale, J. Hydrometeorol., 7, 937–952, https://doi.org/10.1175/JHM538.1, 2006.
Niu, G.-Y., Yang, Z.-L., Dickinson, R. E., Gulden, L. E., and Su, H.: Development of a simple groundwater model for use in climate models and evaluation with Gravity Recovery and Climate Experiment data, J. Geophys. Res., 112, D07103, https://doi.org/10.1029/2006JD007522, 2007.
Oberbauer, S., Tweedie, C., Welker, J. M., Fahnestock, J. T., Henry, G. H. R., Webber, P. J., Hollister, R. D., Walker, D. A., Kuchy, A., Elmore, E., and Starr, G.: Tundra CO2 fluxes in response to experimental warming across latitudinal and moisture gradients, Ecol. Monogr., 77, 221–238 https://doi.org/10.1890/06-0649 2007.
Olefeldt, D., Goswami, S., Grosse, G., Hayes, D., Hugelius, G., Kuhry, P., Mcguire, A. D., Romanovsky, V. E., Sannel, A. B. K., Schuur, E. A. G., and Turetsky, M. R.: Circumpolar distribution and carbon storage of thermokarst landscapes, Nat. Commun., 7, 1–11, https://doi.org/10.1038/ncomms13043, 2016.
Oleson, K., Lawrence, D., Bonan, G., Drewniak, B., Huang, M., Koven, C., Levis, S., Li, F., Riley, W., Subin, Z., Swenson, S., Thornton, P., Bozbiyik, A., Fisher, R., Heald, C., Kluzek, E., Lamarque, J.-F., Lawrence, P., Leung, L., Lipscomb, W., Muszala, S., Ricciuto, D., Sacks, W., Sun, Y., Tang, J., and Yang, Z.-L.: Technical description of version 4.5 of the Community Land Model (CLM), Boulder, Colorado, available at: http://opensky.library.ucar.edu/collections/TECH-NOTE-000-000-000-870 (last access: March 2016), 2013.
Ottlé, C., Lescure, J., Maignan, F., Poulter, B., Wang, T., and Delbart, N.: Use of various remote sensing land cover products for plant functional type mapping over Siberia, Earth Syst. Sci. Data, 5, 331–348, https://doi.org/10.5194/essd-5-331-2013, 2013.
Peng, S., Ciais, P., Krinner, G., Wang, T., Gouttevin, I., McGuire, A. D., Lawrence, D., Burke, E., Chen, X., Decharme, B., Koven, C., MacDougall, A., Rinke, A., Saito, K., Zhang, W., Alkama, R., Bohn, T. J., Delire, C., Hajima, T., Ji, D., Lettenmaier, D. P., Miller, P. A., Moore, J. C., Smith, B., and Sueyoshi, T.: Simulated high-latitude soil thermal dynamics during the past 4 decades, The Cryosphere, 10, 179–192, https://doi.org/10.5194/tc-10-179-2016, 2016.
Philip, J. R.: Evaporation and moisture and heat fields in the soil, J. Meteorol., 14, 354–366, 1957.
Rawlins, M. A., Steele, M., Holland, M. M., Adam, J. C., Cherry, J. E., Francis, J. A., Groisman, P. Y., Hinzman, L. D., Huntington, T. G., Kane, D. L., Kimball, J. S., Kwok, R., Lammers, R. B., Lee, C. M., Lettenmaier, D. P., McDonald, K. C., Podest, E., Pundsack, J. W., Rudels, B., Serreze, M. C., Shiklomanov, A., Skagseth, Ø., Troy, T. J., Vörösmarty, C. J., Wensnahan, M., Wood, E. F., Woodgate, R., Yang, D., Zhang, K., and Zhang, T.: Analysis of the Arctic System for Freshwater Cycle Intensification: Observations and Expectations, J. Climate, 23, 5715–5737, https://doi.org/10.1175/2010JCLI3421.1, 2010.
Ringeval, B., Decharme, B., Piao, S. L., Ciais, P., Papa, F., de Noblet-Ducoudré, N., Prigent, C., Friedlingstein, P., Gouttevin, I., Koven, C., and Ducharne, A.: Modelling sub-grid wetland in the ORCHIDEE global land surface model: evaluation against river discharges and remotely sensed data, Geosci. Model Dev., 5, 941–962, https://doi.org/10.5194/gmd-5-941-2012, 2012.
Roach, J., Griffith, B., Verbyla, D., and Jones, J.: Mechanisms influencing changes in lake area in Alaskan boreal forest, Glob. Change Biol., 17, 2567–2583, https://doi.org/10.1111/j.1365-2486.2011.02446.x, 2011.
Schädel, C., Bader, M. K.-F., Schuur, E. A. G., Biasi, C., Bracho, R., Čapek, P., De Baets, S., Diáková, K., Ernakovich, J., Estop-Aragones, C., Graham, D. E., Hartley, I. P., Iversen, C. M., Kane, E., Knoblauch, C., Lupascu, M., Martikainen, P. J., Natali, S. M., Norby, R. J., O'Donnell, J. A., Chowdhury, T. R., Šantrůčková, H., Shaver, G., Sloan, V. L., Treat, C. C., Turetsky, M. R., Waldrop, M. P., and Wickland, K. P.: Potential carbon emissions dominated by carbon dioxide from thawed permafrost soils, Nat. Clim. Change, 6, 950–953, https://doi.org/10.1038/nclimate3054, 2016.
Schaefer, K., Zhang, T., Bruhwiler, L., and Barrett, A. P.: Amount and timing of permafrost carbon release in response to climate warming, Tellus B, 63, 165–180, https://doi.org/10.1111/j.1600-0889.2011.00527.x, 2011.
Sheffield, J., Goteti, G., and Wood, E. F.: Development of a 50-year high-resolution global dataset of meteorological forcings for land surface modeling, J. Climate, 19, 3088–3111, https://doi.org/10.1175/JCLI3790.1, 2006.
Slater, A. G. and Lawrence, D. M.: Diagnosing present and future permafrost from climate models, J. Climate, 26, 5608–5623, https://doi.org/10.1175/JCLI-D-12-00341.1, 2013.
Slater, A. G., Bohn, T. J., McCreight, J. L., Serreze, M. C., and Lettenmaier, D. P.: A multimodel simulation of pan-Arctic hydrology, J. Geophys. Res.-Biogeo., 112, 1–17, https://doi.org/10.1029/2006JG000303, 2007.
Smith, L. C., Sheng, Y., MacDonald, G. M., and Hinzman, L. D.: Disappearing Arctic lakes, Science, 308, 1429, https://doi.org/10.1126/science.1108142, 2005.
Streletskiy, D. A., Shiklomanov, N. I., Nelson, F. E., and Klene, A. E.: 13 Years of Observations at Alaskan CALM Sites?: Long-term Active Layer and Ground Surface Temperature Trends, in: Ninth International Conference on Permafrost, edited by: Kane, D. L. and Hinkel, K. M., University of Alaska at Fairbanks, Fairbanks, AK, 1727–1732, 2008.
Swenson, S. C., Lawrence, D. M., and Lee, H.: Improved simulation of the terrestrial hydrological cycle in permafrost regions by the Community Land Model, J. Adv. Model. Earth Sy., 4, 1–15, https://doi.org/10.1029/2012MS000165, 2012.
Thornthwaite, C. and Mather, J. R.: Instructions and tables for computing potential evapotranspiration and the water balance: Centeron, N.J., Laboratory of Climatology, Publ. Climatol., 10, 185–311, 1957.
Throckmorton, H. M., Heikoop, J. M., Newman, B. D., Altmann, G. L., Conrad, M. S., Muss, J. D., Perkins, G. B., Smith, L. J., Torn, M. S., Wullschleger, S. D., and Wilson, C. J.: Pathways and transformations of dissolved methane and dissolved inorganic carbon in Arctic tundra watersheds: Evidence from analysis of stable isotopes, Global Biogeochem. Cy., 29, 1893–1910, https://doi.org/10.1002/2014GB005044.Received, 2015.
van Genuchten, M. T.: A closed-form equation for predicting the hydraulic conductivity ofunsaturated soils, Soil Sci. Soc. Am. J., 44, 892–898, 1980.
Walvoord, M. A. and Kurylyk, B. L.: Hydrologic Impacts of Thawing Permafrost – A Review, Vadose Zone J., 15, 1539–1663, https://doi.org/10.2136/vzj2016.01.0010, 2016.
Wang, W., Rinke, A., Moore, J. C., Ji, D., Cui, X., Peng, S., Lawrence, D. M., McGuire, A. D., Burke, E. J., Chen, X., Decharme, B., Koven, C., MacDougall, A., Saito, K., Zhang, W., Alkama, R., Bohn, T. J., Ciais, P., Delire, C., Gouttevin, I., Hajima, T., Krinner, G., Lettenmaier, D. P., Miller, P. A., Smith, B., Sueyoshi, T., and Sherstiukov, A. B.: Evaluation of air–soil temperature relationships simulated by land surface models during winter across the permafrost region, The Cryosphere, 10, 1721–1737, https://doi.org/10.5194/tc-10-1721-2016, 2016.
Wania, R., Ross, I., and Prentice, I. C.: Integrating peatlands and permafrost into a dynamic global vegetation model?: 1 Evaluation and sensitivity of physical land surface processes, Global Biogeochem. Cy., 23, 1–19, https://doi.org/10.1029/2008GB003412, 2009a.
Wania, R., Ross, I., and Prentice, I. C.: Integrating peatlands and permafrost into a dynamic global vegetation model?: 2 Evaluation and sensitivity of vegetation and carbon cycle processes, Global Biogeochem. Cy., 23, 1–15, https://doi.org/10.1029/2008GB003413, 2009b.
Willmott, C. J. and Matsuura, K.: Terrestrial air temperature and precipitation: Monthly and annual time series (1950–1999) Version 1.02, 2001.