the Creative Commons Attribution 4.0 License.
the Creative Commons Attribution 4.0 License.
 | 12 Mar 2020
Strong changes in englacial temperatures despite insignificant changes in ice thickness at Dôme du Goûter glacier (Mont Blanc area)
Christian Vincent
Adrien Gilbert
Bruno Jourdain
Luc Piard
Patrick Ginot
Vladimir Mikhalenko
Philippe Possenti
Emmanuel Le Meur
Olivier Laarman
Delphine Six
The response of very-high-elevation glaciated areas on Mont Blanc to climate change has been analysed using observations and numerical modelling over the last 2 decades. Unlike the changes at low elevations, we observe very low glacier thickness changes, of about −2.6 m on average since 1993. The slight changes in horizontal ice flow velocities and submergence velocities suggest a decrease of about 10 % in ice flux and surface mass balance. This is due to less snow accumulation and is consistent with the precipitation decrease observed in meteorological data. Conversely, measurements performed in deep boreholes since 1994 reveal strong changes in englacial temperature reaching a 1.5 ∘C increase at a depth of 50 m. We conclude that at such very high elevations, current changes in climate do not lead to visible changes in glacier thickness but cause invisible changes within the glacier in terms of englacial temperatures. Our analysis from numerical modelling shows that glacier near-surface temperature warming is enhanced by increasing melt frequency at high elevations although the impact on surface mass balance is low. This results in a non-linear response of englacial temperature to currently rising air temperatures. In addition, borehole temperature inversion including a new dataset confirms previous findings of similar air temperature changes at high and low elevations in the Alps.
- Article
(4087 KB) -
Supplement
(126 KB) - BibTeX
- EndNote


Glaciers are very sensitive to climate change, as shown by numerous studies (e.g. Oerlemans, 2001; Huss, 2012; Thibert et al., 2018). Over recent decades, they have become one of the most emblematic indicators of climate change for the general public. Many glaciers in the world have strongly receded over recent decades (Zemp et al., 2019; Gardner et al., 2013). However, the sensitivity of mass balance to climate can be very different depending on the climatic region and meteorological conditions (Oerlemans, 2001). In addition, the influence of climate change on the surface mass balance depends strongly on elevation (Vincent et al., 2007a). Due to the difficulty of access, very few measurements have been carried out on glaciers at very high elevations (WGMS, 2015) even though englacial temperatures and surface mass balance are amongst the few indicators of climate change at such very high elevations. Englacial temperatures in these cold areas are very sensitive to atmospheric change due the associated increase in surface melting. Gilbert et al. (2014a) showed that the enhanced uptake of energy at the surface of cold glaciers is triggered by the increasing energy flux from the atmosphere due to surface energy balance when surface temperatures reach 0 ∘C. Percolation and refreezing processes efficiently transfer this energy from the surface to underlying layers.
In the Alps, most of the observations of mass balance have been carried out on low-altitude glaciers, generally below 3600 m above sea level (a.s.l.) (WGMS, 2015). Most of these glaciers are temperate. Consequently, an increase in surface energy balance leads to an increase in melting. The processes are different for cold glaciers at very high elevations for which an excess of energy balance at the surface results mainly in englacial temperature increase (Hutter, 1983; Aschwanden and Blatter, 2009).
Englacial temperature measurements are available for very few cold alpine glaciers at high elevations (Lüthi and Funk, 2001; Suter, 2002; Hoelzle et al., 2011; Vincent et al., 2007b; Gilbert et al., 2010; Gilbert and Vincent, 2013). Even fewer measurements are available at these elevations to simultaneously assess changes in both surface mass balance and englacial temperatures. Our study aims to jointly assess surface mass balance and englacial temperature changes at very high elevation over 25 years (1993–2017) from in situ measurements at Col du Dôme (4250 m), French Alps, to study the impact of climate change on such high-elevation glaciated areas.
The Dôme du Goûter is located in the Mont Blanc area at an elevation of 4300 m a.s.l., 7 km from Chamonix-Mont-Blanc. It is a small ice cap with ice thickness ranging from 45 to 140 m (Vincent et al., 2007b). About 300 m from the summit, there is a saddle with very gentle slopes, named Col du Dôme (4250 m a.s.l.). On this saddle, four deep boreholes down to about 126 m deep have been drilled since 1994 at the same location, within a radius of several metres.
2.1 Englacial temperature measurements
Englacial temperatures were measured from the surface to bedrock at the same location (large red triangle in Fig. 1) using thermistor chains in deep boreholes. Boreholes were drilled electromechanically in 1994, 2004, and 2016. The 2010 borehole was drilled using hot water. Thermistors with 0.05 ∘C accuracy were installed in all boreholes after drilling. In 1994, temperatures were measured 3 d after drilling. In 2004, temperatures were measured 5 d after drilling and again 6 months later. In 2010 and 2016, temperatures were measured several times for 6 and 7 months respectively after drilling. Except in 1994, measurements were repeated several times in each borehole until a thermal equilibrium (±0.05 ∘C) was reached. Indeed, repeated measurements after drilling and after several weeks or months show that the borehole temperatures below 20 m deep are consistent (±0.05 ∘C). The accuracy of measurements performed in 1994 is assessed to be better than ±0.1 ∘C. Density profiles were measured along the ice cores extracted in 1994 and in 2012. Note that the englacial temperatures have been measured between the surface and 73 m deep only in the borehole of 2012 and are not used in this study.
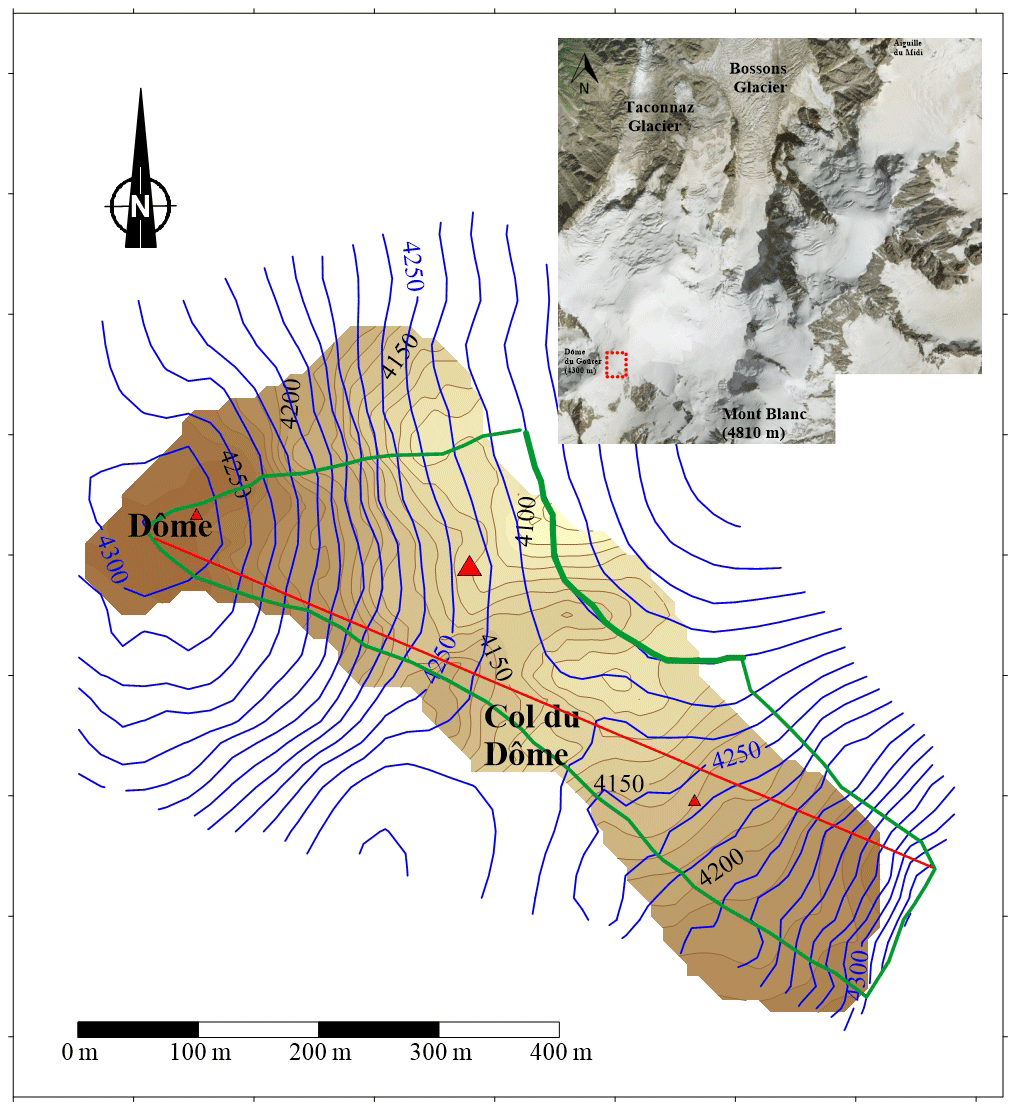
Figure 1Surface (blue) and bedrock (brown) digital elevation models of the Dôme du Goûter area. Elevation differences between two contour lines are 5 and 10 m for the surface and bedrock respectively. The large red triangle is the location of the core drilling and englacial temperature measurement site for this study. The two other small red triangles correspond to the locations of the previous englacial temperature measurement sites we also used for the temperature inversion. The green line shows the boundaries of the drainage basin and the flux gate (thick line) through which the ice flux change has been calculated. The red line shows the cross section used for altitude measurements. Aerial picture from Institut Géographique National (© IGN).
2.2 Ice flow velocities and geodetic measurements
Horizontal velocities have been obtained from the position of the lowest part of accumulation stakes buried deep in snow, 5 m long and 10 cm in diameter, considering the tilt and orientation of the stakes (Vincent et al., 2007a). Depending on the accumulation rate, the stakes were buried by snow every 6 months or every year. A total of 20 stakes were distributed in 1997 in the area shown in Fig. 1. These stakes were replaced only in 1998, 1999, 2002, 2003, 2004, 2008, 2009, and 2016. Consequently, the series of ice flow velocities and accumulation measurements are not continuous in time. In addition, the stake locations were modified over the period 1997–2004 (Vincent et al., 2007a). From 2009 to 2017, a fixed network of 12 stakes was used, with the stakes always at the same locations; however the measurements were not continuous over this period. The ice flow velocities have been calculated and averaged over three time periods (1997–2004, 2009–2011, 2016–2017). The theodolite-based field methods used to obtain surface velocity and surface topography data before 2000 have been fully described by Vincent et al. (1997). After 2000, geodetic measurements were performed with a Leica 1200 differential GPS (DGPS) unit running with dual frequencies. Occupation times were typically 1 min with 1 s sampling and the number of visible satellites (NAVSTAR and GLONASS) was greater than seven. The distance between the fixed receiver and the mobile receiver was less than 500 m. The DGPS positions have an intrinsic accuracy of ±0.01 m. However, because of the slope and creep of snow, some stakes tilt with time and, depending on the tilt of the stakes (generally less than 10∘), the stake horizontal and vertical positions have a maximum uncertainty of ±0.88 and ±0.09 m respectively. Provided that the initial position of the stake is almost vertical (±3∘), the uncertainty on horizontal and vertical displacement is assumed to be less than 1 and 0.1 m respectively. Another uncertainty could come from a “false” vertical motion due to the warming of the stake from solar radiation. Given that the stakes are wooden stakes 5 m long and 10 cm in diameter with a low thermal conductivity and that the temperature of the firn ranges between −5 and −15 ∘C, we assume this effect is negligible. The uncertainties of classical topographic measurements before 1995 are similar to those of DGPS measurements. The digital elevation models (DEMs) were obtained in 1993 and 2017 using the same in situ geodetic methods with a grid size of 30 m. The uncertainty obtained for each measured point of the DEMs is ±0.10 m and depends mainly on the roughness of the surface. In addition, glacier thickness changes were measured along a longitudinal cross section over a distance of about 600 m in June 1993, May 1998, October 2003, September 2009, March 2012, and August 2016 in order to estimate thickness changes over this profile (red line in Fig. 1).
2.3 Ground-penetrating radar (GPR) measurements
Radio echo-soundings were made in June 1993 and completed in 1999 on the Dôme du Goûter ice cap along 12 profiles in order to determine the bedrock topography (Vincent et al., 1997; Stephan Suter, unpublished data, 1999). The measurements were performed using a pulse radar transmitter (Icefield Instruments Inc., Canada) based on the Narod transmitter (Narod and Clarke, 1994) with a frequency of 5 MHz. The speed of electromagnetic wave propagation in the ice was assumed to be identical to the value of 175 µs−1 found at Colle Gnifetti (Wagner, 1994). The field measurements were performed in such a way as to obtain reflections from the glacier bed located in a vertical plane with the measurement points at the glacier surface. This makes it possible to locate the glacier bed in two dimensions. The bedrock topography was obtained from envelopes of all ellipse functions giving all the possible reflection positions. The ice thickness in this area ranges from 45 m (Dôme du Goûter) to 140 m (Fig. 1).
2.4 Mass balance and meteorological data
In addition to the observations performed at Col du Dome, glaciological and meteorological observations carried out in the Mont Blanc area have been used in this study. As part of the GLACIOCLIM observation facility (https://glacioclim.osug.fr/, last access: February 2020), winter and summer surface mass balances have been measured each year on two glaciers in the vicinity of Col du Dome since 1995 (Argentière and Mer de Glace), using the glaciological method (Cuffey and Paterson, 2010). Winter surface mass balances used in this study are located in the accumulation zone of the glaciers (> 3000 m) and are measured at the end of April using snow cores and density measurements. We also used annual and winter precipitation data from the SAFRAN reanalysis (Système d'Analyse Fournissant des Renseignements Adaptés à la Nivologie, System of analysis for the provision of information for the science of snow). This dataset is available back to 1958 (Durand et al., 2009). SAFRAN disaggregates large-scale meteorological analyses and observations in the French Alps. The analyses provide hourly meteorological data for the Mont Blanc range, as a function of slope exposures and altitude (at 300 m intervals). In this study, we used SAFRAN precipitation determined at 4300 m a.s.l.
3.1 Surface elevation changes
Glacier surface elevation changes were obtained between 1993 and 2017 from DEM comparisons over a surface area of 0.12 km2. As can be seen in Fig. 2, the thickness changes are not uniform, showing both positive and negative values depending on the location on the glacier. In any case, the changes are small everywhere and do not exceed 7 m between 1993 and 2017. Maximum thinning is located between the summit of Dôme du Goûter and the pass (Col du Dôme). Conversely, the thickness change is slightly positive south-east of this region. Note that the 1 m increase over 24 years found in this region is small in comparison to annual accumulation which can reach 8 m of snow per year at some sites and in comparison to interannual accumulation variability which can reach more than 2 m of snow per year. The average 1993–2017 thickness change obtained over the entire surface area is −2.65 m.

Figure 2Thickness changes (colour scale) between 1993 and 2017. The contour lines of surface topography correspond to the surface of 1993. The longitudinal cross section is shown by the thick black line.
In addition, geodetic measurements were carried out along a longitudinal cross section for different years (Fig. 3). The measurements were not performed during the same season each year but this is not crucial given that melting is close to zero at this altitude (Gilbert et al., 2014a) and snow accumulation occurs throughout the year (Vincent et al., 2007a). Although the measurements were performed on one longitudinal cross section only, it seems that thickness changes over each period of 5 years are as large as changes over the whole period of 24 years. From these data, we can conclude that the thickness changes observed at this altitude over 24 years are very small.

Figure 3Longitudinal cross section from Dôme du Goûter to Col du Dôme obtained from DGPS measurements performed in June 1993, May 1998, October 2003, September 2009, March 2012, and August 2016.
3.2 Ice flow velocity changes
Ice flow velocities were measured at numerous locations before 2009 but not always at the same locations (Fig. 4). Conversely, after 2009, the number of stakes was reduced but the stakes were always set up at the same locations. Thanks to the numerous measurements performed between 1997 and 2004, the ice flow velocities have been interpolated over the whole coloured area shown in Fig. 4. By comparing the velocities measured at similar locations during this period, we conclude that the ice flow velocities did not change significantly between 1997 and 2004.
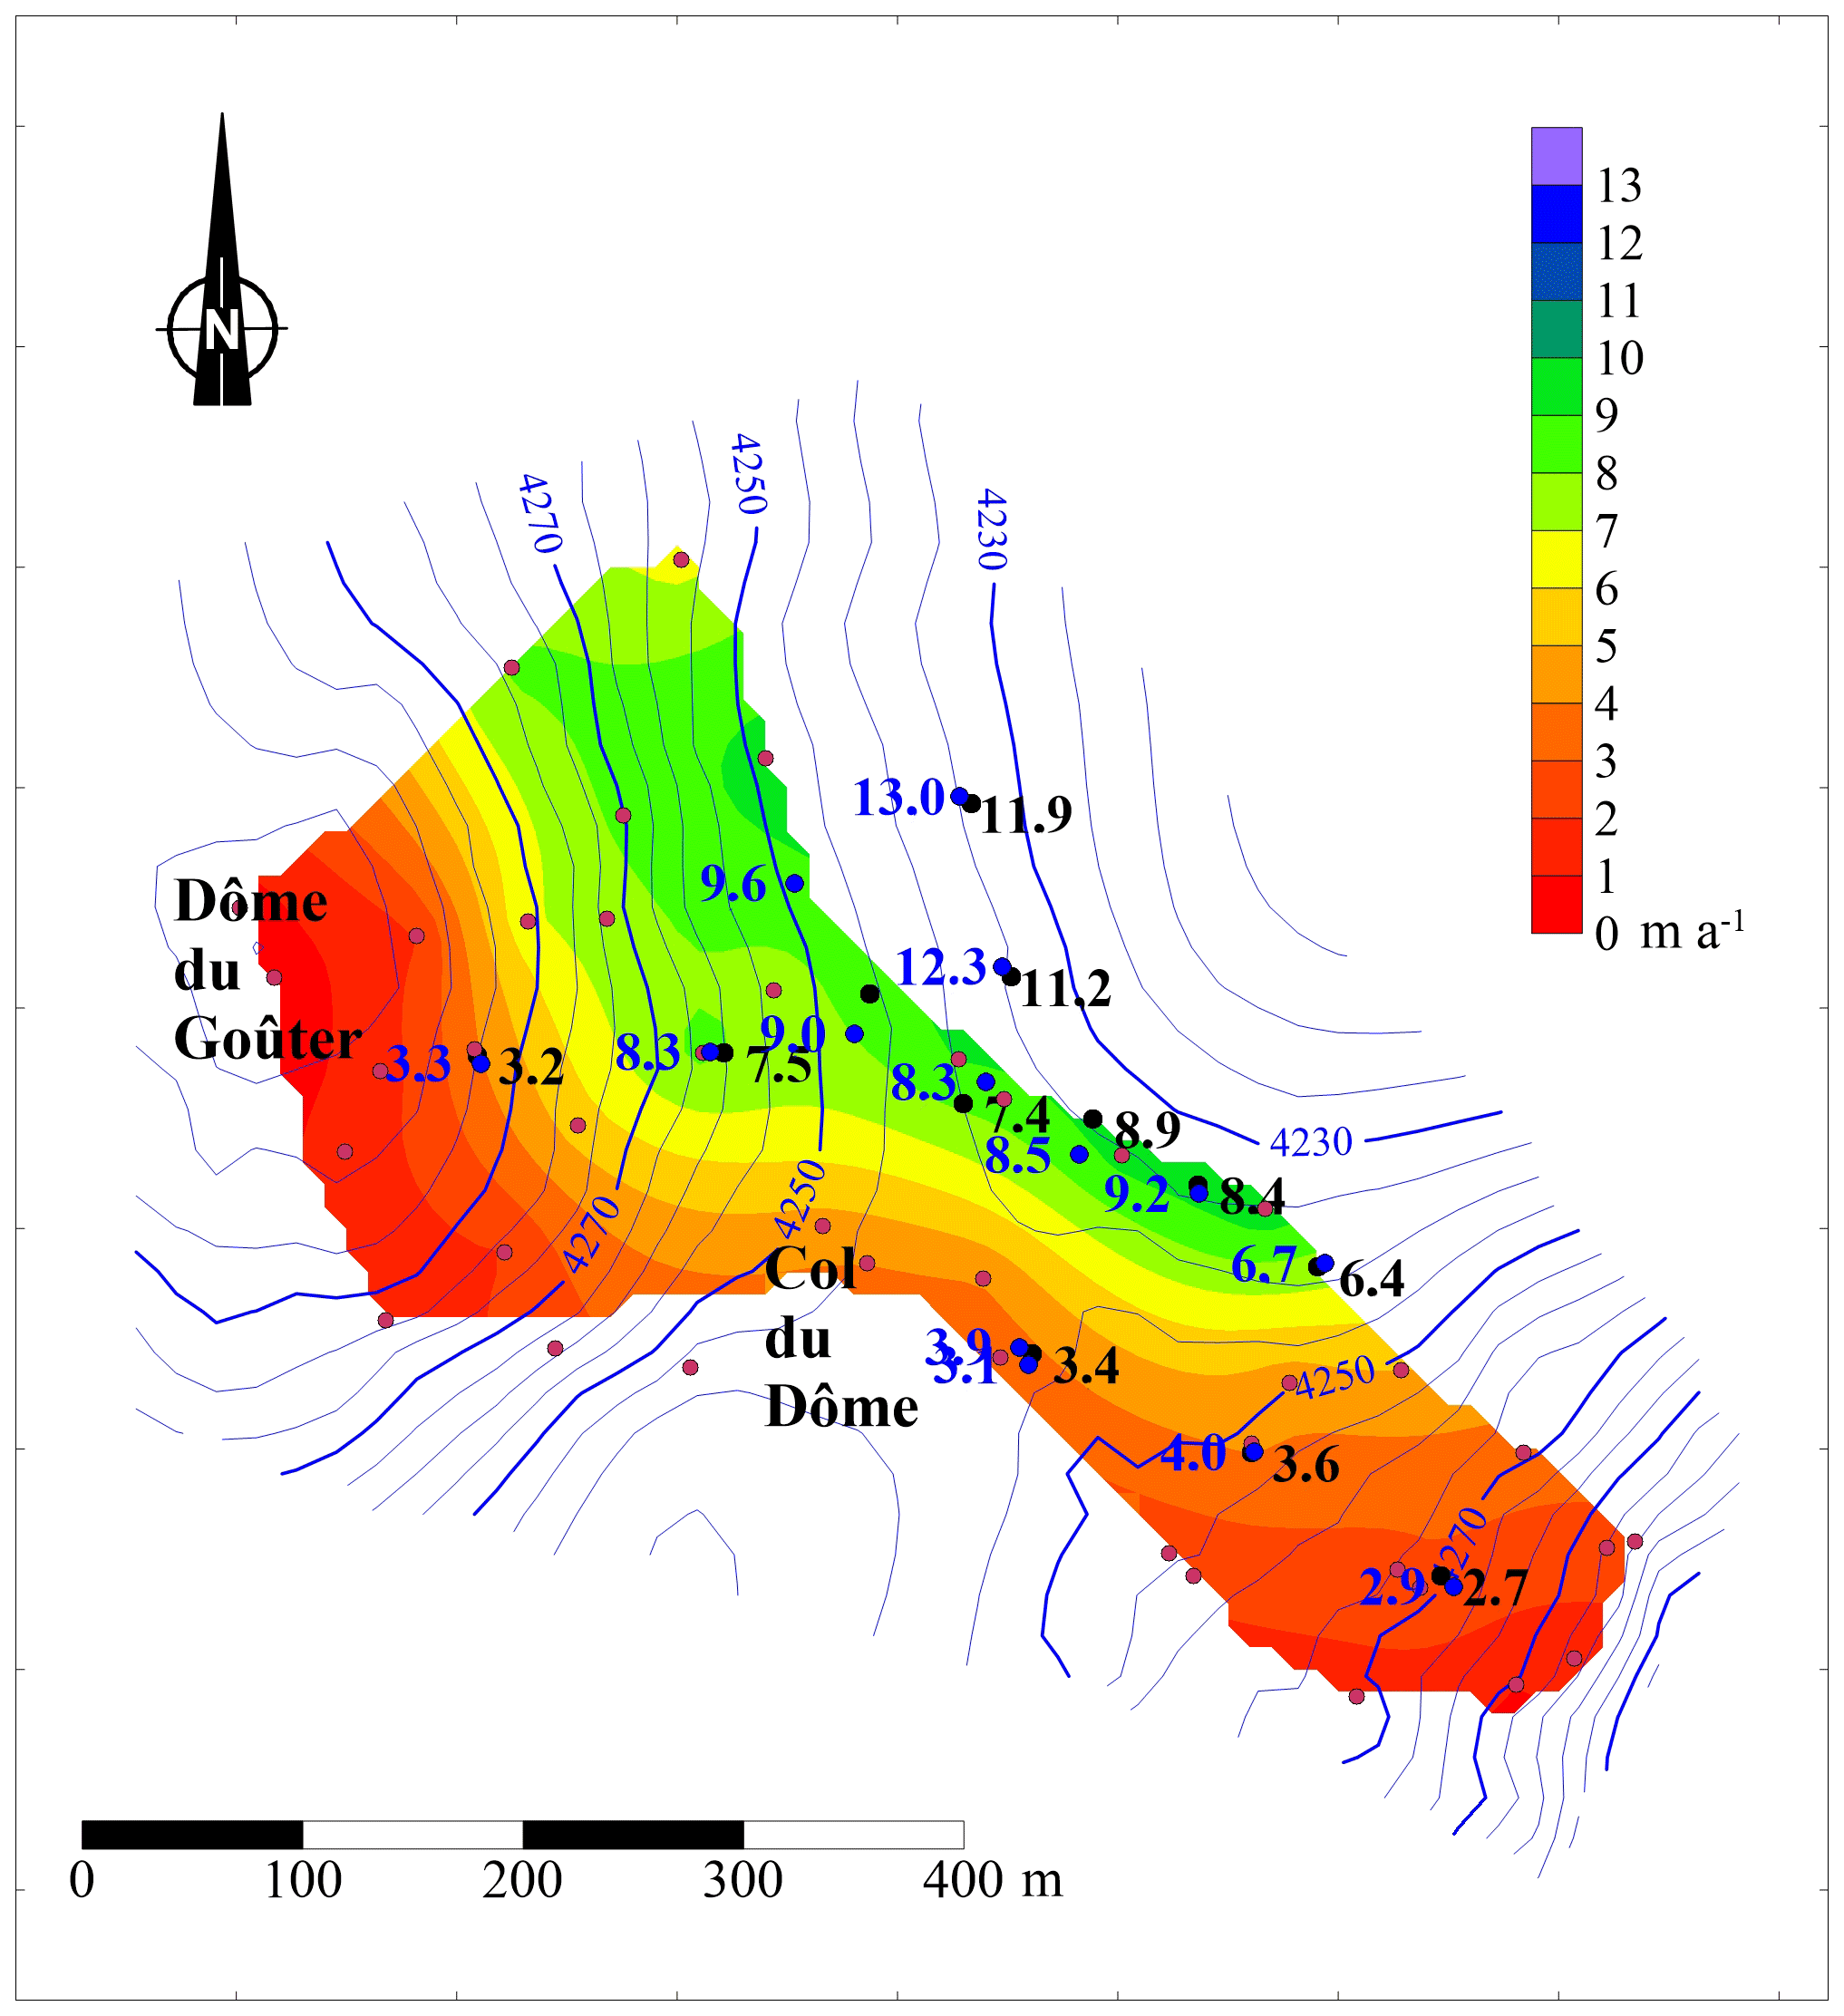
Figure 4Horizontal ice flow velocities (m a−1) observed between 1993 and 2004 (red dots and colour scale), between 2009 and 2011 (blue dots and values), and between 2016 and 2017 (black dots and values).
In this way, we can accurately compare the ice flow velocities over three periods, 1997–2004, 2009–2011, and 2016–2017 at the same locations, i.e. the locations of stakes set up in 2009 and 2016. No significant change in horizontal ice flow velocities can be detected between the 1997–2004 and 2009–2011 periods given that the differences are within the uncertainty of measurements (Fig. 5). Between the 1997–2004 and 2009–2011 periods, the differences are less than 0.86 m a−1 except for one point (1.00 m a−1). The average of the differences is 0.05 m a−1 and the standard deviation is 0.52 m a−1. Between the 2009–2011 and 2016–2017 periods, the differences are less than 1 m a−1 except for four points (1.1 and 1.09 m a−1). The average of the differences is −0.56 m a−1 and the standard deviation is 0.43 m a−1. Although these differences barely exceed the measurement uncertainty, they are systematic. Note also that each value results from three to five topographic surveys, except for the 2016–2017 period. Therefore, these differences observed between the 2009–2011 and 2016–2017 periods could indicate a deceleration over the last decade. The slope of the regression line between ice flow velocities of the 2009–2011 and 2016–2017 periods is 0.92, which means that the ice flow velocity decreased by 8 %. Over the whole period, using the same method, the ice flow velocity decreased by 11 %. One can conclude that the ice flow velocity changes indicate a change in ice flux very likely related to surface mass balance changes. Unfortunately, the surface mass balance measurements are discontinuous. They do not make it possible to detect any temporal change. However, the submergence velocities can help us to analyse the surface mass balance changes as shown in the next section.

Figure 5Comparison of horizontal ice flow velocities between the periods 1997–2004, 2009–2011, and 2016–2017. The black dots correspond to the comparison between the 1997–2004 and 2009–2011 periods. The red dots correspond to the comparison between the 1997–2004 and 2016–2017 periods. The blue dots correspond to the comparison between the 2009–2011 and 2016–2017 periods. The grey area corresponds to a difference of ±1 m a−1 in relation to the bisector.
3.3 Submergence velocity changes
The mean surface mass balance can be analysed indirectly from the submergence velocities. Previous studies (Vincent et al., 2007a) have shown that the submergence velocities appear to offer a good way of assessing the long-term average surface mass balance. Submergence velocities ws were calculated from
where u and w are the measured horizontal and vertical components of the surface velocity obtained from stake measurements and tanα is the surface slope (Hooke, 2005; Cuffey and Paterson, 2010). The submergence velocities are expressed in metre water equivalent per year (m w.e. a−1) calculated using the density of the firn, which is about 450 kg m−3 (see Supplement). Assuming an uncertainty of ±0.05 for the relative density and ±0.1 m for the vertical velocity component, the uncertainty should not exceed 0.4 m w.e. a−1.
As in the analysis of the horizontal ice flow velocities, the submergence velocities of the 1997–2004 period have been interpolated over the whole coloured area shown in Fig. 6. The submergence velocities can vary from 0.3 to 3.3 m w.e. a−1 depending on the location. This pattern is highly correlated with the accumulation pattern as shown by Vincent et al. (2007a). The submergence velocities have been compared over the three periods 1997–2004, 2009–2011, and 2016–2017 (Fig. 7). The comparison reveals a decrease in the submergence velocities after 2004. Based on the slope of the regression lines, the submergence velocities decreased by 8 % between the 1997–2004 and 2009–2011 periods and by 10 % between the 2009–2011 and 2016–2017 periods. Between the 2009–2011 and 2016–2017 periods, the average of the differences is −0.14 m w.e. a−1 and the standard deviation is 0.33 m w.e. a−1. Over the whole period (1997–2004/2016–2017), the average of the differences is −0.41 m w.e. a−1 and the standard deviation is 0.21 m w.e. a−1. Although the average difference is close to the uncertainty, the differences are systematic. According to the slope of the regression line, the submergence velocities decreased by 21 % over the whole period. Although the uncertainty is high, these results indicate a decrease in surface mass balances over the whole period. This explains the decrease in ice flow velocities and ice flux. These relative changes in ice flow velocities, ice flux, and surface mass balances are thoroughly discussed in Sect. 4.
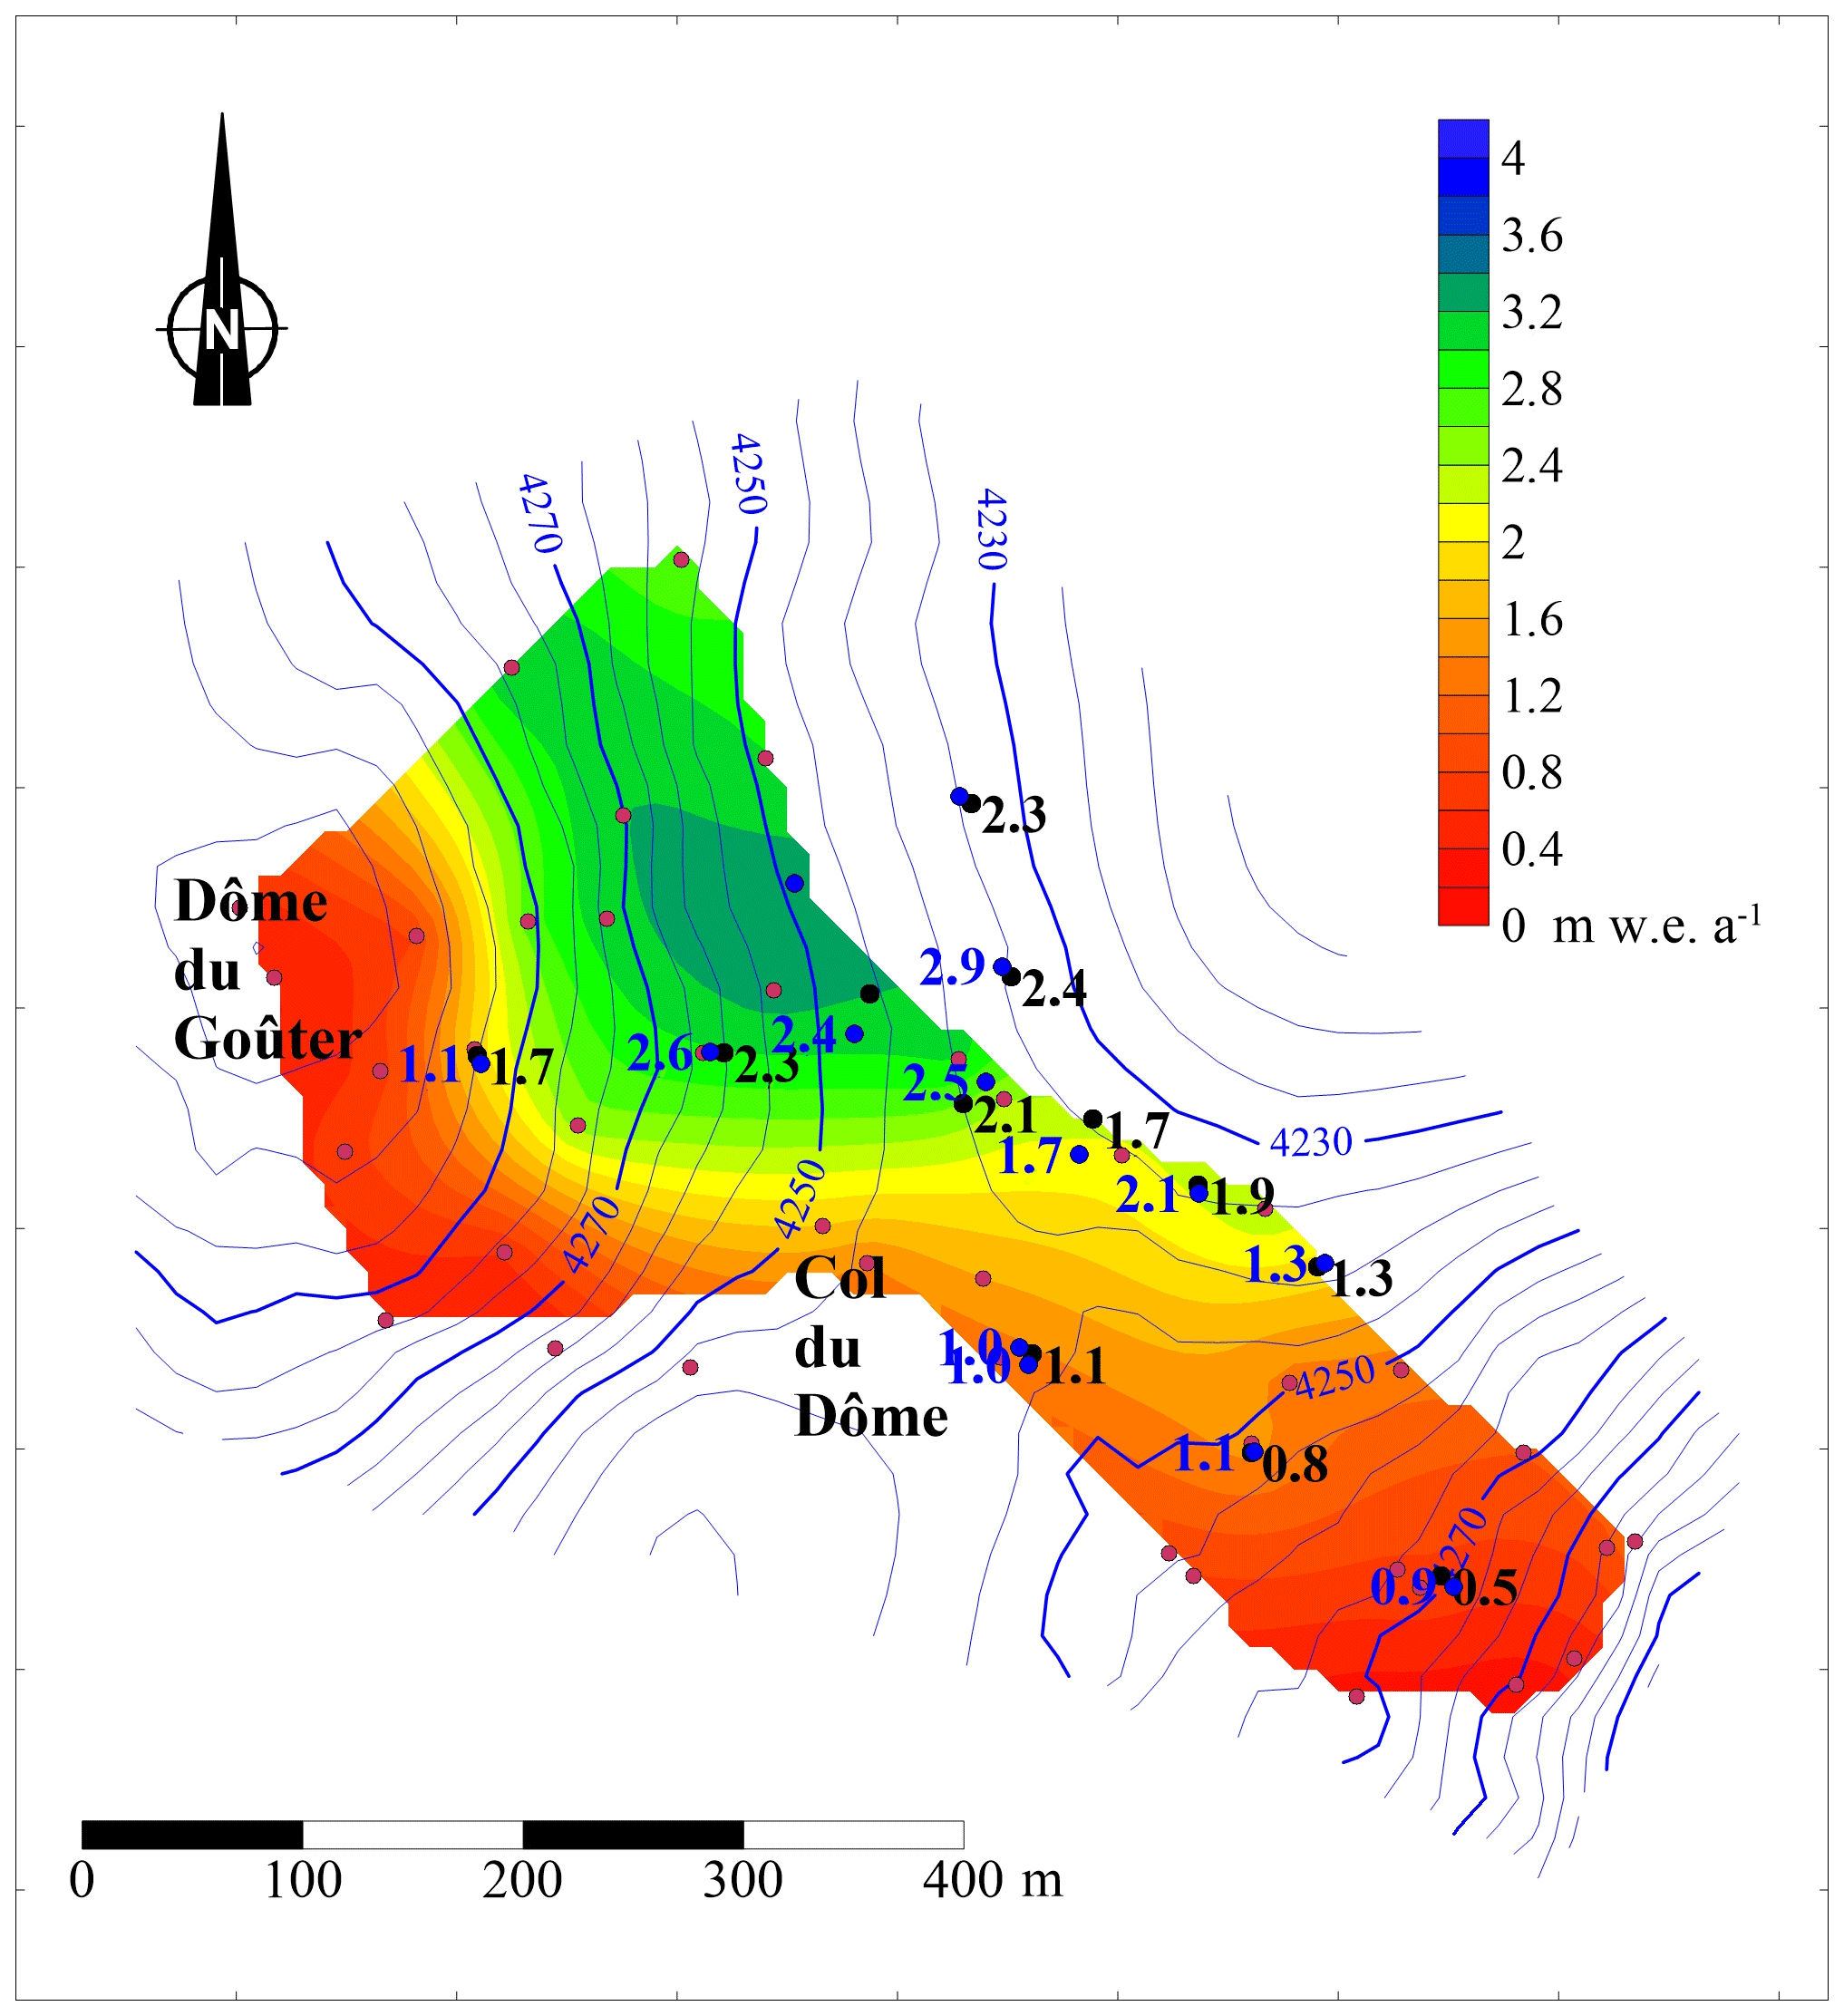
Figure 6Submergence velocities (m w.e. a−1) observed between 1997 and 2004 (red dots and colour scale), between 2009 and 2011 (blue dots and values), and between 2016 and 2017 (black dots and values). For the sake of clarity, the submergence velocity values of the 1997–2004 period have not been reported here.
3.4 Englacial temperature changes
Englacial temperatures were measured down to the bedrock at 126 m deep at the same location between 1994 and 2017 during four drilling campaigns (Fig. 8). Measurements reveal a strong warming of near-surface temperatures that likely started before 1994 given that the 1994 temperature profile was already far from steady-state conditions (Vincent et al., 2007a). We defined the near-surface temperature as the 10 m deep averaged temperature. The near-surface firn temperatures depend on complex mass and energy exchanges at the snow surface but are mainly driven by air temperature and meltwater refreezing. This near-surface temperature anomaly due to atmospheric warming was propagated down to the glacier bottom through advective and diffusive processes throughout the measurement period as shown in Fig. 8.
Note that between the surface and a depth of 20 m, the englacial temperature is affected by seasonal fluctuations (Gilbert et al., 2014a). At depths between 50 and 55 m, the englacial temperature changes are about +1.5 ∘C over the whole period (Fig. 8). For the deep layers, below 90 m, the englacial temperature profile does not show any change until after 2005. The warm wave reached the bedrock between 2005 and 2010. Over the whole period (1994–2017), the temperature change close to the bedrock (126 m deep) was +0.3 ∘C, which is larger than the uncertainty of the measurements. Note that the last temperature profile measured in 2017 revealed a stabilization of the 40 m depth temperature compared to the 2005 and 2010 profiles whereas the temperature anomaly continued to propagate down to the glacier base.
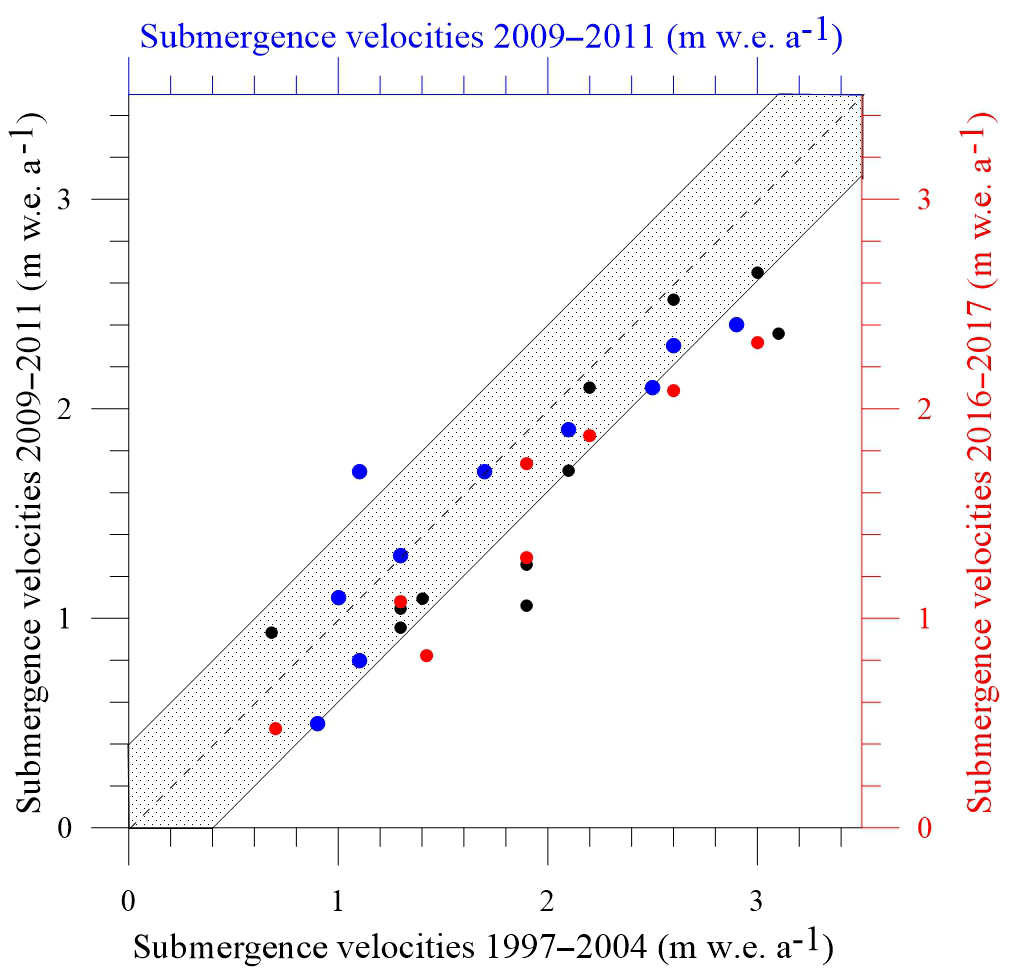
Figure 7Comparison of submergence velocities between the 1997–2004, 2009–2011, and 2016–2017 periods. The black dots correspond to the comparison between the 1997–2004 and 2009–2011 periods. The red dots correspond to the comparison between the 1997–2004 and 2016–2017 periods. The blue dots correspond to the comparison between the 2009–2011 and 2016–2017 periods. The grey area corresponds to a difference of ±0.4 m w.e. a−1 in relation to the bisector.
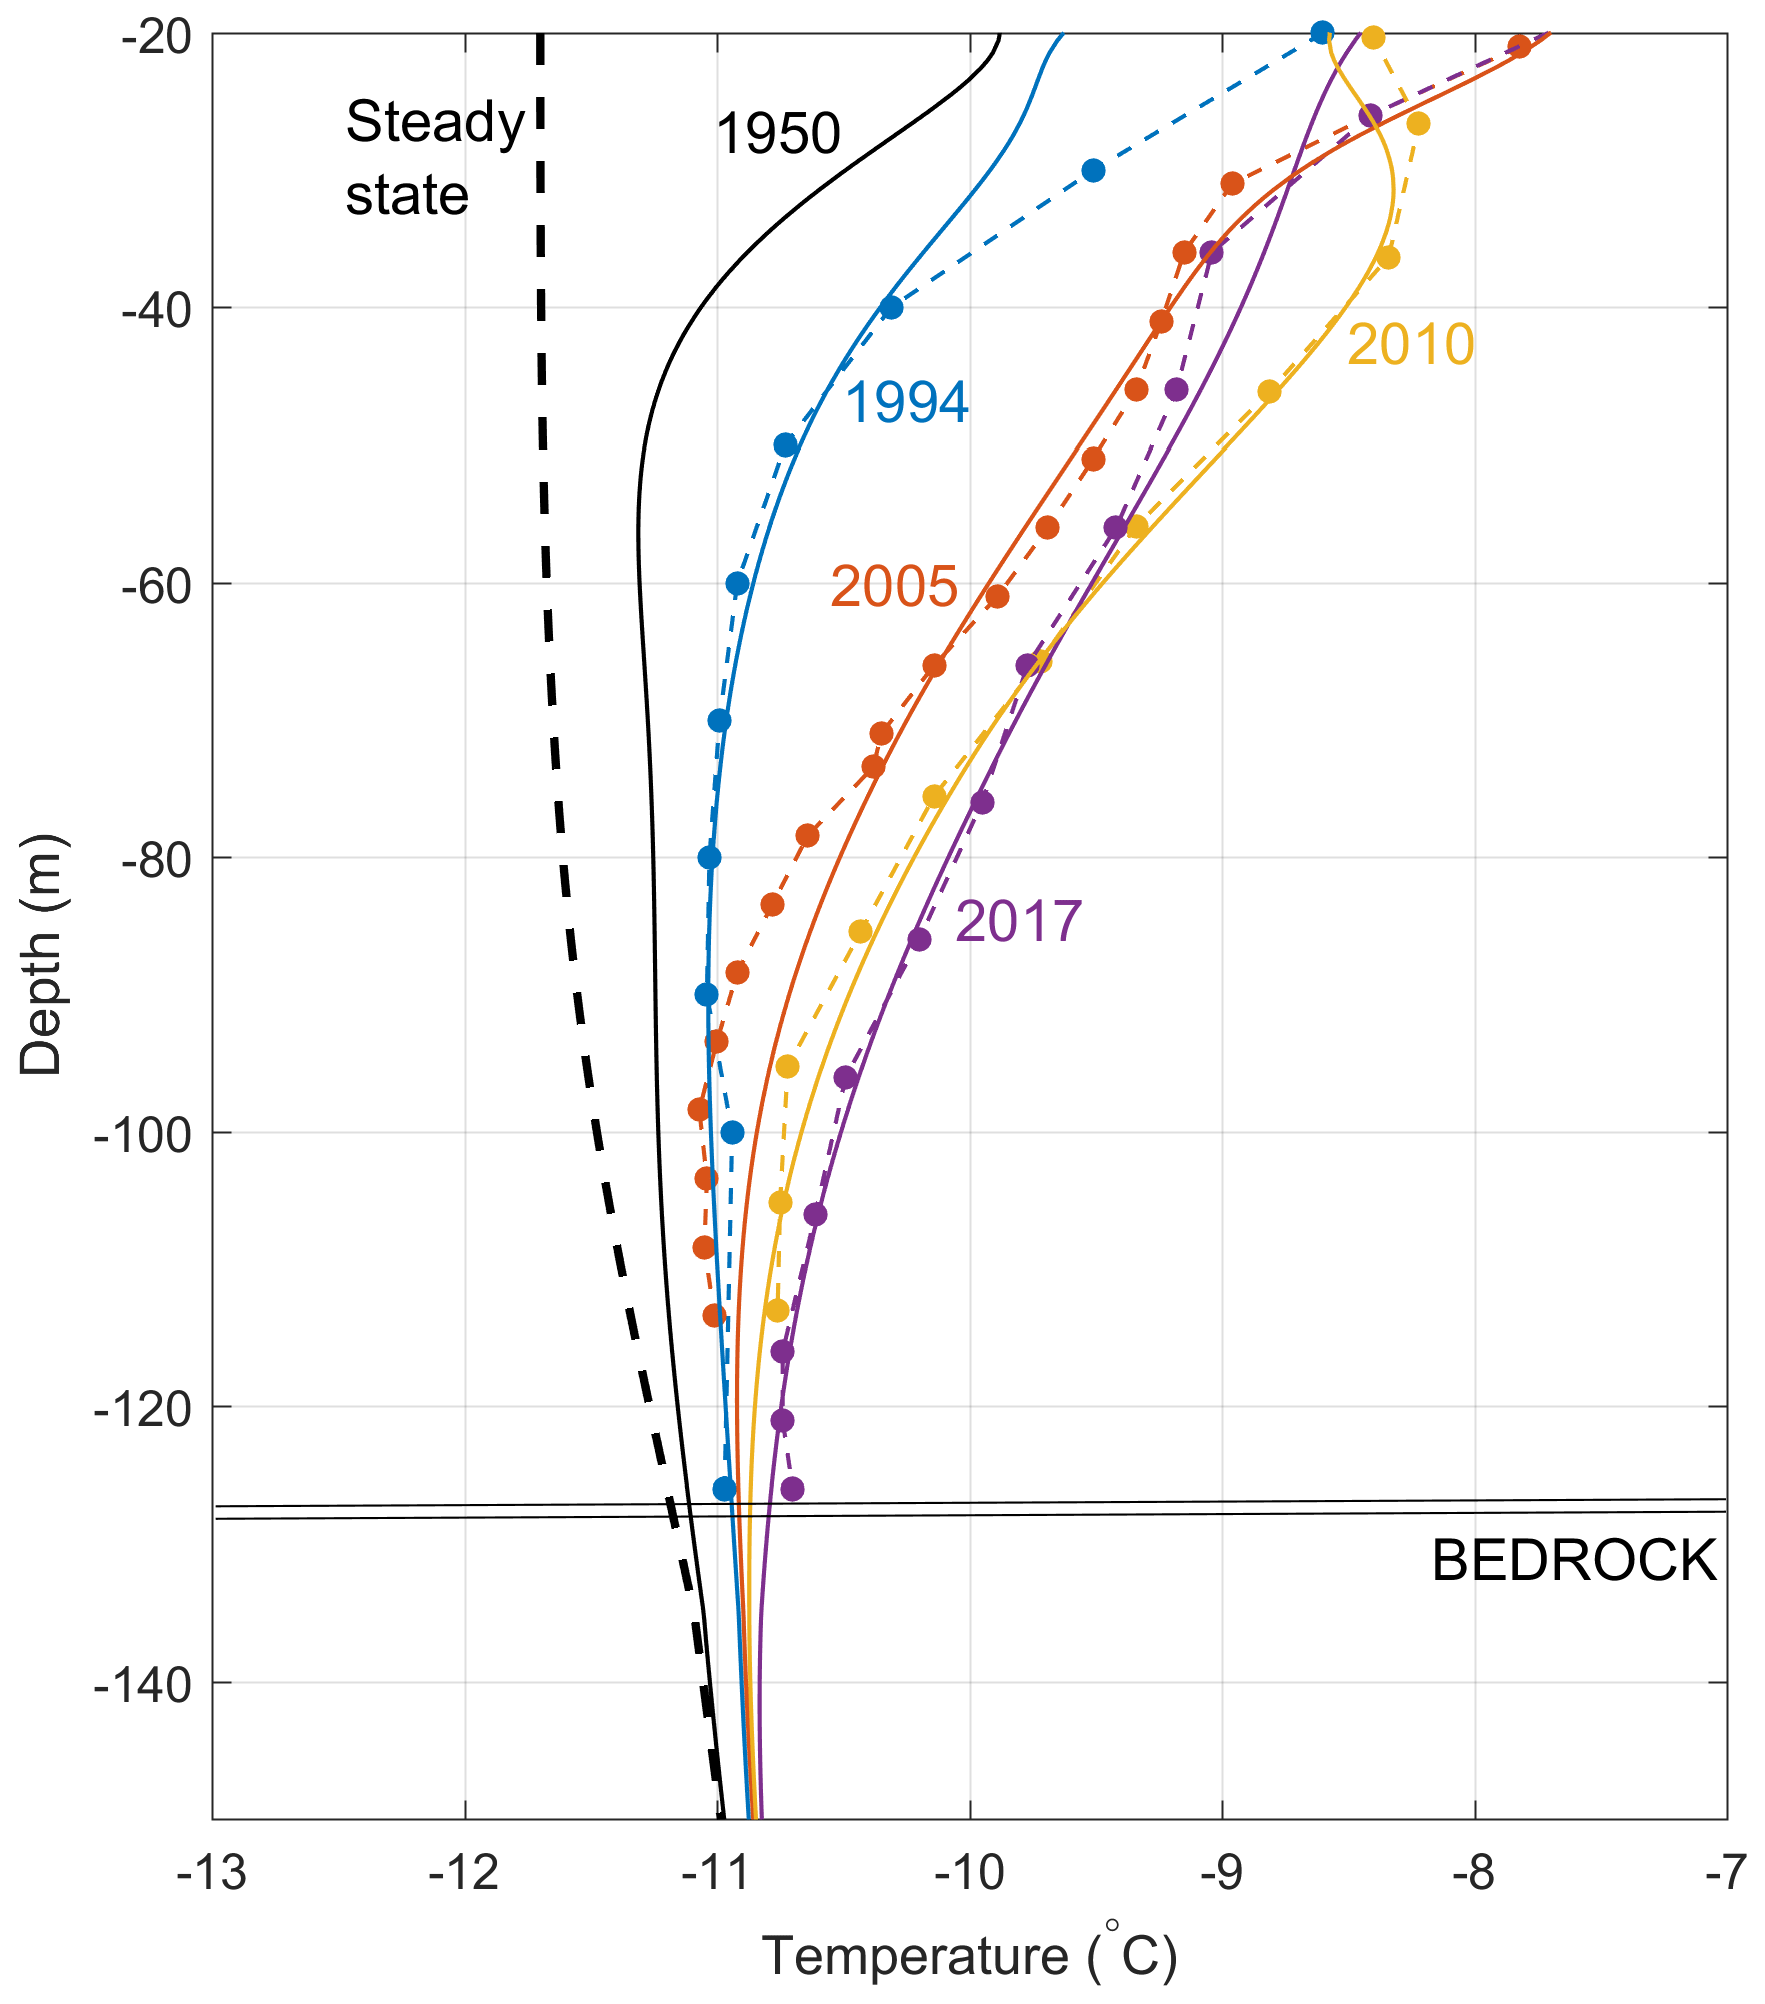
Figure 8Measured (dots) and modelled (continuous lines) englacial temperatures at the same location. The model is forced by air temperature data from the Lyon-Bron meteorological station, located 200 km from the drilling site. The steady-state profile is computed from a steady surface temperature and is used as the initial profile in 1907 for the model.
From numerical modelling, Gilbert et al. (2014a) showed that near-surface temperature warming can be explained by increasing surface melting event duration. They successfully modelled the temperature evolution up to 2010 using Lyon-Bron meteorological daily data (Météo-France station located 200 km west of the glacier) to force their model. The steady-state profile was computed from a steady-state surface temperature and is used as the initial profile in 1907 for the model. The steady surface temperature was tuned to produce the temperature measured in 1994 (Gilbert and Vincent, 2013). In the present study, we run the same model in order to see if the 40 m depth temperature stabilization in 2017 can be explained by the temperature change and the ensuing increasing frequency and duration of melting events. Results show that the englacial temperature change is still successfully modelled using the same forcing data and parameters (Fig. 8). This means that the 2017 stabilization observed at a depth of 40 m is a signature of an air temperature warming rate slowdown observed in the Lyon-Bron climatic data between 1998 and 2015 and well known on a global scale as “the global warming hiatus” (Meehl et al., 2014). Over the whole temperature profile between 20 and 126 m deep, the average increase in temperature is 0.93 ∘C between 1994 and 2017. By integrating the internal energy change (ρCpΔT) over the whole glacier thickness, we estimate that the glacier absorbed 3.9×10⁸ J m−2 between the pre-industrial climate (steady state in our simulation) and 2017, where ρ is the firn density (kg m−3), Cp the heat capacity (J kg−1 K−1), and ΔT the measured temperature change (K). This is equivalent to 1.17 m w.e. of surface melting.
3.5 Past changes inferred from borehole temperature inversion
Although it is not the main objective of our study, we compared climate change at Col du Dôme with lower elevation observations, in order to update the findings of Gilbert and Vincent (2013) by including the new temperature profile (measured in 2017) in the inversion procedure. The model is based on Bayesian inference and is fully described in Gilbert and Vincent (2013). The reconstruction of the near-surface temperature at the drilling site (Fig. 9a) includes the four temperature profiles presented here (1994, 2005, 2010, and 2017). It shows a strong and fast change occurring between 1980 and 1998 followed by a stabilization or slight cooling until 2015. Near-surface temperatures are estimated to be 2.5∘ warmer than those in the pre-industrial steady state. The atmospheric temperature reconstruction (Fig. 9b) is based here on the simultaneous inversion of eight different temperature profiles: the four presented here and four others from two different locations (Gilbert and Vincent, 2013). The englacial temperature measurement sites are shown in Fig. 1. Our analysis confirms that englacial temperature at Col du Dôme showed a break in the warming trend during the early 2000s, similarly to what was observed at lower elevations in the region and at a global scale.
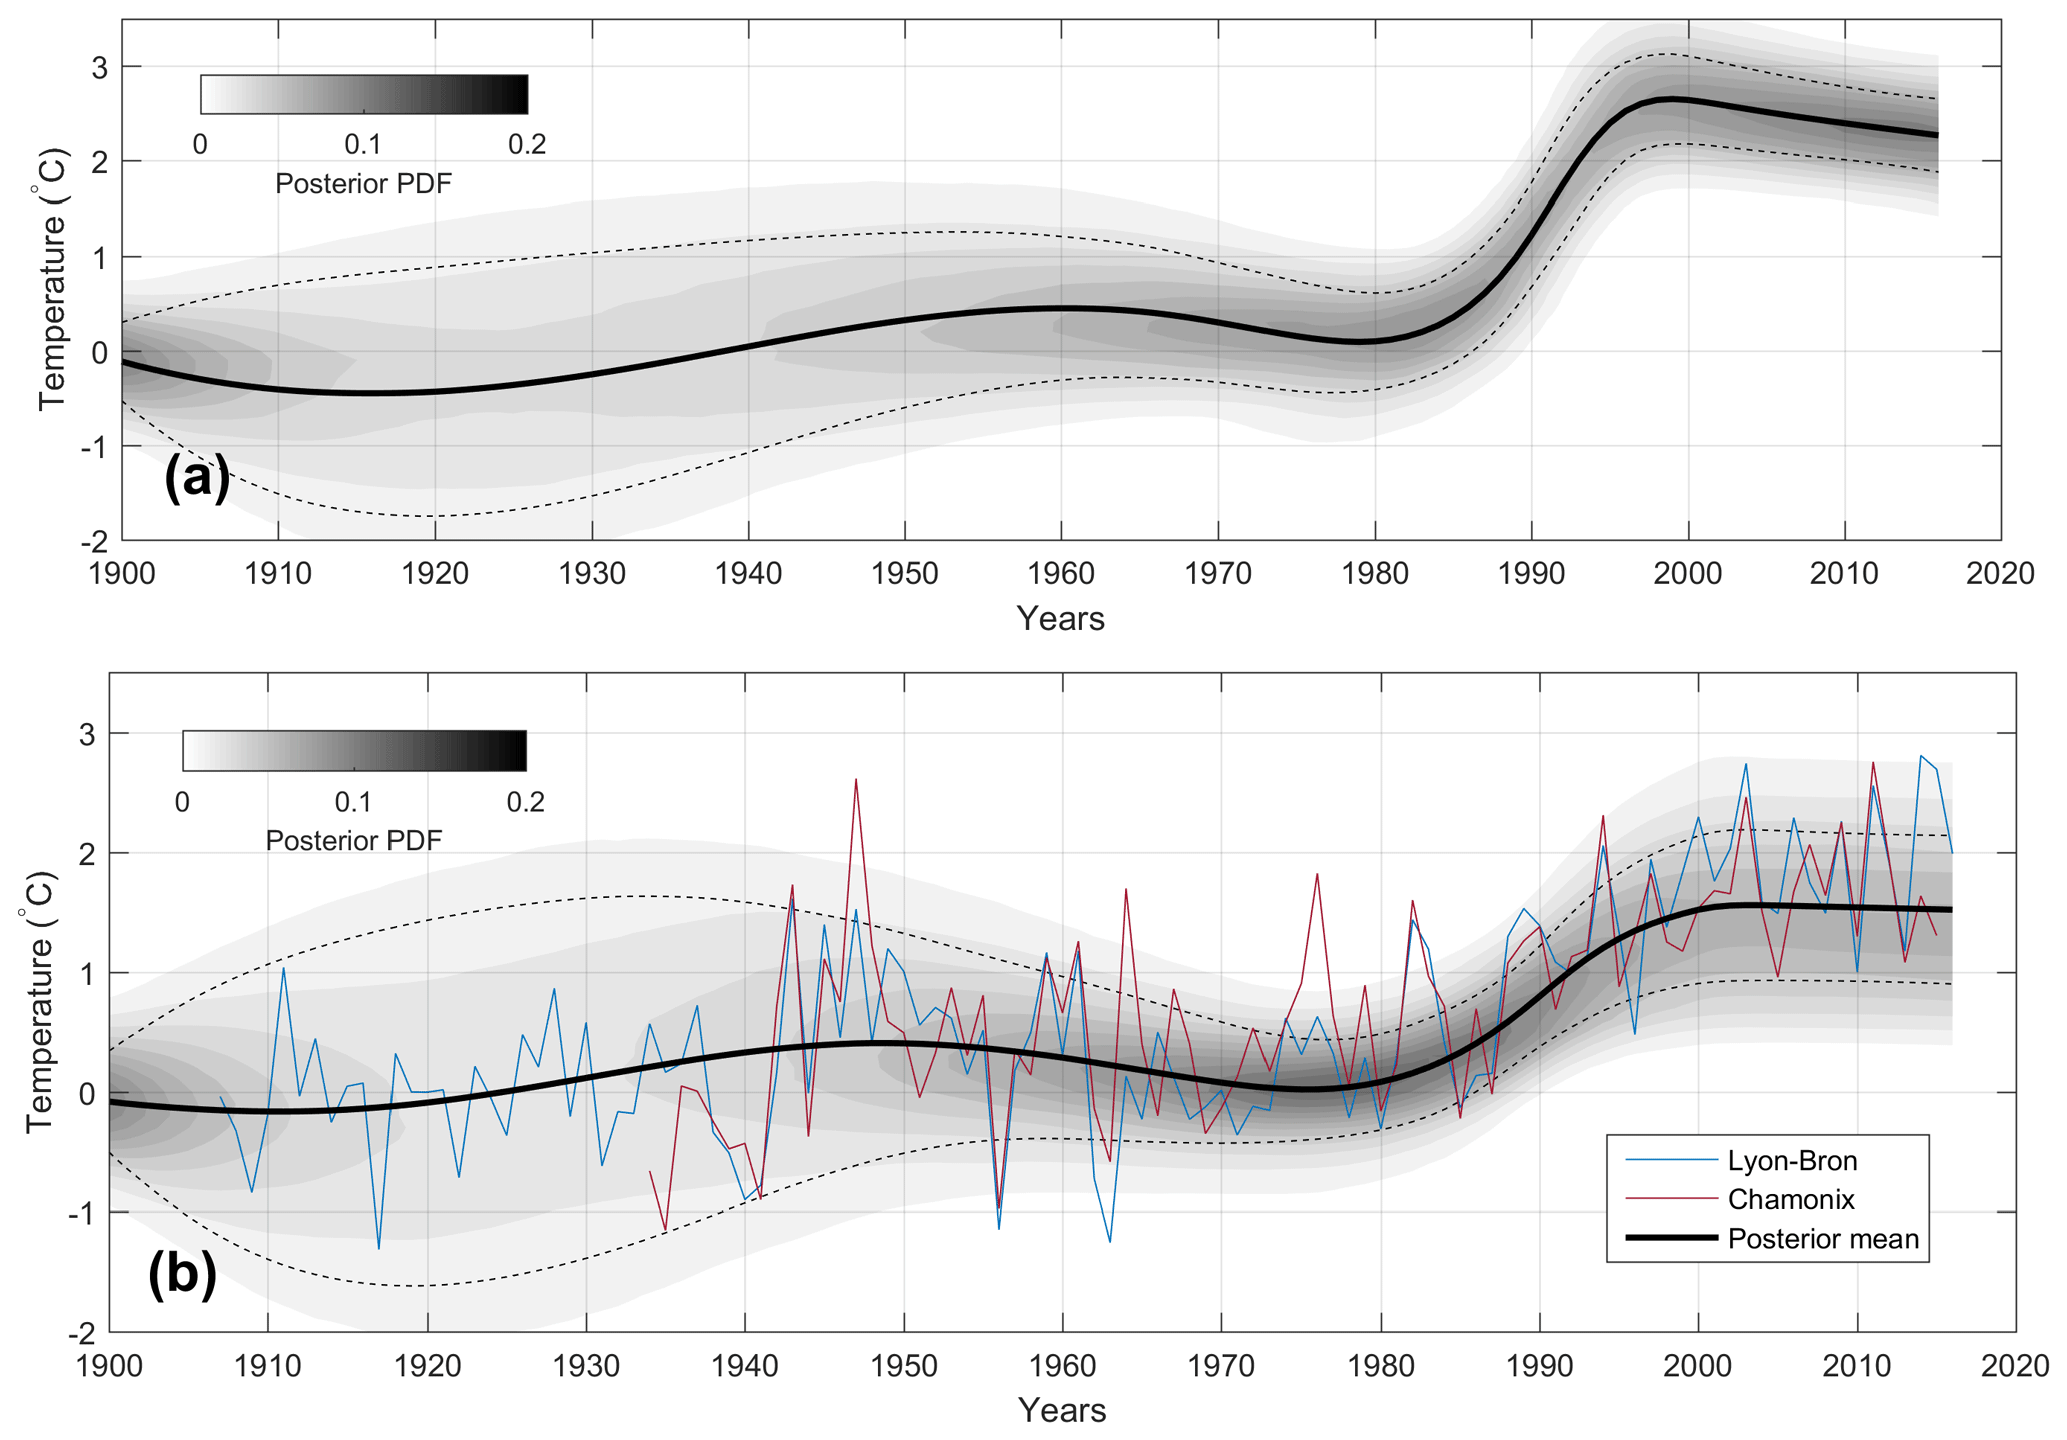
Figure 9(a) Temporal evolution of the near-surface temperature reconstructed at the drilling site since 1900 (black bold line). (b) Past atmospheric temperature reconstructed from all measured temperature profiles in the Col du Dôme area (black bold line) compared to Lyon-Bron (200 m a.s.l., blue line) and Chamonix (1000 m a.s.l., red line) temperature records. In both plots, the grey scale represents the posterior probability function and the dashed line is its standard deviation.
The glacier thickness changes observed between 1993 and 2017 are small and non-uniform. Over the whole area, the average thickness has decreased by 2.65 m, which corresponds to a reduction of 2.4 % of the thickness over this drainage basin (i.e. ratio of 2.65∕111 m). Note that this thickness change is very small compared to the thickness change of 80 to 100 m observed at low altitudes (about 2000 m a.s.l.) on glaciers in the Mont Blanc area over the last 2 decades (Berthier et al., 2014; Vincent et al., 2014). At the flux gate shown in Fig. 1, the thickness has decreased by 2 % (i.e. 2.56∕131 m). Over the same period, the surface horizontal ice flow velocities have decreased by 11 % at this flux gate. Three-dimensional modelling with firn-specific rheology performed by Gilbert et al. (2014b) shows that the mean horizontal velocity is 70 % of the surface horizontal velocity. The mean horizontal velocity of the cross section can therefore be estimated to have decreased by 7.7 %. Consequently the ice flux has decreased by about 9.7 % between 1993 and 2017. An independent estimation shows that the submergence velocities have decreased by 21 % over the whole drainage basin. These independent results seem to reveal a slight change in surface mass balance over the whole period. According to the ice flux calculations, the surface mass balance has decreased by about 10 %. The greater change in ice flow velocity compared to the change in thickness is not surprising. Indeed, the glacier is frozen to its bed and no sliding occurs. According to Glen's law and the laminar flow assumption (Cuffey and Paterson, 2010, Eq. 8.36, p. 310), the depth-averaged horizontal ice velocity is proportional to α3 and H4 and therefore the ice flux to α3 and H5, where α is the surface slope and H is the glacier thickness. This means that, to a first-order approximation, the relative change in ice thickness (%) is a power one-fifth of the relative flux change or relative change in surface mass balance (%) in the absence of large slope changes. Similarly, the relative change in ice flow velocity is a power four-fifths of the relative change in surface mass balance. Assuming a change of 10 % in surface mass balance, there should be a change of 2 % in ice thickness and 8 % in ice flow velocity. These estimations are consistent with our observations. The ice thickness is therefore not very sensitive to surface mass balance. Conversely, the ice flow velocity is more sensitive and this explains the larger relative changes in ice flow velocities we observed compared to the changes in thickness.
The change in surface mass balance we hardly detected could be related to a change in precipitation over the last 2 decades. Indeed, the surface mass balance at these high elevations is driven by changes in precipitation (Vincent et al., 2007b). We therefore analysed atmospheric precipitation data from the SAFRAN reanalysis available back to 1958 (Durand et al., 2009) and snow accumulation at lower altitudes from Argentière and Mer de Glace glaciers. This analysis reveals that annual precipitation has decreased by about 10 % in the Mont Blanc area over the last 2 decades (Fig. 10). The snow accumulation rates observed at Argentière and Mer de Glace glaciers show similar trends, although these accumulation rates are related to the winter season only.
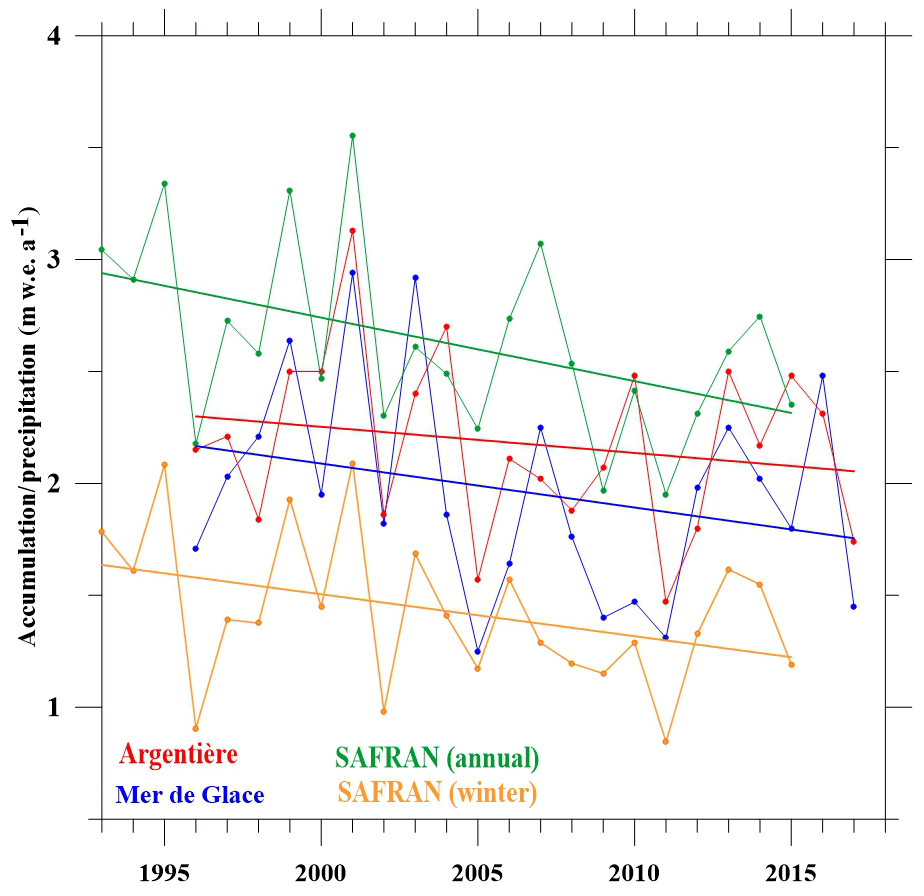
Figure 10Winter mass balance of Argentière and Mer de Glace glaciers over the period 1995–2017 and annual and winter precipitation (m w.e.) reanalysis over the period 1993–2015.
A source of uncertainty in submergence velocities is related to the snow density. Indeed, the submergence velocity calculations require the snow and firn density values over the depth at which the stakes have been set up. The snow density was not measured for each campaign. For our calculations, we assumed that the snow density did not change with time. The long-term change of the firn density was assessed from drilling core measurements from holes drilled in 1994 and 2012 (see Supplement, Fig. S1). From these measurements, it can be seen that the snow density did not change significantly over the first 30 m. It means that the calculated submergence velocities are not affected. However, we can detect a mean relative density difference of 0.016 between the surface and 65 m deep (Fig. S1) that corresponds to the firn accumulated between 1994 and 2012. The modelled average surface melting shows an increase of 0.02 m w.e. a−1 between 1994 and 2012 compared to the period 1976–1994. For a net annual accumulation of 2.7 m w.e. a−1, it would correspond to an increase of 0.004 in relative density, which is lower than the observed change not detectable from density measurements. It is therefore unlikely that an increase in melting is responsible for the observed slight density increase which instead may be related to reduced snow accumulation.
Over the entire 20th century, a previous study (Vincent et al., 2007b) showed that the thickness of glaciers at these high elevations did not change significantly. It suggested that surface accumulation rates did not change significantly over the entire 20th century, although it does not exclude decadal periods with significant accumulation changes. Our results tend to show that the surface mass balance has changed slightly since the beginning of the 21st century. Despite this small change, this glacier can be considered to have been close to steady-state conditions over the last 100 years.
In opposition to surface mass balance, englacial temperatures are strongly changing in response to atmospheric warming. This highlights the non-linear response of near-surface temperature to atmospheric forcing due a modified surface energy balance when surface melting occurs (Gilbert et al., 2014a). As surface melting events become more and more frequent, the energy absorbed by the glacier is largely enhanced, resulting in a strong warming signal observed in the borehole temperature profiles. Our simulation and inversion shows that the observed temperature profiles reflect a slowdown in the atmospheric warming rate, which is observed at lower elevation at both local and global scales. The slight near-surface temperature cooling trend inferred in our inversion (Fig. 9a) may indicate a negative feedback linked to increasing surface melting that could be superimposed on the atmospheric forcing. Indeed, the increasing refreezing rate could start to create impermeable ice layers that prevent meltwater from percolating deeply in the firn. As the refreezing would occur closer to the surface in this case, the energy added by latent heat would be lost in winter in comparison with the case where latent heat is released deeper, below an insulating snow layer. This effect would significantly limit the effect of meltwater refreezing on firn temperature. With the atmospheric warming rate currently increasing again, future observations will provide the opportunity to evaluate the efficiency of this potential feedback.
Our comparison of two digital elevation models produced in 1993 and 2017 over 0.12 km2 at Col du Dôme shows that ice thickness changes were very small (< 7 m) over this period at this altitude (4250 m a.s.l.) in the Mont Blanc area. Ice flow velocity measurements show that the horizontal velocities have decreased by about 11 %. This leads to a decrease in ice flux of 9.7 %. Although the surface mass balance observations are not available over the whole period, the ice flux calculations suggest a decrease in surface mass balance. This is confirmed by the analysis of submergence velocities which decreased by 21 % between 1993 and 2017. The overall analysis suggests that surface mass balance might have decreased by about 10 % over this period. Given that ablation is almost negligible compared to snow accumulation (Gilbert et al., 2014a), the change in surface mass balance is likely due to less snow accumulation and consequently to a change in precipitation. This is consistent with the meteorological reanalysis and winter snow accumulation measurements performed at lower altitudes.
As opposed to thickness and surface mass balance changes, the englacial temperatures reveal strong changes. The englacial temperature averaged over the entire profile increased by 0.9 ∘C between 1994 and 2017. Numerical modelling with meteorological input data shows that the temperature profile was already far from steady state in 1994 in response to a warming phase that started in 1980. The near-surface temperature warming over the last 3 decades propagated through to the glacier and reached the bedrock between 2005 and 2010. Finally, our borehole temperature inversion shows an air temperature change very similar to that observed at low elevations in the Alps, including a warming hiatus occurring during the early 2000s.
In the future, near-surface temperature warming should continue to propagate down into the glacier. This warming could affect the stability of cold alpine hanging glaciers located on steep slopes and currently frozen to their bed. The progressive changes in thermal regime of these high-elevation glaciers cannot be detected from the surface.
For hanging glaciers with basal ice temperatures close to the melting point, ice flow velocity monitoring is recommended, particularly when glacier collapse could jeopardize life and property in the valley below.
The englacial temperature data and DEM data can be accessed upon request by contacting Christian Vincent (christian.vincent@univ-grenoble-alpes.fr) or directly from the GLACIOCLIM database (https://glacioclim.osug.fr).
The supplement related to this article is available online at: https://doi.org/10.5194/tc-14-925-2020-supplement.
LP, PG, VM, PP, and ELM drilled the ice cores. OL, DS, and CV performed the geophysical and geodetic measurements. AG performed the numerical modelling. CV supervised the study and wrote the paper. All co-authors contributed to discussion of the results.
The authors declare that they have no conflict of interest.
The 2016 ice coring was conducted with a lightweight ice coring system (http://cryosphere.co, last access: February 2020). We thank Yves Durand, Gerald Giraud, and Samuel Morin (CNRMGAME/CEN, Météo-France) for providing the SAFRAN data and meteorological data from Lyon-Bron. We would also like to thank everyone who helped in collecting data during the glacier field campaigns, including data collected in the framework of GLACIOCLIM programme. We thank the Editor Valentina Radic and the reviewers Jon Ove Hagen and Veijo Pohjola, whose thorough comments and suggestions improved the quality of the manuscript.
We are grateful to H. Harder for reviewing the English in a previous version of the paper.
ACQWA European programme (EU Framework Programme 7), Ice Memory project and C2FN (Centre de Carottage et de Forage National).
This paper was edited by Valentina Radic and reviewed by Jon Ove Hagen and Veijo Pohjola.
Aschwanden, A. and Blatter, H.: Mathematical modeling and numerical simulation of polythermal glaciers, J. Geophys. Res., 114, F01027, https://doi.org/10.1029/2008JF001028, 2009.
Berthier, E., Vincent, C., Magnússon, E., Gunnlaugsson, Á. Þ., Pitte, P., Le Meur, E., Masiokas, M., Ruiz, L., Pálsson, F., Belart, J. M. C., and Wagnon, P.: Glacier topography and elevation changes derived from Pléiades sub-meter stereo images, The Cryosphere, 8, 2275–2291, https://doi.org/10.5194/tc-8-2275-2014, 2014.
Cuffey, K. and Paterson, W. B. S.: The Physics of Glaciers, 4th ed., Academic, Amsterdam, 2010.
Durand, Y., Laternser, M., Giraud, G., Etchevers, P., Lesaffre, B., and Mérindol, L.: Reanalysis of 44 Yr of Climate in the French Alps (1958–2002): Methodology, Model Validation, Climatology, and Trends for Air Temperature and Precipitation, J. Appl. Meteorol. Clim., 48, 429–449, https://doi.org/10.1175/2008JAMC1808.1, 2009.
Gardner, A. S., Moholdt, G., Cogley, J. G., Wouters, B., Arendt, A. A., Wahr, J., Berthier, E., Pfeffer, T., Kaser, G., Hock, R., Ligtenberg, S. R. M., Bolch, T., Sharp, M., Hagen, J. O., van den Broeke, M. R., and Paul, P.: A reconciled estimate of glacier contributions to sea level rise: 2003–2009, Science, 340, 852–857, https://https://doi.org/10.1126/science.1234532, 2013.
Gilbert, A. and Vincent, C.: Atmospheric temperature changes over the 20th century at very high elevations in the European Alps from englacial temperatures, Geophys. Res. Lett., 40, 2102–2108, https://doi.org/10.1002/grl.50401, 2013.
Gilbert, A., Wagnon, P., Vincent, C., Ginot, P., and Funk, M.: Atmospheric warming at a high elevation tropical site revealed by englacial temperatures at Illimani, Bolivia (6340 m above sea level, 16∘ S, 67∘ W), J. Geophys. Res., 115, D10109, https://doi.org/10.1029/2009JD012961, 2010.
Gilbert, A., Vincent, C., Six, D., Wagnon, P., Piard, L., and Ginot, P.: Modeling near-surface firn temperature in a cold accumulation zone (Col du Dôme, French Alps): from a physical to a semi-parameterized approach, The Cryosphere, 8, 689–703, https://doi.org/10.5194/tc-8-689-2014, 2014a.
Gilbert, A., Gagliardini, O., Vincent, C., and Wagnon, P.: A 3-D thermal regime model suitable for cold accumulation zones of polythermal mountain glaciers, J. Geophys. Res., 119, 1876–1893, https://doi.org/10.1002/2014JF003199, 2014b.
Hoelzle, M., Darms, G., Lüthi, M. P., and Suter, S.: Evidence of accelerated englacial warming in the Monte Rosa area, Switzerland/Italy, The Cryosphere, 5, 231–243, https://doi.org/10.5194/tc-5-231-2011, 2011.
Hooke, R. L.: Principles of Glacier Mechanics, Cambridge University Press, Cambridge, United Kingdom, 429 pp., 2005.
Huss, M.: Extrapolating glacier mass balance to the mountain-range scale: the European Alps 1900–2100, The Cryosphere, 6, 713–727, https://doi.org/10.5194/tc-6-713-2012, 2012.
Hutter, K.: Theoretical Glaciology: Material Science of Ice and the Mechanics of Glaciers and Ice Sheets, edited by: Reidel, D., Dordrecht, the Netherlands, 1983.
Lüthi, M. and Funk, M.: Modelling heat flow in a cold, high-altitude glacier: interpretation of measurements from Colle Gnifetti, Swiss Alps, J. Glaciol., 47, 314–324, 2001.
Meehl, G. A., Teng, H., and Arblaster, J. M.: Climate model simulations of the observed early-2000s hiatus of global warming, Nat. Clim. Change, 4, 898–902, https://doi.org/10.1038/nclimate2357, 2014.
Narod, B. B. and Clarke, G. K. C.: Miniature high-power impulse transmitter for radio-echo sounding, J. Glaciol., 40, 190–194, 1994.
Oerlemans, J.: Glaciers and Climate change, Balkema Publishers, Lisse, 2001.
Suter, S.: Cold firn and ice in the Monte Rosa and Mont Blanc areas (spatial occurence, surface energy balance and climatic evidence), PhD thesis, ETH Zurich, 2002.
Thibert, E., Dkengne Sielenou, P., Vionnet, V., Eckert, N., and Vincent, C.: Causes of glacier melt extremes in the Alps since 1949, Geophys. Res. Lett., 45, 817–825, https://doi.org/10.1002/2017GL076333, 2018.
Vincent, C., Vallon, M., Pinglot, J. F., Funk, M., and Reynaud, L.: Snow accumulation and ice flow at Dôme du Goûter (4300 m), Mont Blanc, French Alps, J. Glaciol., 43, 513–521, 1997.
Vincent, C., Le Meur, E., Six, D., Funk, M., Hoelzle, M., and Preunkert, S.: Very high elevation Mont Blanc glaciated areas not affected by the 20th century climate change, J. Geophys. Res., 112, D09120, https://doi.org/10.1029/2006JD007407, 2007a.
Vincent, C., Le Meur, E., Six, D., Possenti, P., Lefebvre, E., and Funk, M.: Climate warming revealed by englacial temperatures at Col du Dôme (4250 m, Mont-Blanc area), Geophys. Res. Lett., 34, L16502, https://doi.org/10.1029/2007GL029933, 2007b.
Vincent C., Harter, M., Gilbert, A., Berthier, E., and Six, D.: Future fluctuations of Mer de Glace, French Alps, assessed using a parameterized model calibrated with past thickness changes, Ann. Glaciol., 55, 15–24, https://doi.org/10.3189/2014AoG66A050, 2014.
Wagner, S.: Dredimensionale modellierung zweir Gletscher und deformations analyse von eisreichem permafrost, PhD thesis, ETH, Zurich, Dissertation 10659, 1994.
WGMS: Global glacier change bulletin no. 1 (2012–2013), edited by: Zemp, M., Gärtner-Roer, Nussbaumer, S. U., Hüsler, F., Machgut, H., Mölg, N., Paul, F., and Hoelzle, M., ICSU(WDS)/IUGG(IASC)/UNEP/UNESCO/WMO, World Glacier Monitoring Service, Zürich, Switzerland, 230 pp., 2015.
Zemp, M., Huss, M., Thibert, E., Eckert, N., McNabb, R., Huber, J., Barandun, M., Machguth, H., Nussbaumer, S. U., Gärtner-Roer, I., Thomson, L., Paul, F., Maussion, F., Kutuzov, S., and Cogley, J. G.: Global glacier mass changes and their contributions to sea-level rise from 1961 to 2016, Nature, 568, 382–386, https://doi.org/10.1038/s41586-019-1071-0, 2019.