the Creative Commons Attribution 4.0 License.
the Creative Commons Attribution 4.0 License.
 | 27 May 2019
Rapid retreat of permafrost coastline observed with aerial drone photogrammetry
Andrew M. Cunliffe
George Tanski
Boris Radosavljevic
William F. Palmer
Torsten Sachs
Hugues Lantuit
Jeffrey T. Kerby
Isla H. Myers-Smith
Permafrost landscapes are changing around the Arctic in response to climate warming, with coastal erosion being one of the most prominent and hazardous features. Using drone platforms, satellite images, and historic aerial photographs, we observed the rapid retreat of a permafrost coastline on Qikiqtaruk – Herschel Island, Yukon Territory, in the Canadian Beaufort Sea. This coastline is adjacent to a gravel spit accommodating several culturally significant sites and is the logistical base for the Qikiqtaruk – Herschel Island Territorial Park operations. In this study we sought to (i) assess short-term coastal erosion dynamics over fine temporal resolution, (ii) evaluate short-term shoreline change in the context of long-term observations, and (iii) demonstrate the potential of low-cost lightweight unmanned aerial vehicles (“drones”) to inform coastline studies and management decisions. We resurveyed a 500 m permafrost coastal reach at high temporal frequency (seven surveys over 40 d in 2017). Intra-seasonal shoreline changes were related to meteorological and oceanographic variables to understand controls on intra-seasonal erosion patterns. To put our short-term observations into historical context, we combined our analysis of shoreline positions in 2016 and 2017 with historical observations from 1952, 1970, 2000, and 2011. In just the summer of 2017, we observed coastal retreat of 14.5 m, more than 6 times faster than the long-term average rate of 2.2±0.1 m a−1 (1952–2017). Coastline retreat rates exceeded 1.0±0.1 m d−1 over a single 4 d period. Over 40 d, we estimated removal of ca. 0.96 m3 m−1 d−1. These findings highlight the episodic nature of shoreline change and the important role of storm events, which are poorly understood along permafrost coastlines. We found drone surveys combined with image-based modelling yield fine spatial resolution and accurately geolocated observations that are highly suitable to observe intra-seasonal erosion dynamics in rapidly changing Arctic landscapes.
- Article
(16743 KB) -
Supplement
(967 KB) - BibTeX
- EndNote


The Arctic is the most rapidly warming region on Earth (Richter-Menge et al., 2017; Serreze and Barry, 2011). Increasing temperatures result in fundamental changes to the physical and biological processes that shape these permafrost landscapes (IPCC, 2013). Permafrost in the Northern Hemisphere is substantially degrading in many high-latitude locations, resulting in direct and indirect impacts on natural systems as well as human activities and infrastructure (Schuur et al., 2015; UNEP, 2012). Coastal erosion is prevalent along Arctic coastlines in the western North American Arctic and all of Siberia, and is one of the key processes degrading permafrost (Lantuit et al., 2012). Coastal erosion mobilises large amounts of sediment, organic matter, and nutrients from permafrost (Lantuit et al., 2012; Overduin et al., 2014; Retamal et al., 2008; Wegner et al., 2015), which are released into the nearshore waters and affect marine ecosystems (Bell et al., 2016; Dunton et al., 2006; Fritz et al., 2017). Several studies have reported signs of accelerating coastal erosion rates at locations around the Arctic, including the western Arctic (Barnhart et al., 2014; Jones et al., 2008, 2009b; Mars and Houseknecht, 2007; Radosavljevic et al., 2016) and Siberia (Günther et al., 2015; Kritsuk et al., 2014; Novikova et al., 2018; Ogorodov et al., 2016). However, the spatio-temporal resolution of circum-Arctic studies limits inferences of widespread changes in coastal erosion rates (Fritz et al., 2017). Erosion plays a critical role in the longer-term evolution of permafrost coastlines (Barnhart et al., 2014) and biogeochemical cycling in coastal zones (Fritz et al., 2017; Semiletov et al., 2016; Vonk et al., 2012), and the majority of permafrost erosion studies compare multi-annual coastline changes to infer annualised erosion rates over periods of several years (Irrgang et al., 2018; Overduin et al., 2014). However, such coarse observation frequencies neglect the intra-seasonal dynamics during the open-water season, including episodic thaw and abrupt erosion events. Knowledge of these intra-seasonal dynamics is essential to understand the processes and drivers controlling erosion patterns over time and for better projecting future erosion rates in light of ongoing Arctic changes (Obu et al., 2016; Vasiliev et al., 2005).
The use of remote sensing to measure changes in permafrost landscapes is increasingly common (Novikova et al., 2018). However, optical image coverage in high-latitude regions has historically been widely limited to relatively coarse temporal and spatial resolutions, due to frequent cloud cover and logistical challenges that limit both satellite observations and aerial surveys (Hope et al., 2004; Stow et al., 2004). Recently there has been a widespread interest in the use of lightweight drones, also known as remotely piloted aerial systems or unmanned aerial vehicles (UAVs), to enable landscape managers and researchers to self-service their data collection needs (Klemas, 2015; Westoby et al., 2012), thus democratising data acquisition (DeBell et al., 2015). Lightweight drones combined with image-based modelling can provide highly accurate and detailed measurements of rapidly changing features. These aerial observations can be obtained at user-determined frequencies (e.g. weekly, daily, or even hourly if weather conditions permit), using relatively inexpensive tools such as suitable multirotor drones available for less than USD 1000. Over the last few years, drone surveys are increasingly used for monitoring coastal systems (Casella et al., 2016; Duffy et al., 2017b; Mancini et al., 2013; Turner et al., 2016). However, there have been very few examples of their application to monitor the ongoing rapid changes along permafrost coastlines (although see Whalen, 2017; Whalen et al., 2017).
In this study, we used repeated drone surveys to investigate short-term dynamics of an eroding permafrost coastline at Qikiqtaruk – Herschel Island (Yukon Territory) in the Canadian Beaufort Sea across a 13-month period. We investigated what additional insights are available from observing shoreline positions at fine spatial and temporal resolution, whether fine-resolution observations of shoreline change could be related to meteorological and oceanographic variables, and compared intra-seasonal shoreline change with historical shoreline changes over the last 65 years. For our study area, we hypothesise that the erosion of the observed permafrost coastline adjacent to the settlement on Qikiqtaruk – Herschel Island varies greatly between years and continuing erosion could threaten key infrastructure for human activities on the island.
2.1 Study site
Qikiqtaruk – Herschel Island is located in the western Canadian Arctic in the Beaufort Sea (69∘ N, 139∘ W, Fig. 1a). The island is an ice-thrust push moraine formed during the maximal advance of the Laurentide ice sheet (Fritz et al., 2012; Pollard, 1990), and is underlain by ice-rich continuous permafrost (Brown et al., 1997; Lantuit and Pollard, 2008; Obu et al., 2016). Low spits composed of coarse material occur on the east and west sides of the island (Couture et al., 2018). The mean annual air temperature is −11 ∘C (1970–2000) and the mean annual precipitation is ca. 200 mm a−1 (Burn, 2012). The average coastal erosion rate for the whole of Qikiqtaruk – Herschel Island was 0.45 m a−1 between 1970 and 2000 (Lantuit and Pollard, 2005; Obu et al., 2015) and 0.68 m a−1 between 2000 and 2011 (Obu et al., 2016).
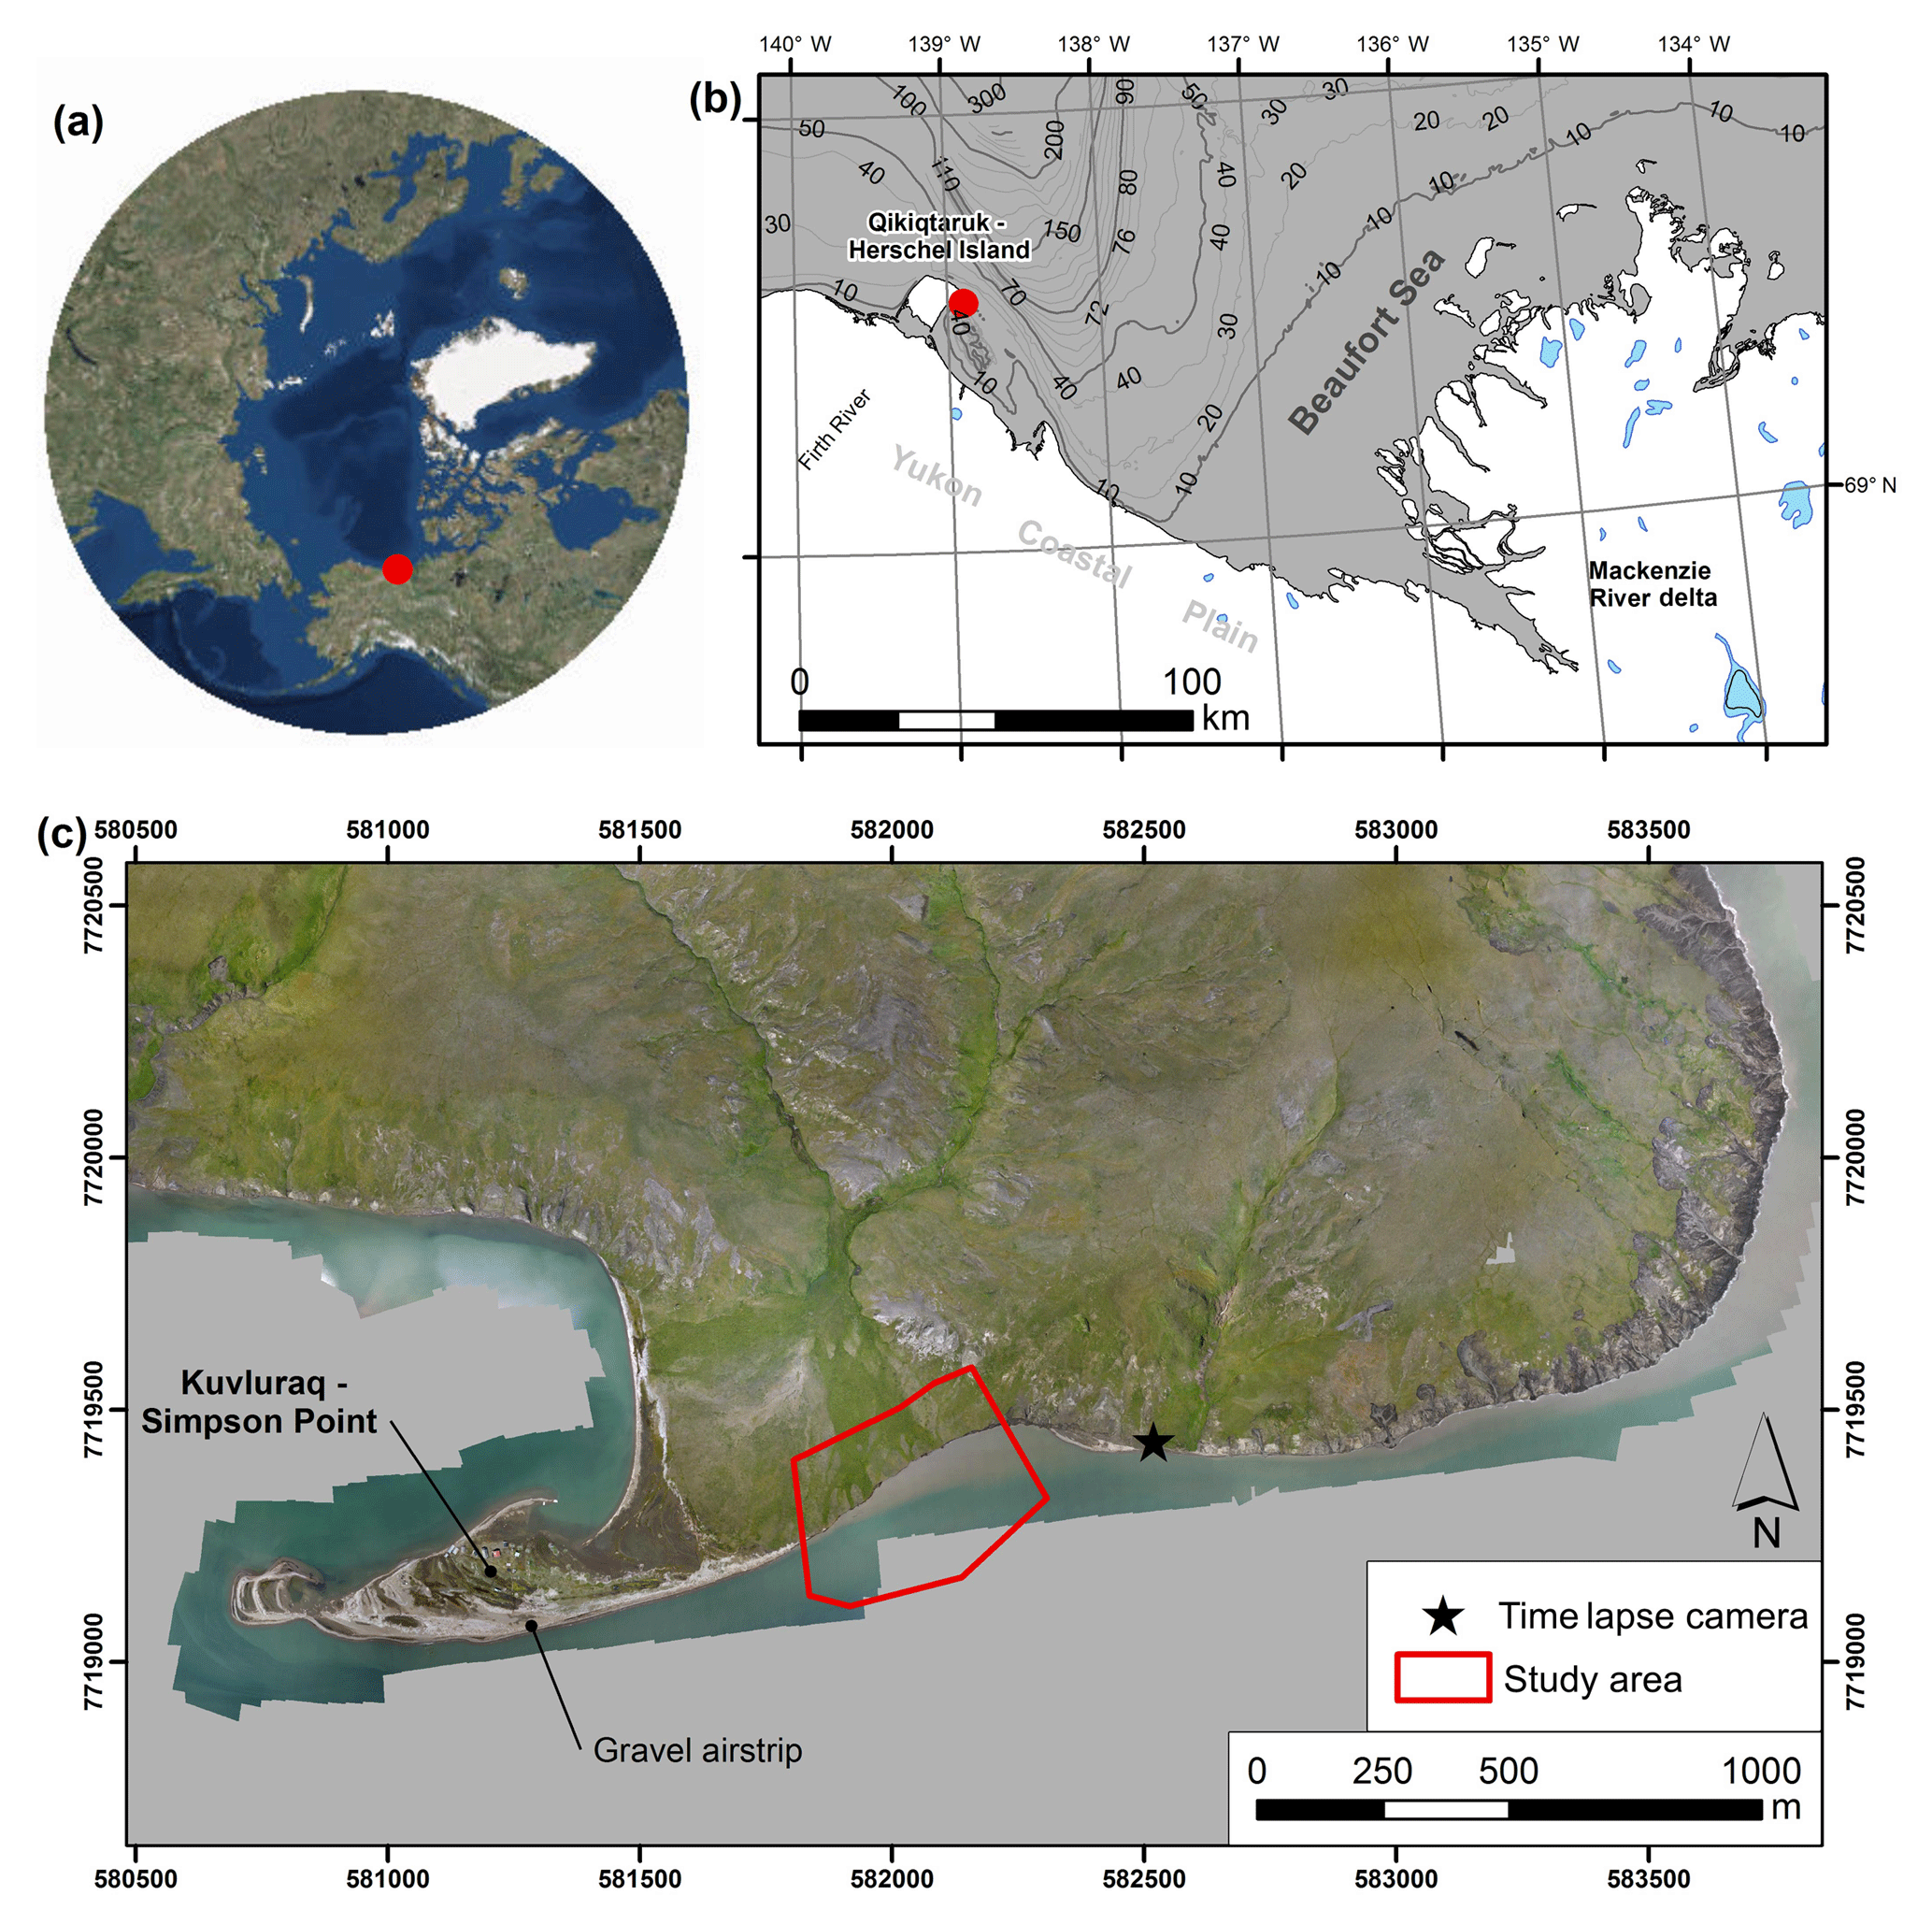
Figure 1(a) The location of the study region in the western Canadian Arctic (basemap from ESRI et al., 2018, polar stereographic projection), (b) Qikiqtaruk – Herschel Island in the Beaufort Sea (shorelines from Wessel and Smith, 1996), and (c) true-colour orthomosaic compiled from ca. 9000 individual images collected by drone survey in August 2017 indicating the location of the 500 m study stretch and the time-lapse camera including viewing direction indicated by the camera symbol used to make Video S1 relative to Kuvluraq – Simpson Point.
Ice break-up typically commences in late June and open-water conditions persist until early October (Dunton et al., 2006; Galley et al., 2016), although for Herschel Basin and Thetis Bay land-fast sea ice can persist for longer periods. The continental shelf in this part of the Beaufort Sea is very narrow and intersected by a deeper sea canyon, the Mackenzie Trough located north of Qikiqtaruk – Herschel Island (Dunton et al., 2006) (Fig. 1b). This area is microtidal, with a mean range of just 0.15 m for semidiurnal and monthly tides, but these are superimposed on a ca. 0.66 m annual tidal cycle, which peaks in late July (Barnhart et al., 2014; Huggett et al., 1975). The interaction between meteorological factors including wind and wave action and coastal morphology exerts more influence on water levels than tidal cycles. The study area is characterised by dominant northwesterly (NW) and prevailing easterly (E) winds. Northwesterly winds drive a positive storm surge and easterly winds drive a negative surge at Qikiqtaruk – Herschel Island (Héquette et al., 1995; Héquette and Barnes, 1990), with easterly winds also facilitating the transport of relatively warmer water discharged from the Mackenzie River towards the island (Dunton et al., 2006). The contemporary rate of relative sea level rise along this part of the Canadian Beaufort Sea is thought to range between ca. 1.1 and 3.5 mm a−1 (James et al., 2014; Manson et al., 2005).
This study focusses on a 500 m long coastal stretch located to the east of Kuvluraq – Simpson Point, a coarse clastic spit (Fig. 1c). The study reach is along the edge of an alluvial fan, comprised of redeposited marine and glaciogenic sediments that form Qikiqtaruk – Herschel Island (Fritz et al., 2011; Rampton, 1982). The spit is attached to the alluvial fan, and is supplied by sediment from the alluvial fan and the high bluffs to the east (Radosavljevic et al., 2016). The focal coastline is characterised by low to moderately high bluffs (ca. 1–5 m in elevation). Ice contents in these bluffs are high, at typically ca. 40 % ice by volume (Obu et al., 2016), which is slightly lower than the typical 50 %–60 % ice content modelled for ice-thrust moraines along this portion of the Yukon Coast (Couture and Pollard, 2017). Permafrost temperatures are approximately −8 ∘C (Burn and Zhang, 2009), and are known to be warming in recent decades (Burn and Zhang, 2009; Myers-Smith et al., 2019). This study area lies entirely within the slightly larger “coastal reach 3” unit considered by Radosavljevic et al. (2016), who reported coastal retreat rates of 1.4±0.6, 1.7±0.7, and 4.0±1.1 m a−1 for the periods 1952–1970, 1970–2000, and 2000–2011, respectively. For further details on the changing ecological and erosional context of this site, see Burn (2012), Radosavljevic et al. (2016), and Myers-Smith et al. (2019).
Coastal erosion at our study site threatens the human settlement and infrastructure on Qikiqtaruk – Herschel Island, located on Kuvluraq – Simpson Point (Olynyk, 2012; Radosavljevic et al., 2016). This gravel spit bounds the natural anchorage of Ilutaq – Pauline Cove, and is an important regional hub for local and indigenous travellers, park administration and rangers, tourists, and researchers in the western Canadian Arctic (e.g. Burn and Zhang, 2009; Myers-Smith et al., 2019). The currently seasonally inhabited settlement is part of the Qikiqtaruk – Herschel Island Territorial Park, and accommodates a number of culturally and historically significant sites resulting in its candidature for UNESCO World Heritage status (UNESCO, 2004). The proximity to the sea and low elevation of this settlement at ≤1.2 m above sea level leads to high risk of coastal hazards, particularly flooding (Myers-Smith and Lehtonen, 2016; Olynyk, 2012; Radosavljevic et al., 2016).
2.2 Drone and time-lapse image acquisition
In 2016, one drone survey was conducted in late July, followed by seven additional drone surveys over a 40 d period between 6 July and 15 August 2017. Drone surveys were conducted using two platforms: (i) a lightweight flying-wing Zeta Phantom FX-61 with a Pixhawk flight controller equipped with a Sony RX-100ii camera (1′′ CMOS sensor with 20.2 megapixels) and (ii) a multi-rotor DJI Phantom 4 Pro (1′′ CMOS sensor with 20 megapixels). Drone operations were conducted in accordance with an SFOC issued by Transport Canada (to assist others seeking such permission, our full application is available at https://arcticdrones.org/regulations/, last access: 10 May 2019). Black and white ground control markers were deployed along the shoreline and precisely geolocated to an absolute accuracy of approximately 0.02 m using real-time kinematic global navigation satellite system (GNSS) equipment (Leica Geosystems). We used between 3 and 132 markers in the surveys, depending on survey extents and destruction of markers by natural processes; ideally, we recommend using n=13 ground control markers, distributed evenly across the area of interest (Carrivick et al., 2016; Cunliffe and Anderson, 2019). Image overlap, a function of front-lap and side-lap, captured each part of the study area in at least five and usually >10 photographs; this equates to fore-/side-lap values of 56 % and 69 %, respectively. For 2-D orthomosaics and 3-D elevation models, we ideally recommend higher levels of overlap, ca. 8–10 and ca. 12–20 overlapping images, respectively. Drone surveys over this study area had flight times of ca. 15–25 min, at altitudes ranging from 30 to 120 m (Table 1). The geotagged red–green–blue (RGB) photographs from each aerial survey had ground-sampling distances ranging from 10 to 40 mm. Although this study presents drone surveys for a limited (500 m) extent of shoreline, drone surveys could be optimised to observe larger reaches of up to ca. 1.5 to 2 km, particularly in jurisdictions such as Canada where current regulations permit UAV operations up to 926 m from the remote pilot(s). For example, using two drones we found it possible to survey over 8 km2 in a single day. Survey parameters including date and time of day, aircraft, altitude, and number of ground control markers are given in Table 1. For further discussion of recommended drone survey parameters for different applications, see Carrivick et al. (2016) and Duffy et al. (2017a). Drone images were processed with structure-from-motion photogrammetry using Agisoft PhotoScan (version 1.3.3) (Agisoft, 2018; Sona et al., 2014), and processing parameters are reported in Table S1 in the Supplement. GNSS-derived geolocations for each individual image and the precisely geolocated ground control markers provided additional spatial constraint of the photogrammetric processing (Carrivick et al., 2016; Cunliffe et al., 2016; Westoby et al., 2012). The photogrammetric processing yielded georegistered orthomosaic composite images and digital surface models. Note that the height field approaches to surface modelling used in this analysis are not capable of capturing topographic change related to the undercutting of bluffs. Capturing such overhanging features with photogrammetric methods can be possible, but requires optimising image acquisition and more computationally intensive post-processing. To inform qualitative interpretation of the erosion dynamics at this location, a time-lapse camera was installed at the location indicated in Fig. 1, imaging the study coastline at hourly intervals for 4 d between 29 July and 3 August 2017.
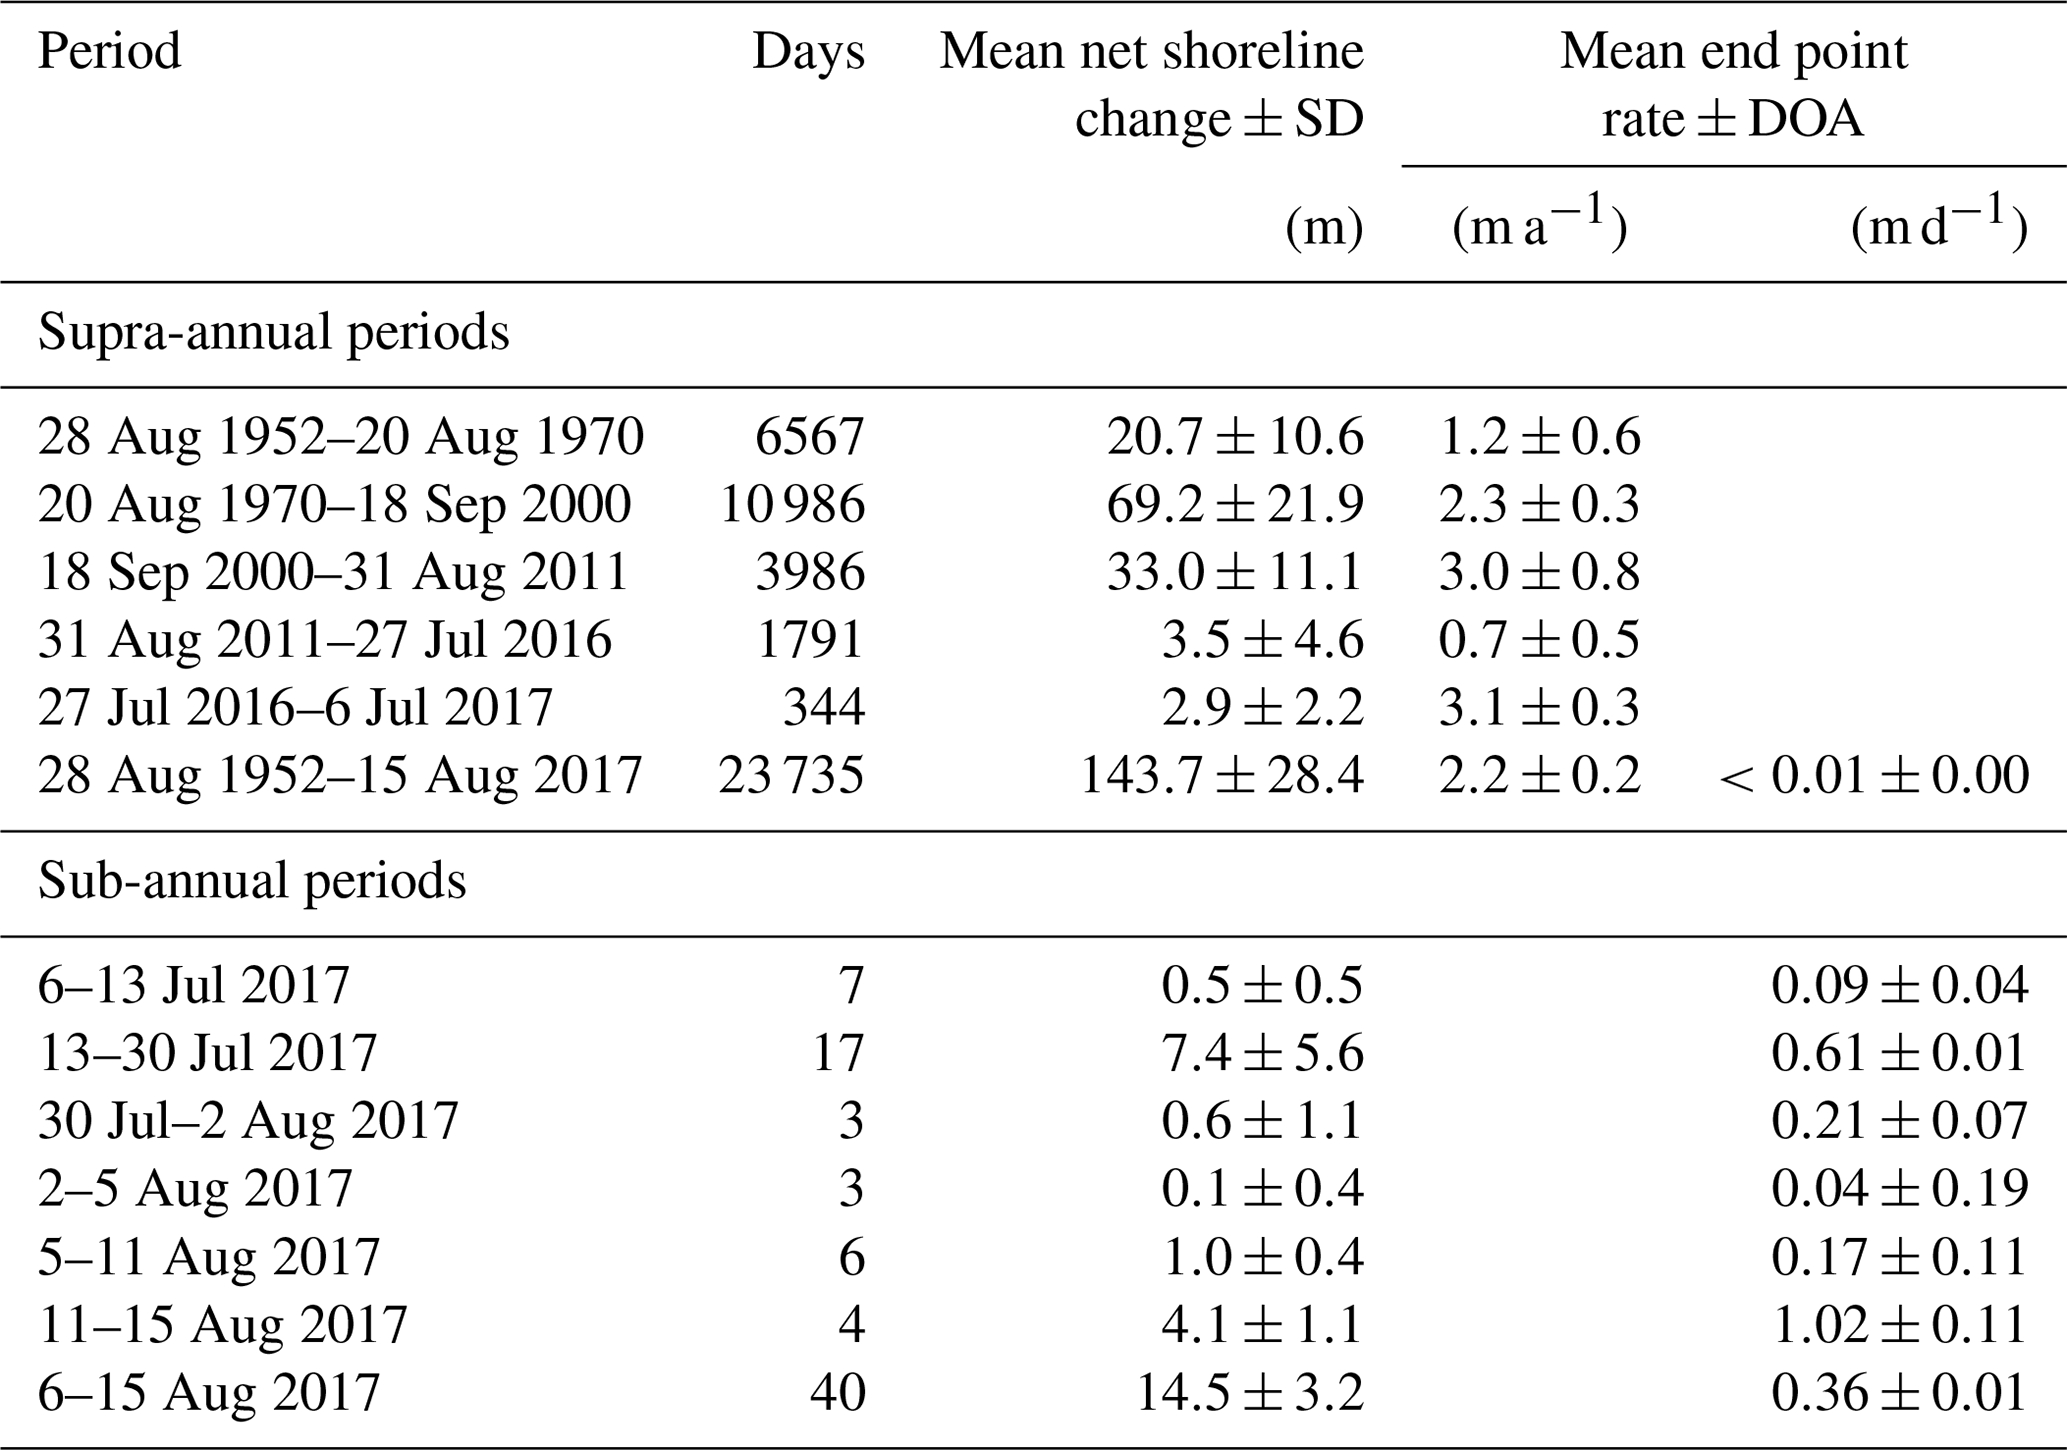
Table 1Dataset and shoreline position parameters. The approximate times of drone surveys are in local time (UTC − 08:00). Total shoreline uncertainty is the root-mean-square error of (i) image co-registration (root-mean-square, rms, error of ground control points, GCPs), (ii) image quality (pixel error), and (ii) shoreline mapping (digitising) error (from Eq. 1).

2.3 Image alignment and shoreline mapping
In addition to the drone surveys, we also used four “historic” panchromatic aerial photographs from 1952 and 1970, and satellite images from 2000 and 2011 (previously analysed by Radosavljevic et al., 2016). These four images had already been orthorectified in PCI OrthoEngine to minimise image distortion. We co-registered these four historic orthorectified images to the 6 July 2017 orthomosaic image in a geographic information system (ArcGIS, version 10.5, ESRI), as we considered this orthomosaic to have the best spatial constraint and coverage of all of the available datasets. All 12 images were aligned to a common spatial framework: NAD83 UTM 7N (EPSG: 26907). Further details of all images and composite orthomosaics are summarised in Table 1. Alignment errors were estimated as the root-mean-square error (RMSE) of the control points. While this approach to quantifying alignment error is standard practice in shoreline change analysis (Irrgang et al., 2018; Novikova et al., 2018; Río and Gracia, 2013), we note that the RMSE of control points is not a strong metric of this uncertainty, as transformation parameters (georeferencing) and the intrinsic and extrinsic camera parameters (structure-from-motion photogrammetry) are adjusted to minimise the RMSE. Consequently, for an independent assessment of image registration error, in future work it would be preferable to use the RMSE of independent check points, which were not used to constrain transformation or bundle adjustment parameters (James et al., 2017). Visual comparison of each dataset indicated excellent spatial agreement and suitability for further analysis (Jones et al., 2018). Pixel error refers to the spatial resolution of the digital satellite and orthomosaic composite images, and for aerial photographs is a metric of image quality calculated based on the scale factor of each image multiplied by the typical resolution of a 9×9 in. aerial photogrammetric camera (after Radosavljevic et al., 2016).
Shorelines were digitised manually in ArcGIS for all 12 images, at a scale of 1:600 for the four, older, coarser spatial resolution panchromatic images and a scale of 1:80 for the eight finer spatial resolution RGB orthomosaics. The shoreline was defined as the vegetation edge rather than the wet–dry line previously used in this region (Radosavljevic et al., 2016) because the vegetation edge was both more visually distinct and temporally consistent than the wet–dry line (Boak and Turner, 2005). Temporal consistency was essential to ensure meaningful assessment of coastal retreat over short time intervals (Río and Gracia, 2013). Mapping shoreline edges was possible with much greater fidelity on the fine-spatial-resolution RGB orthomosaic images compared to the coarser-spatial-resolution panchromatic images where low contrast was sometimes an issue (Boak and Turner, 2005; Río and Gracia, 2013). Shoreline digitising errors were estimated by the GIS operator, and ranged between 0.1 and 4.0 m depending on image spatial resolution (Table 1).
2.4 Shoreline and elevation analysis
Total shoreline uncertainties were calculated as
where U is total shoreline uncertainty, EG is georeferencing error, EP is pixel error, and ED is digitising error (Table 1) (Irrgang et al., 2018; Radosavljevic et al., 2016; Río and Gracia, 2013). Additive error propagation is appropriate because these error terms are not independent.
Shoreline position statistics were calculated with the USGS Digital Shoreline Analysis System (DSAS version 4) extension for ArcGIS (Thieler et al., 2009), using shore normal transects at 5 m intervals. Shoreline retreat rates in this study are given in end point rates for comparison between surveys, and both end point rate and linear regression rate for the entire time period of the study. The linear regression rate uncertainty is the standard error of the slope parameter at the 95 % confidence interval. For further discussion on erosion rate calculation, see Thieler et al. (2009). The accuracy of shoreline change rates was calculated as
where DOA is the dilution of accuracy (Dolan et al., 1991; Himmelstoss et al., 2018; Irrgang et al., 2018), Ui is the total shoreline uncertainty of the first point in time (from Table 1), Uii is the total shoreline uncertainty of the shoreline position from the second point in time, and Δt is the duration of the time period in years or days, as appropriate. Erosion rate errors refer to DOA values, unless otherwise stated, and Table 2 displays the DOAs for all periods. We compared differences in modelled surface elevations between all periods across a cross-sectional transect, and across the whole study area for a 35 d period from 6 July to 11 August 2017 (dates constrained by DSM quality as discussed below). During the survey 6 July 2017, sea level was generally at −2.5 m relative to the EPSG: 26907 datum. To exclude erroneous elevation observations from the sea, we digitised the water's edge at a scale of 1:80 and assigned a constant elevation of −2.5 m to this seaward area. This approach excludes potential submarine elevation change from the subsequent volume calculations. The volume of material eroded was calculated with the surface volume tool in ArcMap.
Table 2Summary of shoreline change for all periods, in terms of net shoreline change and end point rates. Net shoreline change mean is the distance between the oldest and youngest shorelines, where SD is standard deviation. End point rate is the net shoreline change normalised by time (years or days, for supra- or sub-annual periods, respectively), where DOA is dilution of accuracy (after Eq. 2).
2.5 Meteorological and oceanographic observations
Meteorological observations were obtained from an Environment Canada weather station located on Kuvluraq – Simpson Point (station ID: “Herschel Island”, World Meteorological Organisation ID: 71501; downloaded from http://climate.weather.gc.ca/historical_data/search_historic_data_e.html, last access: 1 March 2018), and processed to extract mean 6 h air temperature, wind speed, and wind direction throughout the 2017 observation period. Conductivity–temperature–depth (CTD) profiles (see Fig. S2) were collected in July and August 2017 with a CastAway CTD (SonTek, USA) from a small research vessel ca. 1 km from the study area (near 69.552∘ N, 138.923∘ W).
3.1 Shoreline position analysis
Over our observational period of 1952 to 2017, the coastline along the study reach retreated by an average of 143.7±28.4 m (where ± is the standard deviation of observations from each transect). The overall retreat rate was 2.2±0.1 m a−1 as calculated by end point rate and 1.9±0.5 m a−1 as calculated by the linear regression rate. Average retreat rates over decadal periods ranged between 0.7±0.3 and 3.0±0.5 m a−1. The net shoreline change and end point rates for all periods are presented in Table 2.
Over a 40 d period in the summer of 2017, shoreline retreat was 14.5±3.2 m, ranging between 21.8 and 6.1 m, at an average rate of 0.36 m d−1. The observed shoreline positions are depicted in Figs. 2 and 3, although the high temporal frequency of observations throughout the summer of 2017 and episodic pattern of retreat meant that the shorelines were sometimes very close in space. Most of the coastline retreat occurred over two periods: (i) 27 d between 13 and 30 July and (ii) 4 d between 11 and 15 August (Figs. 2, 3, and 5, Table 2). There was minimal change in coastline position during the 6 d between 5 and 11 August, the 7 d between 6 and 13 July, and the 6 d between 30 July and 5 August (Fig. 2, Table 2). The erosion at this coastline over 4 d is illustrated in a time-lapse video (Video S1 in the Supplement). This camera was orientated facing west by southwest (Fig. 1) with the alluvial fan and the eroding cliff in the foreground and the structures of the settlement in the background. This video illustrates the fluctuations in sea level and wave conditions and shows the undercutting, block failure, and denudation of detached blocks between 29 July and 3 August 2017.
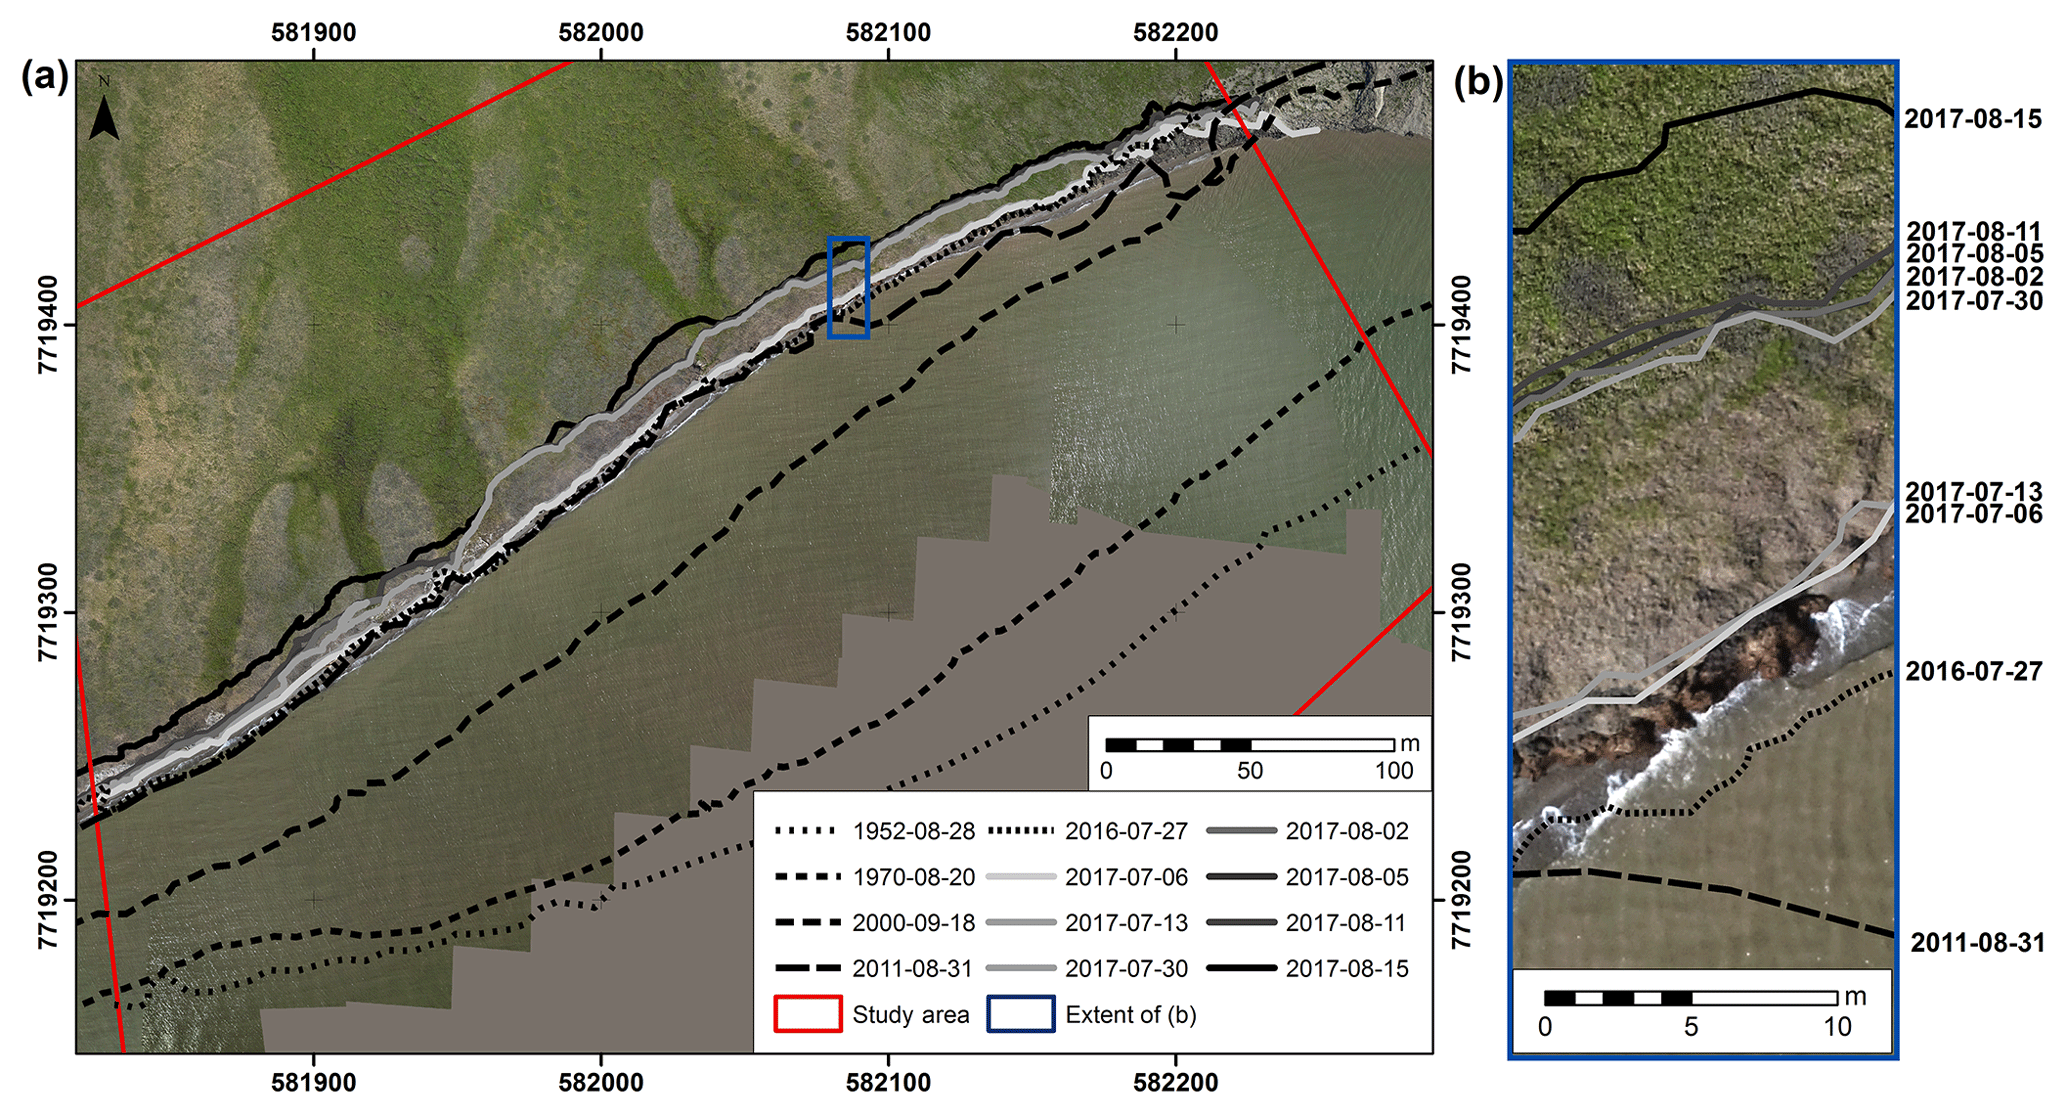
Figure 2(a) Overview of the 500 m study area, illustrating all 12 shoreline positions since 1952 overlaid on the 6 July 2017 orthomosaic. (b) A 10-fold magnification in scale, illustrating the episodic nature of the shoreline changes at this location within the area of the blue bounding box depicted in (a).
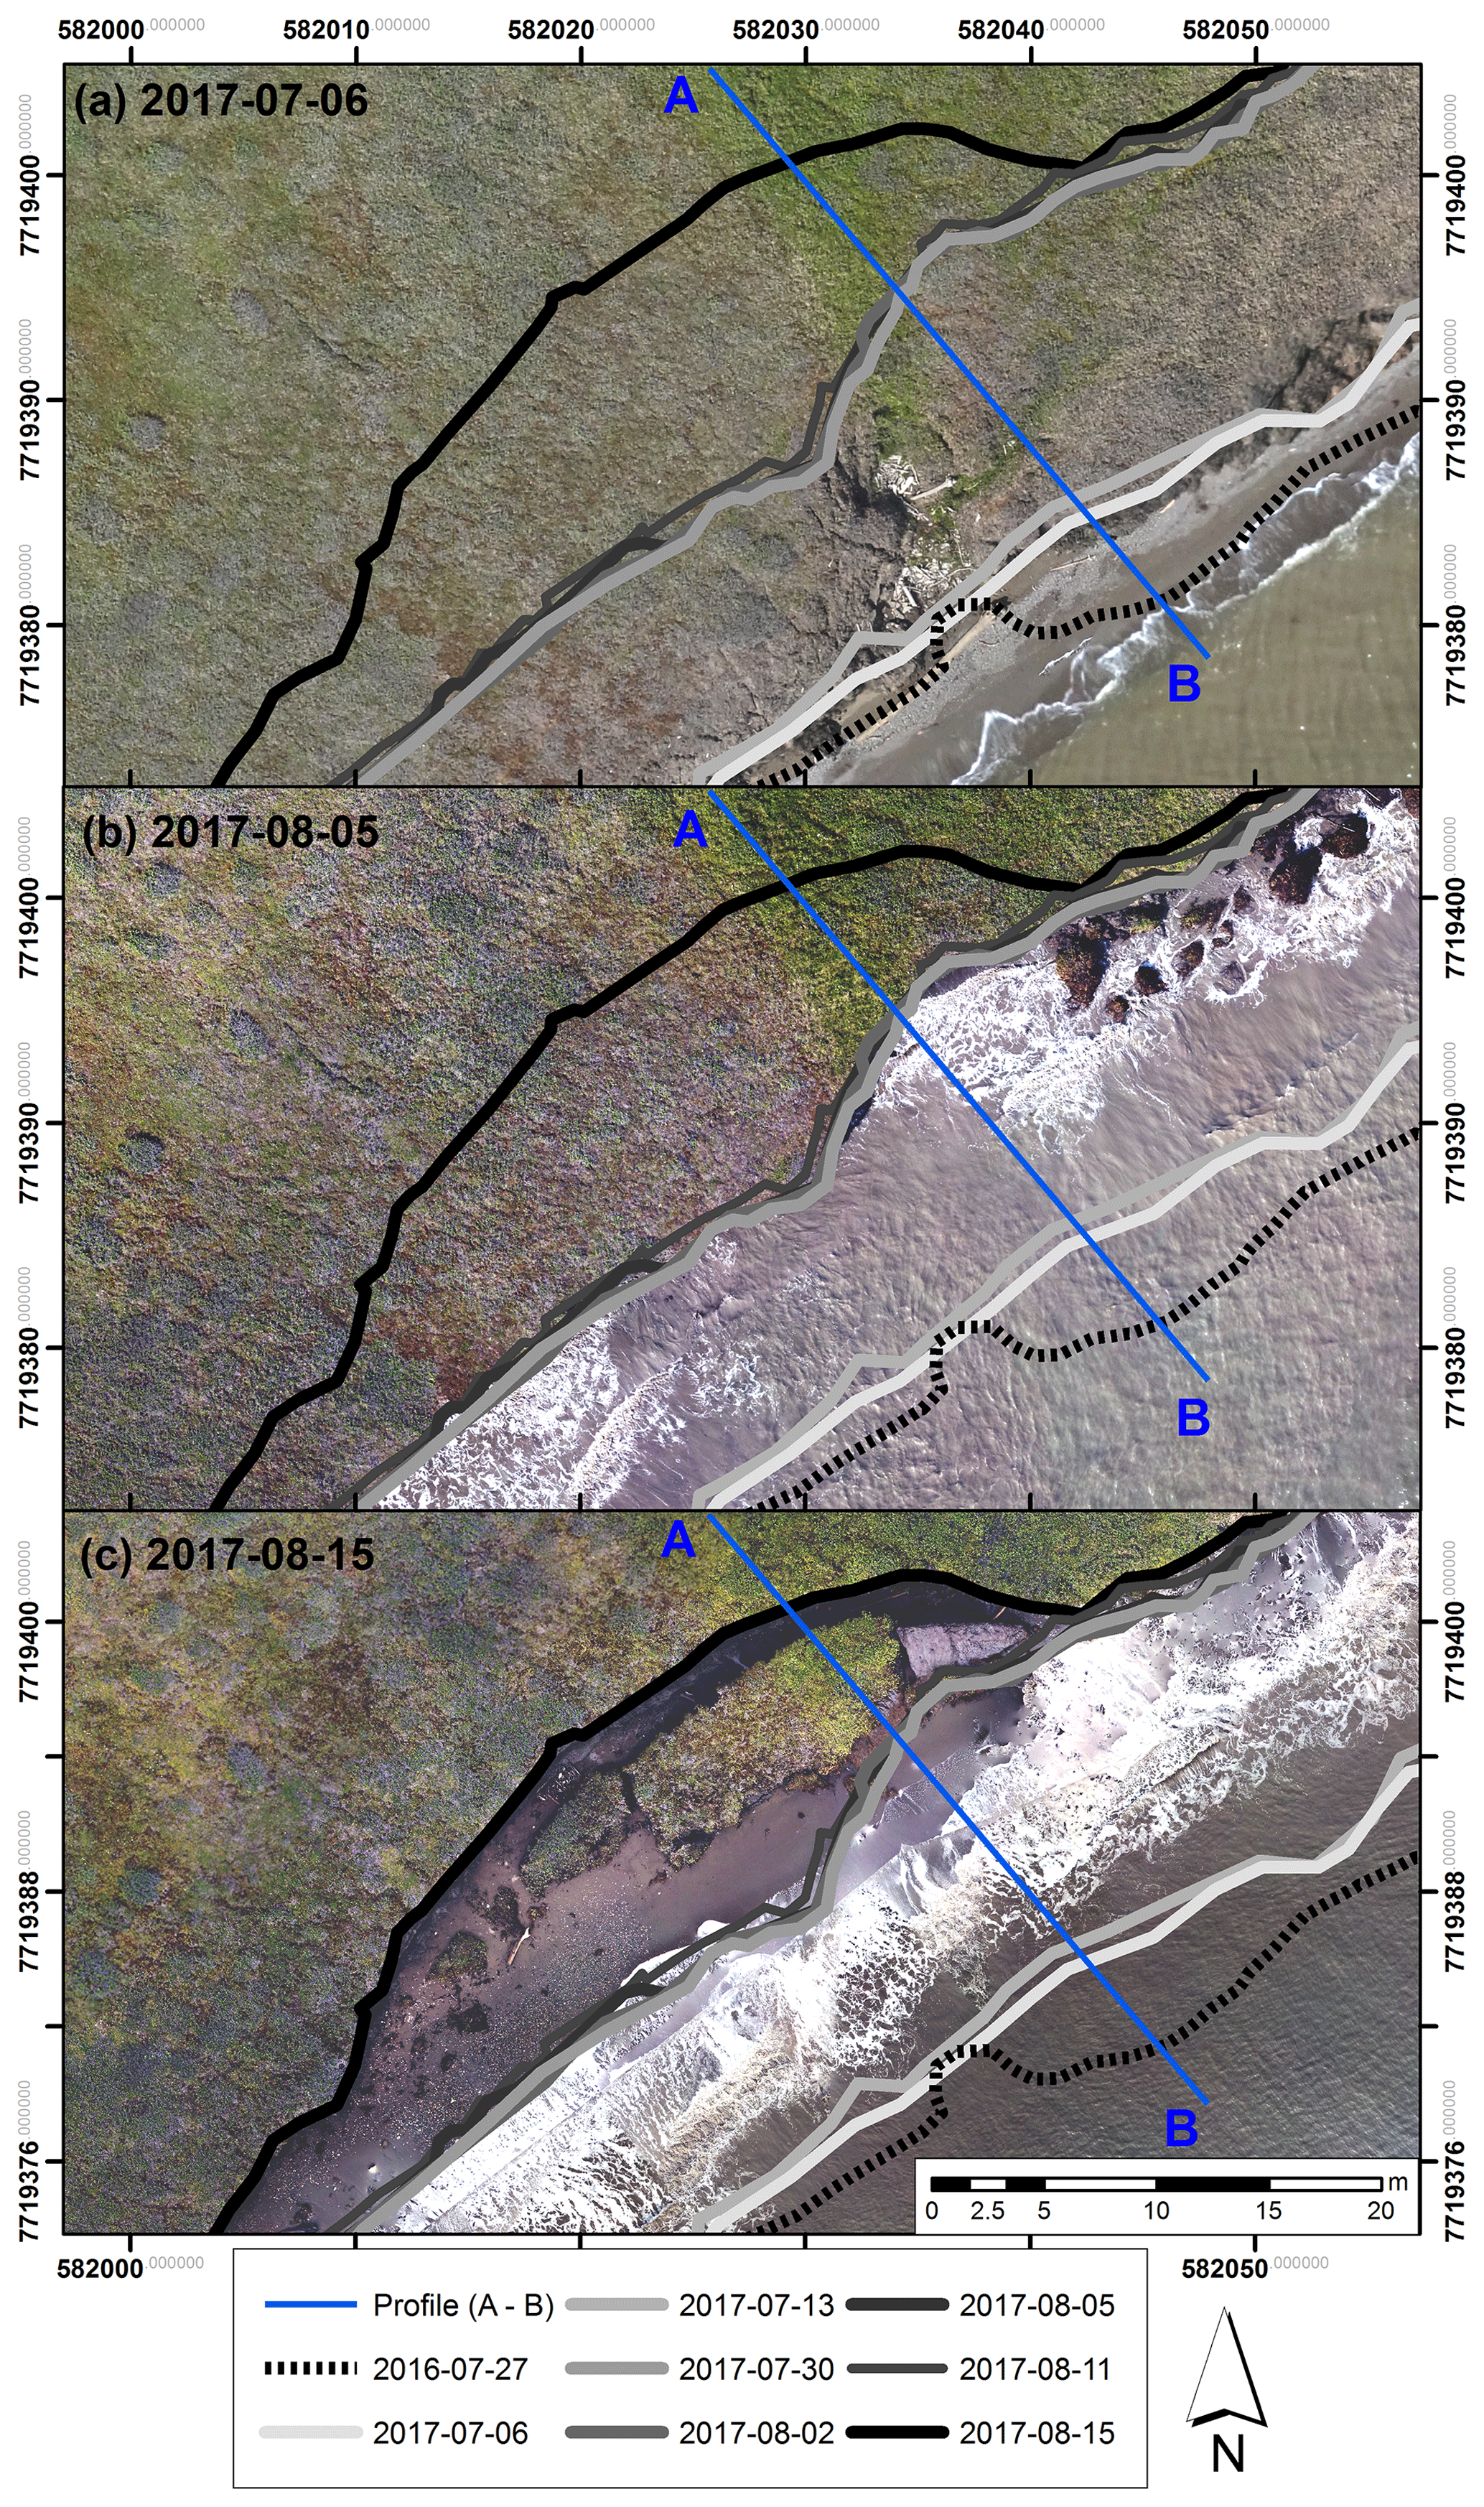
Figure 3Shoreline positions between 2016 and 2017 overlaid on three orthomosaics for part of the study reach. The blocks shown in (c) were detached from the bluff, with water moving freely behind during periods of higher water level (see Fig. S3). Profile A–B indicates the horizontal position of the cross-sectional profiles discussed in Sect. 4.2 and depicted in Fig. 4.
3.2 Surface elevation change
We generated digital surface models (DSM) of the coastal topography from all eight photogrammetric surveys undertaken in 2016 and 2017, spanning a 13-month period (Fig. 4). However, in several cases, the DSMs did not yield reliable data across the entire coastal reach, due to insufficient spatial constraint of the photogrammetric reconstructions. This issue was due in part to the destruction of ground control markers by faster-than-anticipated coastal retreat, as well as sub-optimal distribution of GCPs and insufficient image overlap from some surveys due to weather constraints. Over the 35 d between two well-constrained DSMs from 6 July and 11 August 2017, ca. 28 m3 m−1 of material was removed (totalling ca. 13 800 m3 across the 500 m coastline), at an average rate of ca. 0.79 m3 m−1 d−1 (Fig. 4a). These estimates do not include the 4.1±1.1 retreat observed between 11 and 15 August. During this 4 d period, a further ca. 5300 m3 of material was probably removed (ca. 2.7 m3 m−1 d−1), assuming an average cliff height of 2.65 m as measured across the preceding 35 d. Combined, this resulted in an estimated 19 100 m3 of material being removed over the 40 d. The elevation change map (Fig. 4a) illustrates the increase in bluff elevation from ca. 1 m in the west to ca. 5 m east across the coastal reach. Inland of the shoreline, there were scattered small increases in surface elevation, typically on the order of 0.1–0.2 m; these might relate to the development (esp. leafing out) of tundra vegetation during the short summer growing season (Myers-Smith et al., 2019). In the centre of the study reach, the DSMs were of sufficient quality to allow cross-sectional comparisons across a ca. 3 m high bluff shown in Fig. 4b; these cross sections were sampled across the A–B transect indicated in Figs. 3 and 4a. The depression in the 15 August 2017 elevation profile corresponds with the ca. 1 m gap behind a detached block, depicted in Fig. 3c, illustrating the sensitivity of the surface elevation models.
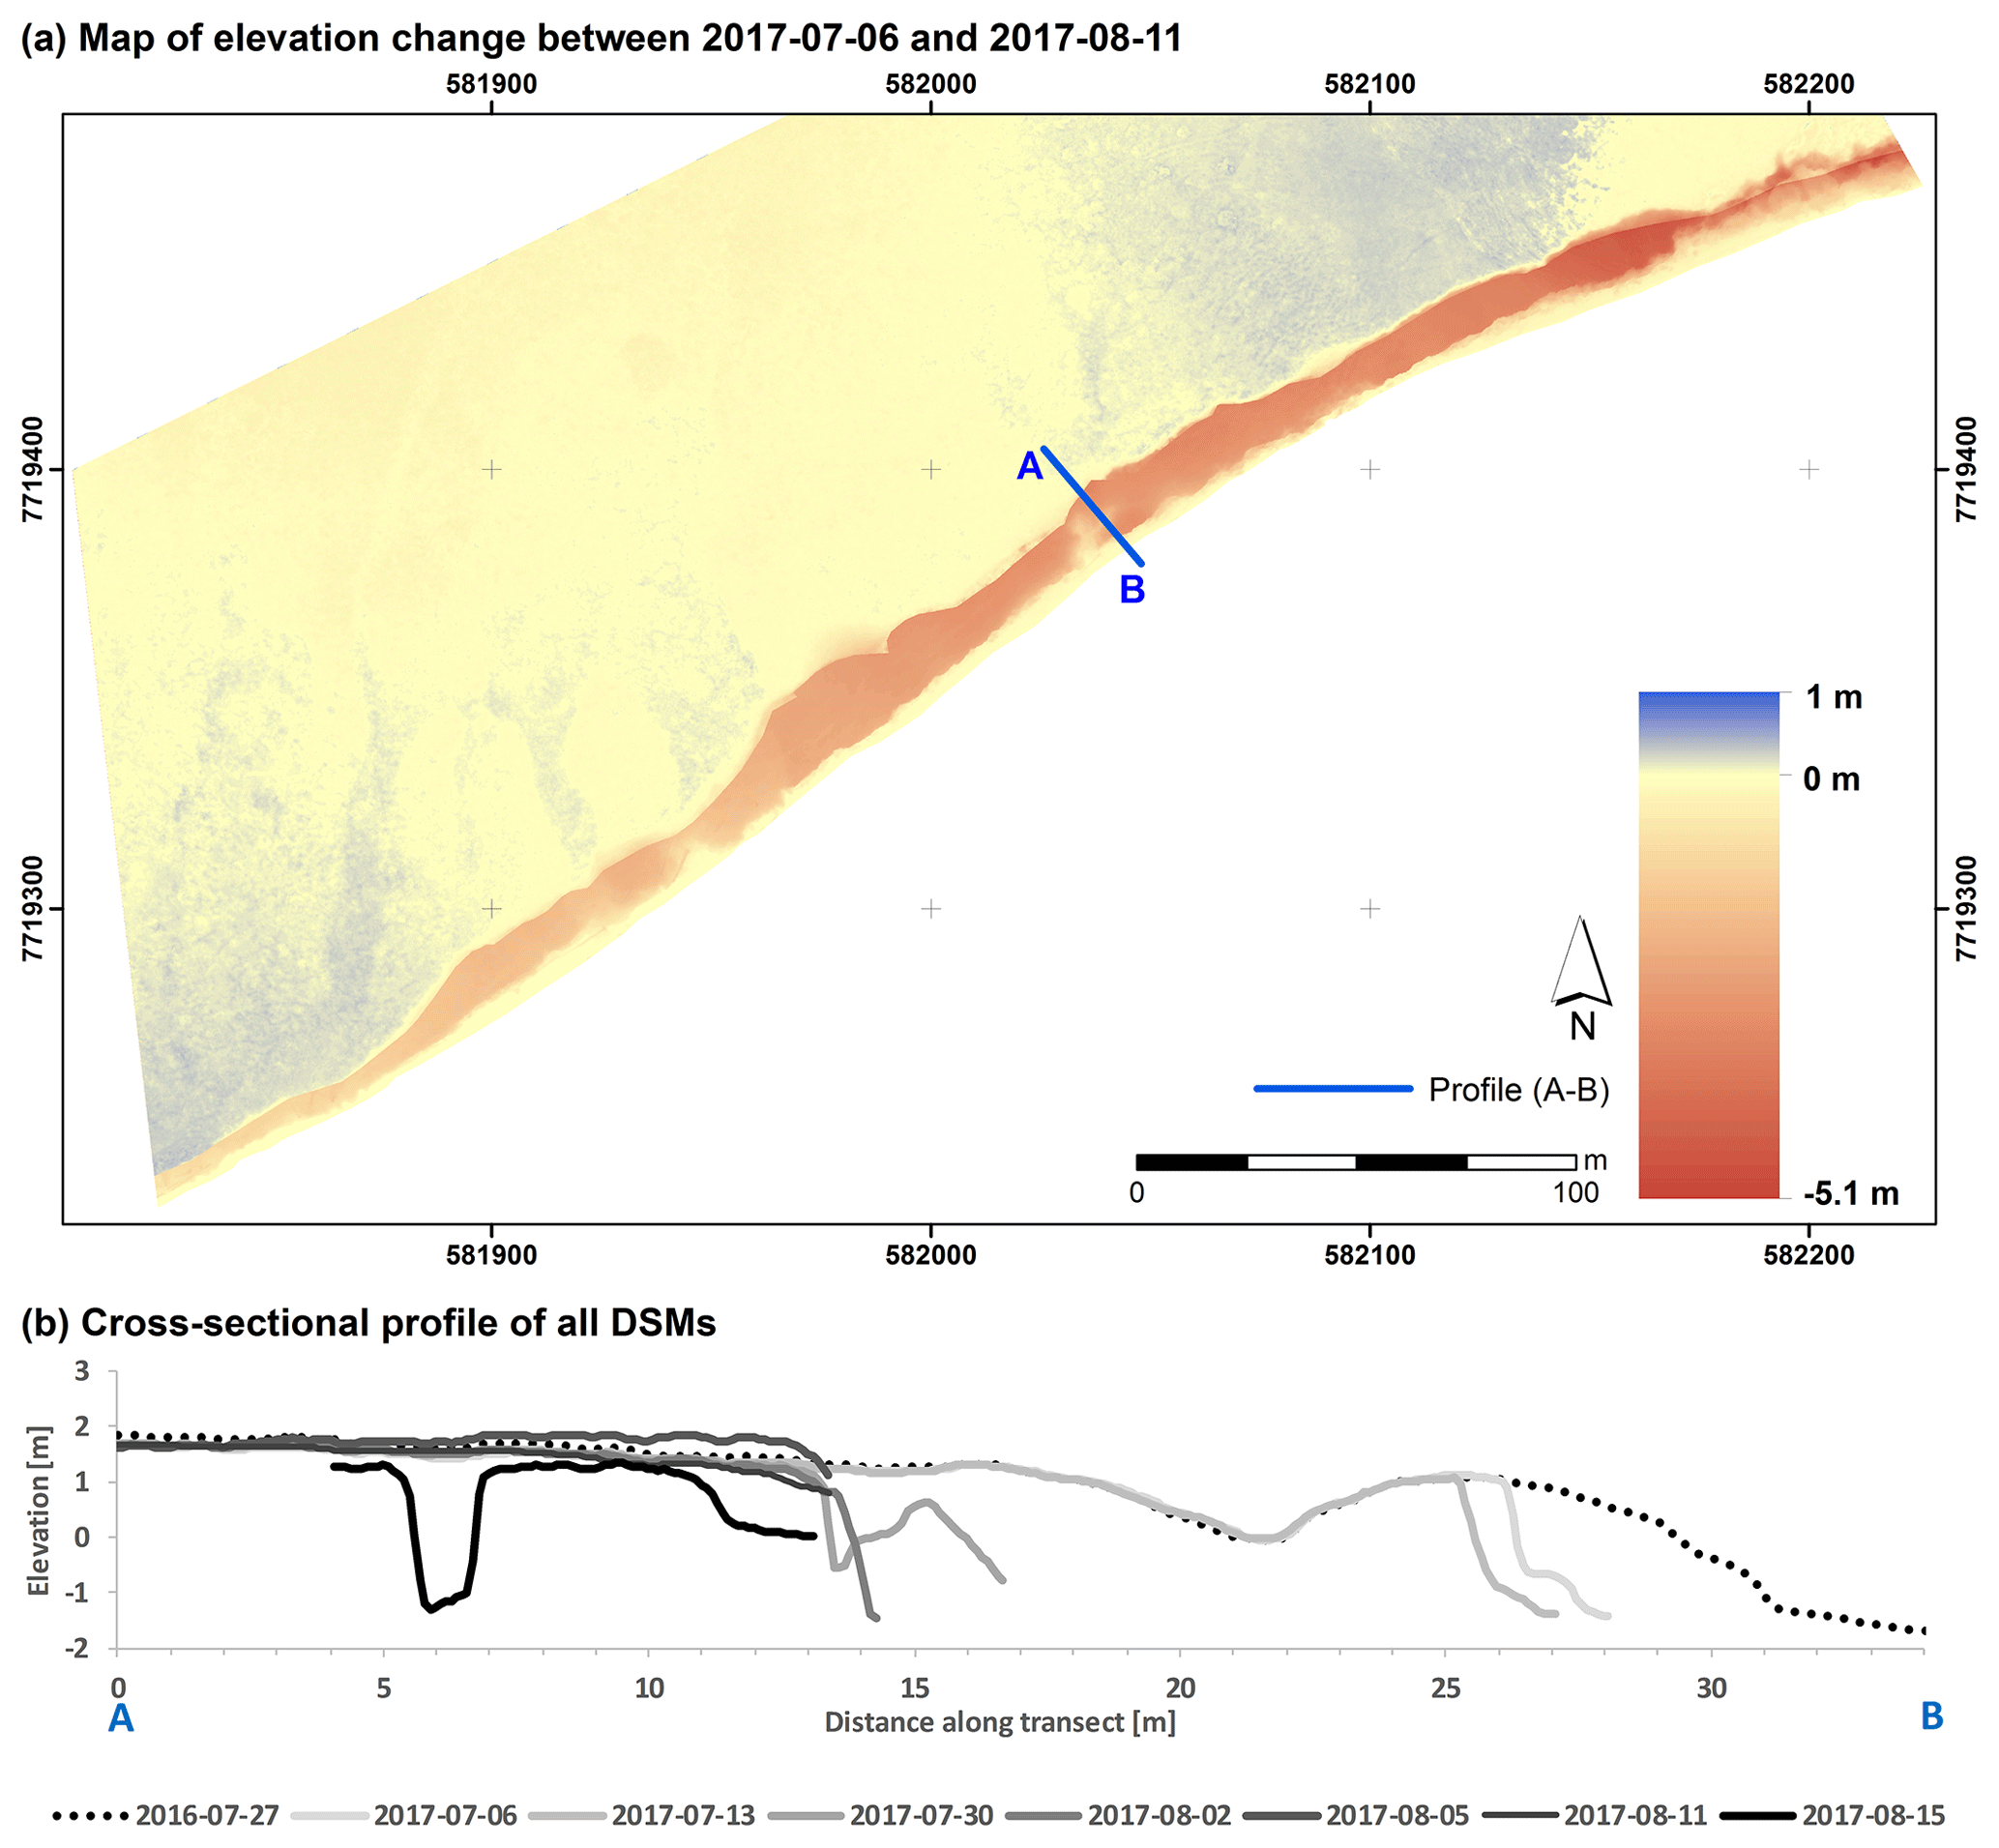
Figure 4(a) Map of elevation change in digital surface models between 6 July and 11 August 2017, illustrating areas of erosion along the coastline with up to −5.1 m of change and also some minor (ca. 0.1 m) increases inland that we attribute to vegetation development. (b) Elevation profiles along the A–B transect shown in (a) and Fig. 3, extracted from digital surface models (no vertical exaggeration). Note that two of the latter elevation models (from 8 and 15 August 2017) both suffered from datum problems due to insufficient spatial constraint; see discussion for details.
3.3 Meteorological, oceanographic, and time-lapse video observations
Erosion rates for each observation period through the summer of 2017 were compared to meteorological and oceanographic conditions, in order to better describe the controls on episodic and rapid erosion of this coastline (Fig. 5). From 3 to 10 d prior to the first 2017 survey (on 6 July 2017), winds were consistently strong from the east and their 6 h average speed reached up to 40 km h−1 (Fig. 5). For 0 to 3 d prior to the same survey the dominant wind direction shifted to the northwest with strong winds up to 40 km h−1 (Fig. 5), which raised the water level and refracted waves around the bluffs at Collinson Head to the northeast of the study reach. Over the 7 d between 6 and 13 July 2017, winds were predominantly from the southeast, with brief periods of strong winds (ca. 30 km h−1 over 6 h) from the northwest (Fig. 5). These meteorological conditions generally promoted waves from the southeast, which eroded the exposed cliff base (Figs. 4 and 5). Over the 17 d between 13 and 30 July, winds were variable, but predominantly from the southeast, with two notable periods of very high-strength winds (ca. 40 km h−1 for 24 and 12 h, respectively) (Fig. 5), and surface water temperatures reached nearly 10 ∘C (see Fig. S3, CTD profile d). These conditions combined to drive rapid erosion, resulting in 7.4±5.6 m (SD) of shoreline retreat in just 17 d (Figs. 3 and 4).
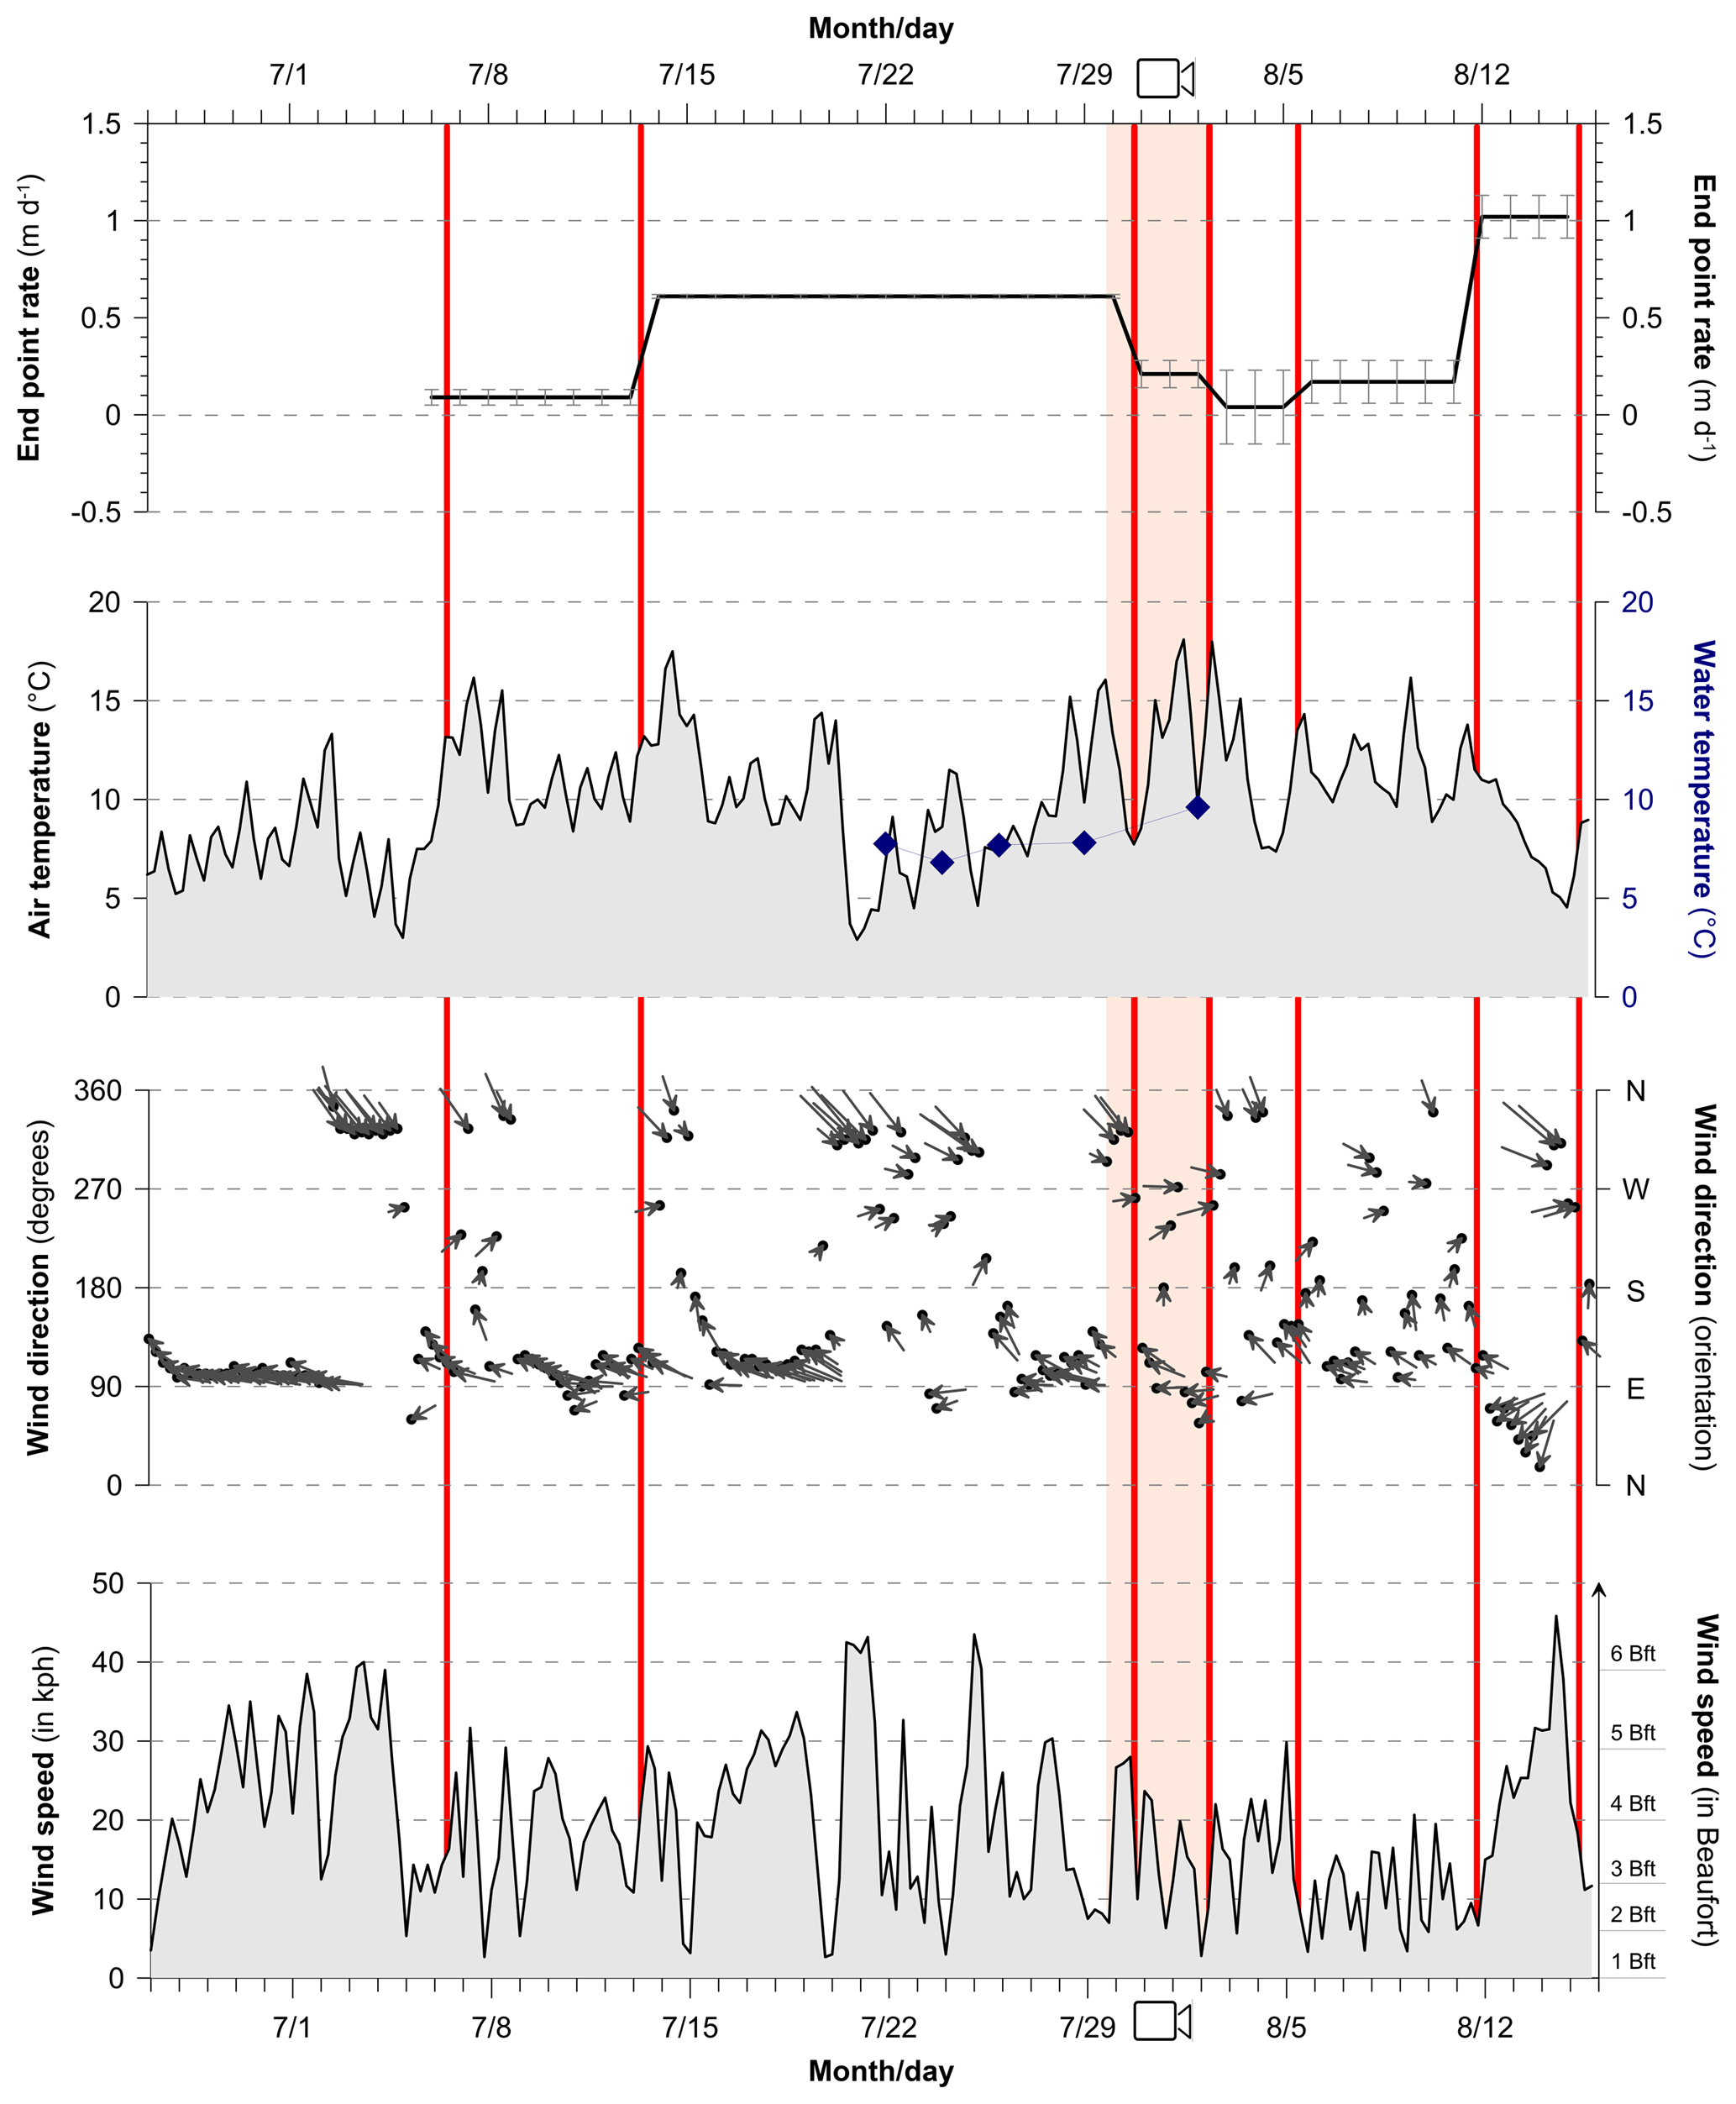
Figure 5Shoreline retreat (end point) rates normalised by day for each observation period in 2017, 6 h moving averages of air temperature, wind direction, and wind velocity in July–August 2017 (data from Environment Canada, 2017). Dates and times of aerial surveys are indicated by the red bars, point measurements of sea surface temperature from CTD casts are indicated by blue diamonds (see Fig. S3 for full CTD profiles), and the duration of time-lapse survey shown in Video S1 is indicated by the red shading.
Over the 6 d between 30 July and 5 August, winds were variable in direction and typically weaker (Fig. 5). This resulted in minimal shoreline retreat (Table 2), but did remove cliff debris from the beach, facilitating further undercutting (Video S1, Fig. 4). Over the 6 d between 5 and 11 August, the wind direction was variable and wind speed was low (6 h averages mostly below 20 km h−1), with relatively slow coastline retreat of ca. 0.17 m d−1. Over the 4 d between 11 and 15 August, a larger storm event developed, with wind shifting from east through north to west and wind speeds increasing to above 45 km h−1 for more than 6 h (Fig. 5). These meteorological conditions generated large waves and caused undercutting that drove 4.1±1.1 m (SD) of shoreline retreat in just 4 d, largely through block failure (Figs. 3, 4, and S4, Table 2). Sea surface temperatures were relatively warm at 6–10 ∘C when measured between 21 July and 2 August (Figs. 5, S2). Figure S1 in the Supplement summarises wind vectors and velocities observed during the summer of 2017.
4.1 Rapid shoreline change
Over the 65-year record from 1952 to 2017, we found substantial erosion along the 500 m study coastline of Qikiqtaruk – Herschel Island. The average rate of retreat was 2.2 m a−1, ranging over decadal periods from 0.7 to 3.0 m a−1 (Table 2).
This long-term retreat rate is fast compared with 0.7 m a−1 for the Yukon coast (Irrgang et al., 2018), 1.1 m a−1 for the Canadian Beaufort Sea (Lantuit et al., 2012), and circum-Arctic observations where rates are typically between 0 and 2 m a−1 (Overduin et al., 2014) with a weighted mean of 0.57 m a−1 (Lantuit et al., 2012). Our study reach lies within the slightly larger coastal reach 3 unit considered by Radosavljevic et al. (2016); consequently, differences in reach length and historic image co-registration result in some slight differences between the erosion rates reported herein and those previously reported for the historic imagery. Coastal retreat rates in the neighbouring Alaskan Beaufort Sea were typically 0.7 to 2.4 m a−1 depending on coast type (Jorgenson and Brown, 2005), with extremes of up to 25 m a−1 (Jones et al., 2009b). Yet, the Alaskan Beaufort Sea coastline is more similar to the western formerly non-glaciated part of the Yukon Coast, with low cliffs, overall strong erosion rates, and longer sea ice cover (Irrgang et al., 2018; Jorgenson and Brown, 2005; Ping et al., 2011). This is quite different from our study coastline in the formerly glaciated part of the Yukon Coast (Rampton, 1982), which is characterised by high cliffs and high ground ice contents due to former movement and burial of glacier ice (Couture and Pollard, 2017; Fritz et al., 2011). Furthermore, the sea-ice-free season in our study area is longer than further west along the Alaskan coast due to the warming influence of the Mackenzie River, but in turn is modulated by the break-up of land-fast ice, which can be persistent in Herschel Basin and Thetis Bay (Dunton et al., 2006). Erosion rates from linear regression tend to underestimate rates calculated from end point reports (Dolan et al., 1991; Radosavljevic et al., 2016), which is consistent with our findings of 1.9 m a−1 vs. 2.2 m a−1, but both linear regression and end point rates alone do not account for uncertainty in shoreline positions (Himmelstoss et al., 2018). Changes in the rate of mean shoreline position for all time points are shown in Fig. S4.
Over a 384 d period from 27 July 2016 to 15 August 2017, we observed a large retreat in the shoreline position, with an average of 17.4 m, although note that this period is 19 d longer than a year and includes a disproportionate number of days from the open-water season. Most of this rapid retreat occurred in the summer of 2017, when we measured 14.5 m of coastline retreat over just 40 d. Our own qualitative observations on the ground over the summer of 2017 (Video S1) confirmed the extremely rapid shoreline changes reported above. In this time, we estimate approximately 19 000 m3 of material was eroded at a rate of ca. 0.96 m3 m d−1. The coastal erosion processes we observed during 40 d of 2017 correspond with the conceptual model described by Barnhart et al. (2014) (Video S1 and Fig. S3). The bluffs along the alluvial fan were affected by thermo-denudation but particularly thermo-abrasion due to the combined mechanical and thermal action of seawater, causing undercutting and subsequent block failure (Barnhart et al., 2014; Günther et al., 2012; Vasiliev et al., 2005). These thermal processes are likely influenced by warm surface waters delivered from the Mackenzie River delta during easterly wind conditions (Dunton et al., 2006). Additional factors facilitating rapid erosion at this site are the high ice content (ca. 40 % Obu et al., 2016) and the low relief, as less material is deposited at the base of the bluff following cliff failure, thus reducing protection of the bluff base from further wave action (Héquette and Barnes, 1990). Given the episodic nature of coastal retreat, it can be difficult to compare short-term rate changes with long-term observation periods (<2 vs. >10 years, respectively) (Dolan et al., 1991). However, to remain consistent with the long-term average rate of 2.2 m a−1, no further erosion of this coastline would need to occur for more than 7 years after the retreat observed in 2016 and 2017.
The rapid coastline retreat observed in this study reach is consistent with, but greater than, earlier analysis of neighbouring coastal reaches on Qikiqtaruk – Herschel Island between 1952 and 2011 (Radosavljevic et al., 2016) and also coastal retreat observed in other Arctic permafrost coastlines (Günther et al., 2013; Irrgang et al., 2018; Jones et al., 2009a; Whalen et al., 2017). Coastline retreat rates almost doubled from 7.6 m a−1 (1955–2009) to 13.8 m a−1 (2007–2009) at Cape Halkett on the Alaskan Beaufort Sea (Jones et al., 2009a), and more than doubled from 2.2 m a−1 (1952–2010) to 5.3 m a−1 (2010–2012) on Bykovsky Peninsula, Siberia (Günther et al., 2013). Increases in erosion rates greater than 2-fold are more commonly observed on low-elevation coasts, such as the one examined herein and in Jones et al. (2009a). On the Yukon Coast, average coastal retreat rates were 0.5 m a−1 between 1950 and 1970 (Harper et al., 1985) and 0.7 m a−1 between 1950 and 2011 (Irrgang et al., 2018), with maximum reported rates of 22 m a−1 on Pelly Island (NWT) 130 km to the east along the Yukon–NWT coast (Whalen et al., 2017). Robustly detecting changes in the trends of permafrost coastline erosion in this region and more widely requires further analyses of shoreline position changes at near-annual temporal resolution, considering a larger range of representative coastal reaches and study sites.
4.2 Drivers of rapid shoreline change
The rapid retreat observed in 2016 and especially 2017 was likely driven by a range of factors, including longer-term conditioning factors acting over timescales of decades to years and also shorter-term factors acting over timescales of weeks to days and hours. Over the longer term, this region experiences a relative sea level rise of ca. 1.1 to 3.5 mm a−1 (James et al., 2014; Manson et al., 2005), progressively subjecting more permafrost to thermo-abrasional processes. Seasonal sea ice break-up has advanced earlier by 46 d per decade between 2002 and 2016 (Assmann, 2019), with ice-free seasons lengthening by 9 d per decade between 1979 and 2013 (Stroeve et al., 2014) and summer minimum sea ice concentrations decreasing over the last 39 years in this area (Myers-Smith et al., 2019). This region is generally experiencing longer open-water seasons and increasing wave heights (Barnhart et al., 2014; Farquharson et al., 2018; Stroeve et al., 2014), and there is increased heat influx to the ocean during the open-water season, due to increasing discharge from the Mackenzie River and atmospheric warming. Atmospheric warming has increased permafrost temperatures and deepened the active layer at sites just 1 km from the study reach (Burn and Zhang, 2009; Myers-Smith et al., 2019), lowering the energy required to thaw the permafrost, although lengthening open-water seasons is likely to be the most significant factor (Farquharson et al., 2018).
Attribution of the rapid change in shoreline position in 2017 to a single main driver is not possible with the available datasets. Examination of MODIS observations indicates sea ice break-up was ca. 15 d earlier in 2015 and 2016, but in 2017 it was in line with the 10-year average (Fig. S5). The direction and frequency of wind patterns observed in 2017 (Figs. 5, S1) are similar to those reported in June–September from 2009 to 2012 (Radosavljevic et al., 2016, Fig. 4 therein). However, overall wind speeds were higher in 2017, with a greater proportion of periods with mean speeds in excess of >30 km h−1 (Fig. S1). The role of wind is discussed further below. A large portion of beach and cliff debris appeared to have been removed between our survey in 2016 (26 July 2016) and our first survey in 2017 (6 July 2017) (Fig. 4b, and corroborated by our field observations), potentially either during storm events in the autumn of 2016 and/or ice bulldozing during ice break-up in spring 2017. We hypothesise that removal of this protective material may have increased the susceptibility of these cliffs to rapid erosion in the summer of 2017. Field observations from 2018 suggest that the shoreline retreat has stabilised at rates closer to the long-term average.
Through the summer of 2017, coastal retreat was highly episodic. The main mode of erosion was block failure following thermo-abrasional undercutting. This undercutting appeared to be largely influenced by fluctuations in water level combined with wave action. Water level fluctuations appeared to be mainly determined by wind-generated surges and waves, superimposed on tidal patterns (Héquette et al., 1995; Héquette and Barnes, 1990). Although this region is microtidal, with a mean range of just 0.15 m for semidiurnal and monthly tides, these are superimposed on a ca. 0.66 m annual tidal cycle which peaks in late July (Barnhart et al., 2014), corresponding with our intensive observation period. Annual tides therefore likely influence the timing of coastal retreat within the ice-free season in this area. The two periods with the most rapid erosion in 2017 (the 27 d between 13 and 30 July and the 4 d between 11 and 15 August) were both associated with strong winds (6 h moving averages exceeding >40 km h−1), both easterly and northwesterly, and preceded by relatively high air and water temperatures (Fig. 5). Together, these conditions likely enhanced the thermo-abrasional processes undercutting the ice-rich bluff. The high temporal frequency of shoreline position observations is essential to studying highly episodic erosion processes. For example, ca. 30 % (4.2 m) of the 14.5 m of shoreline retreat in the summer of 2017 happened in just 4 d (11–15 August), indicating discrete storm events can play a major role in the geomorphic development of permafrost shorelines (Farquharson et al., 2018; Solomon et al., 1993). Future work relating coastline change to meteorological and oceanographic factors over short timescales will need to consider the latencies involved between meteorological and oceanographic conditions, undercutting of permafrost cliffs, and planform change as observed from an aerial perspective.
4.3 Rapid coastal erosion as potential threat for the Territorial Parks infrastructure
Coastal change near the Ilutaq – Pauline Cove area influences the stability and evolution of the adjacent gravel spit, which accommodates culturally and historically significant sites, as well as infrastructure essential to the operation of the Qikiqtaruk – Herschel Island Territorial Park. Shoreline change and flooding in recent history has already necessitated the relocation and raising of several historic buildings at the Ilutaq – Pauline Cove settlement, as well as the relocation of the gravel airstrip essential to the operation of the park (Olynyk, 2012). However relocation efforts are hindered by the fragility of several buildings, particularly the “Community House”, the oldest building in the Yukon, and it is increasingly difficult to find safer locations for these buildings on the spit (Olynyk, 2012). These historic buildings underpin the site's candidature for UNESCO status (UNESCO, 2004). Erosion of the observed coastal reach exposes the base of the spit to coastal processes, increasing the risk of changes to the position of the spit itself. Flooding during storm events can isolate the spit from the island (Myers-Smith and Lehtonen, 2016), and such events are projected to become more common in the future (Radosavljevic et al., 2016). Knowledge of coastal processes, particularly patterns of contemporary coastal retreat as a proxy for future patterns, is therefore valuable for informing local management decisions.
4.4 Using drones to quantify fine-scale coastal erosion dynamics
Drone surveys and photogrammetric analysis are effective tools for measuring fine-scale erosion dynamics along permafrost coastlines, yielding orthomosaics, inferred shoreline positions (Figs. 2 and 3), and surface elevation models (Fig. 4). When supplemented by other monitoring of environmental variables (such as wave fields, sea surface temperature, wind strength and direction), drone-acquired observations at fine spatio-temporal resolutions can be related to meteorological and oceanographic observations on supra-annual timescales, providing quantitative insights into erosion processes that vary greatly in time and space. The temporal resolution of drone surveys can greatly exceed those available by more traditional forms of remote sensing, for example satellite observations or surveys from manned aircraft (Casella et al., 2016; Stow et al., 2004; Whalen et al., 2017), and such observations can be more informative than previously available proxies (such as the apparent cross-sectional area of detached blocks; Barnhart et al., 2014). Such spatial observations could be used to robustly evaluate and refine process-based numerical models of coastal erosion over multiple temporal scales (Barnhart et al., 2014; Casella et al., 2014; Wobus et al., 2011).
Lightweight drones can be deployed at a relatively low cost when suitably trained and equipped personnel are on site. However, the costs of accessing high-latitude sites can be substantial, potentially contributing to uneven distributions of monitoring sites (Metcalfe et al., 2018). Surveyable spatial extents depend on the size and the range of the remotely piloted drone, and are also limited by safety and regulatory restrictions. Observations from optical satellites may be better suited for observing change across larger sections of coastline; however, high levels of cloud cover in Arctic regions limit the frequency of successful optical satellite observations (Hope et al., 2004; Stow et al., 2004). Continuing advances in satellite sensors have increased the spatial resolution and revisit frequency of observations, yet freely available products are currently only available for spatial resolutions of ca. ≥10 m (e.g. Sentinel 2), and finer-spatial-resolution (<4 m) products have non-trivial costs for each scene.
In summary, lightweight drone surveys can be suitable when there is a need to accurately measure small changes (e.g. ≤0.3 m) in shoreline positions or elevations over limited extents (e.g. ≤5–10 km in length). Fine-resolution measurements from drone products will be especially useful for isolating the drivers of coastal erosion events, and continued miniaturisation of thermal and multispectral cameras for drone platforms will create opportunities to better understand these mechanisms of change. Measurements of surface elevation and consequently volume change can be more informative than simple 2-D representations of shoreline position. We generated digital surface models following our drive surveys; however, issues with insufficient spatial constraint meant that full area coverage was only possible from some of the surveys. If elevation observations are required, care should be taken when conducting drone surveys to ensure that there will be sufficient spatial constraint of the photogrammetric modelling process, even if coastal retreat is faster than expected. For further recommendations on optimising placement of ground control, see Carrivick et al. (2016) and James et al. (2017).
We used drones as a highly effective instrument to observe the dynamics of permafrost coastline changes associated with supra-seasonal erosion on Qikiqtaruk – Herschel Island. In 2017, average shoreline retreat was extremely rapid at 14.5 m over 40 d, well in excess of the long-term average of 2.2 m a−1 from 1952 to 2017. The volume of material removed was ca. 0.96 m3 m d−1 in 2017. A total of 30 % of the rapid 2017 shoreline change (4.1 m retreat) occurred in just 4 d during one storm event. Block failure was the prevailing mode of erosion, seemingly driven by multiple factors that increase the susceptibility of the permafrost coastline to thermo-abrasional processes. These rapid erosion events observed on Qikiqtaruk – Herschel Island appear to have been driven by short-term fluctuations in water levels due to meteorological conditions, possibly superimposed on annual tidal cycles on a longer-term background of relative sea level rise and increasing heat flux from the Mackenzie River discharge and the atmosphere.
We found that lightweight drones and aerial photogrammetry can be cost-effective tools to capture short-term coastal erosion dynamics and related shoreline changes along discrete sections of permafrost coasts. At our study site on Qikiqtaruk – Herschel Island further erosion and removal of this coastal reach could threaten the infrastructure of the settlement over the long term. With the rapid maturation of drone platforms and image-based modelling technologies, these approaches can now be easily deployed at both supra- and sub-annual timescales to obtain new insights into coastal erosion and inform management decisions. These approaches are particularly relevant in permafrost coastlines, where erosion can be highly episodic, with long-term rates dominated by short-term events. By combining new methods of observation with long-term records, we can improve predictions of coastal erosion dynamics and subsequent consequences for the management of fragile Arctic coastal ecosystems and cultural sites.
The georectified aerial images underpinning this analysis are available for download from PANGAEA (https://doi.pangaea.de/10.1594/PANGAEA.901852, Cunliffe et al., 2019). The digital elevation models are available from the corresponding author upon request. Meteorological observations are available from Environment Canada.
A supplementary time-lapse video of the coastal erosion reported here is available at https://doi.org/10.5446/40250 (Cunliffe et al., 2017).
The supplement related to this article is available online at: https://doi.org/10.5194/tc-13-1513-2019-supplement.
AMC and GT contributed equally to this work. Conceptualisation, AMC, GT, JTK and IHM-S; Data curation, AMC; Formal analysis, AMC and GT; Funding acquisition, IHM-S, TS, and HL; Investigation, AMC, GT, BR, WFP and JTK; Methodology, AMC; Project administration, AMC; Supervision, TS, HL and IHM-S; Visualisation, AMC, GT and WFP; Writing – original draft, AMC; Writing – review & editing, AMC, GT, BR, WFP, TS, HL, JTK and IHM-S.
The authors declare that they have no conflict of interest. The funding sponsors had no role in the design of the study; in the collection, analyses, or interpretation of data; in the writing of the paper; or in the decision to publish the results.
We wish to thank the Qikiqtaruk Territorial Park staff including Richard Gordon, Edward McLeod, Samuel McLeod, Ricky Joe, Paden Lennie, and Shane Goesen, as well as the Yukon government and Yukon parks for their permission and support of this research (permit number Inu0216). We also thank the Inuvialuit people for their permission to work on their traditional lands. Drone flight operations were authorised by a Special Flight Operations Certificate granted by Transport Canada. We thank Tobias Bolch, James Duffy, and the anonymous reviewers for insightful feedback that helped us to refine earlier versions of this paper.
This research has been supported by the Natural Environment Research Council (grant no. NE/M016323/1), the National Geographic Society (grant no. CP-061R-17), the Helmholtz Young Investigators Group “COPER” (grant no. VH NG 801), the Horizon 2020 (grant Nunataryuk (773421)), and the NERC Geophysical Equipment Facility (grant nos. GEF:1063 and GEF:1069).
This paper was edited by Tobias Bolch and reviewed by two anonymous referees.
Agisoft: Agisoft PhotoScan User Manual: Professional Edition, Version 1.4, Agisoft, 2018.
Assmann, J. J.: Arctic tundra plant phenology and greenness across space and time, PhD thesis, University of Edinburgh, 2019.
Barnhart, K. R., Anderson, R. S., Overeem, I., Wobus, C., Clow, G. D., and Urban, F. E.: Modeling erosion of ice-rich permafrost bluffs along the Alaskan Beaufort Sea coast, J. Geophys. Res.-Earth, 119, 1155–1179, https://doi.org/10.1002/2013JF002845, 2014.
Bell, L. E., Bluhm, B. A., and Iken, K.: Influence of terrestrial organic matter in marine food webs of the Beaufort Sea shelf and slope, Mar. Ecol. Prog. Ser., 550, 1–24, https://doi.org/10.3354/meps11725, 2016.
Boak, E. H. and Turner, I. L.: Shoreline definition and detection: a review, J. Coastal Res., 2005, 688–703, https://doi.org/10.2112/03-0071.1, 2005.
Brown, J., Ferrians Jr., O. J., Heginbottom, J. A., and Melnikov, E. S.: Circum-Arctic map of permafrost and ground-ice conditions, USGS Numbered Series, available at: http://pubs.er.usgs.gov/publication/cp45 (last access: 9 April 2018), 1997.
Burn, C. R.: Herschel Island Qikiqtaryuk: A Natural and Cultural History of Yukon's Arctic Island, 1st edn., Calgary University Press, Calgary, Canada, 2012.
Burn, C. R. and Zhang, Y.: Permafrost and climate change at Herschel Island (Qikiqtaruq), Yukon Territory, Canada, J. Geophys. Res., 114, F02001, https://doi.org/10.1029/2008JF001087, 2009.
Carrivick, J. L., Smith, M. W., and Quincey, D. J.: Structure from Motion in the Geosciences, John Wiley & Sons, Ltd, Chichester, UK, 2016.
Casella, E., Rovere, A., Pedroncini, A., Mucerino, L., Casella, M., Cusati, L. A., Vacchi, M., Ferrari, M., and Firpo, M.: Study of wave runup using numerical models and low-altitude aerial photogrammetry: A tool for coastal management, Estuar. Coast. Shelf S., 149, 160–167, https://doi.org/10.1016/j.ecss.2014.08.012, 2014.
Casella, E., Rovere, A., Pedroncini, A., Stark, C. P., Casella, M., Ferrari, M., and Firpo, M.: Drones as tools for monitoring beach topography changes in the Ligurian Sea (NW Mediterranean), Geo-Mar. Lett., 36, 151–163, https://doi.org/10.1007/s00367-016-0435-9, 2016.
Couture, N. J. and Pollard, W. H.: A Model for Quantifying Ground-Ice Volume, Yukon Coast, Western Arctic Canada, Permafrost Periglac., 28, 534–542, https://doi.org/10.1002/ppp.1952, 2017.
Couture, N. J., Irrgang, A., Pollard, W., Lantuit, H., and Fritz, M.: Coastal Erosion of Permafrost Soils Along the Yukon Coastal Plain and Fluxes of Organic Carbon to the Canadian Beaufort Sea, J. Geophys. Res.-Biogeo., 123, 406–422, https://doi.org/10.1002/2017JG004166, 2018.
Cunliffe, A. and Anderson, K.: Measuring Above-ground Biomass with Drone Photogrammetry: Data Collection Protocol, Protocol Exchange, https://doi.org/10.1038/protex.2018.134, 2019.
Cunliffe, A., Palmer, W., and Tanski, G.: Timelapse Video of Eroding Permafrost Coastline, Copernicus Publications, https://doi.org/10.5446/40250, 2017.
Cunliffe, A. M., Brazier, R. E., and Anderson, K.: Ultra-fine grain landscape-scale quantification of dryland vegetation structure with drone-acquired structure-from-motion photogrammetry, Remote Sens. Environ., 183, 129–143, https://doi.org/10.1016/j.rse.2016.05.019, 2016.
Cunliffe, A. M., Tanski, G., Radosavljevic, B., Palmer, W., Sachs, T., Kerby, J. T., and Myers-Smith, I. H .: Aerial images of eroding permafrost coastline, Qikiqtaruk – Hershel Island, Yukon, Canada, PANGAEA, https://doi.pangaea.de/10.1594/PANGAEA.901852, 2019.
DeBell, L., Anderson, K., Brazier, R. E., King, N., and Jones, L.: Water resource management at catchment scales using lightweight UAVs: current capabilities and future perspectives, Journal of Unmanned Vehicle Systems, 4, 7–30, https://doi.org/10.1139/juvs-2015-0026, 2015.
Dolan, R., Fenster, M. S., and Holme, S. J.: Temporal analysis of shoreline recession and accretion, J. Coastal Res., 7, 723–744, 1991.
Duffy, J. P., Cunliffe, A. M., DeBell, L., Sandbrook, C., Wich, S. A., Shutler, J. D., Myers-Smith, I. H., Varela, M. R., and Anderson, K.: Location, location, location: considerations when using lightweight drones in challenging environments, Remote Sens. Ecol. Conserv., 4, 7–19, https://doi.org/10.1002/rse2.58, 2017a.
Duffy, J. P., Pratt, L., Anderson, K., Land, P. E., and Shutler, J. D.: Spatial assessment of intertidal seagrass meadows using optical imaging systems and a lightweight drone, Estuar. Coast. Shelf S., https://doi.org/10.1016/j.ecss.2017.11.001, 2017b.
Dunton, K. H., Weingartner, T., and Carmack, E. C.: The nearshore western Beaufort Sea ecosystem: Circulation and importance of terrestrial carbon in arctic coastal food webs, Prog. Oceanogr., 71, 362–378, https://doi.org/10.1016/j.pocean.2006.09.011, 2006.
Environment Canada: http://climate.weather.gc.ca/climate_data (last access: 3 January 2018), 2017.
ESRI, TerraColor and Earthstar Geographics: Basemap, available at: http://goto.arcgisonline.com/maps/Arctic_Imagery (last access: 7 February 2019), 2018.
Farquharson, L. M., Mann, D. H., Swanson, D. K., Jones, B. M., Buzard, R. M., and Jordan, J. W.: Temporal and spatial variability in coastline response to declining sea-ice in northwest Alaska, Mar. Geol., 404, 71–83, https://doi.org/10.1016/j.margeo.2018.07.007, 2018.
Fritz, M., Wetterich, S., Meyer, H., Schirrmeister, L., Lantuit, H., and Pollard, W. H.: Origin and characteristics of massive ground ice on Herschel Island (western Canadian Arctic) as revealed by stable water isotope and Hydrochemical signatures, Permafrost Periglac., 22, 26–38, https://doi.org/10.1002/ppp.714, 2011.
Fritz, M., Wetterich, S., Schirrmeister, L., Meyer, H., Lantuit, H., Preusser, F., and Pollard, W. H.: Eastern Beringia and beyond: Late Wisconsinan and Holocene landscape dynamics along the Yukon Coastal Plain, Canada, Palaeogeogr. Palaeocl., 319–320, 28–45, https://doi.org/10.1016/j.palaeo.2011.12.015, 2012.
Fritz, M., Vonk, J. E., and Lantuit, H.: Collapsing Arctic coastlines, Nat. Clim. Change, 7, 6–7, https://doi.org/10.1038/nclimate3188, 2017.
Galley, R. J., Babb, D., Ogi, M., Else, B. G. T., Geilfus, N.-X., Crabeck, O., Barber, D. G., and Rysgaard, S.: Replacement of multiyear sea ice and changes in the open water season duration in the Beaufort Sea since 2004, J. Geophys. Res.-Oceans, 121, 1806–1823, https://doi.org/10.1002/2015JC011583, 2016.
Günther, F., Overduin, P. P., Sandakov, A., Grosse, G., and Grigoriev, M. N.: Thermo-erosion along the Yedoma coast of the Buor Khaya peninsula, Laptev Sea, East Siberia, in: Proceedings of the Tenth International Conference on Permafrost, edited by: Hinkel, K., Volume 1: International Contributions, 137–142, 2012.
Günther, F., Overduin, P. P., Sandakov, A. V., Grosse, G., and Grigoriev, M. N.: Short- and long-term thermo-erosion of ice-rich permafrost coasts in the Laptev Sea region, Biogeosciences, 10, 4297–4318, https://doi.org/10.5194/bg-10-4297-2013, 2013.
Günther, F., Overduin, P. P., Yakshina, I. A., Opel, T., Baranskaya, A. V., and Grigoriev, M. N.: Observing Muostakh disappear: permafrost thaw subsidence and erosion of a ground-ice-rich island in response to arctic summer warming and sea ice reduction, The Cryosphere, 9, 151–178, https://doi.org/10.5194/tc-9-151-2015, 2015.
Harper, J. R., Reimer, P. D., and Collins, A. D.: Canadian Beaufort Sea physical shore-zone analysis, Report for Northern Oil and Gas Action Plan, Indian and Northern Affairs Canada Ottawa, Canada, available at: https://geoscan.nrcan.gc.ca/starweb/geoscan/servlet.starweb?path=geoscan/fulle.web&search1=R=130252 (last access: 5 May 2019), 1985.
Héquette, A. and Barnes, P. W.: Coastal retreat and shoreface profile variations in the Canadian Beaufort Sea, Mar. Geol., 91, 113–132, https://doi.org/10.1016/0025-3227(90)90136-8, 1990.
Héquette, A., Desrosiers, M., and Barnes, P. W.: Sea ice scouring on the inner shelf of the southeastern Canadian Beaufort Sea, Mar. Geol., 128, 201–219, https://doi.org/10.1016/0025-3227(95)00095-G, 1995.
Himmelstoss, E. A., Henderson, R. E., Kratzmann, M. G., and Farris, A. S.: Digital Shoreline Analysis System (DSAS) version 5.0 user guide, Report, Reston, VA, Open-File Report 2018-1179, 2018.
Hope, A. S., Pence, K. R., and Stow, D. A.: NDVI from low altitude aircraft and composited NOAA AVHRR data for scaling Arctic ecosystem fluxes, Int. J. Remote Sens., 25, 4237–4250, https://doi.org/10.1080/01431160310001632710, 2004.
Huggett, W. S., Woodward, M. J., Stephenson, F., Hermiston, F. V., and Douglas, A.: Near and Bottom Currents and Offshore Tides, Ocean and Aquatic Sciences, Depatment of Envrionment, Victoria, Canada, Beaufort Sea Technical Report No. 16, 1975.
IPCC: Climate Change 2013: The Physical Science Basis. Contribution of Working Group I to the Fifth Assessment Report of the Intergovernmental Panel on Climate Change, edited by: Stocker, T. F., Qin, D., Plattner, G.-K., Tignor, M. M. B., Allen, S. K., Boschung, J., Nauels, A., Xia, Y., Bex, V., and Midgley, P., Cambridge University Press, Cambridge, United Kingdom, 996 pp., 2013.
Irrgang, A. M., Lantuit, H., Manson, G. K., Günther, F., Grosse, G., and Overduin, P. P.: Variability in Rates of Coastal Change Along the Yukon Coast, 1951 to 2015, J. Geophys. Res.-Earth, 123, 779–800, https://doi.org/10.1002/2017JF004326, 2018.
James, M. R., Robson, S., d'Oleire-Oltmanns, S., and Niethammer, U.: Optimising UAV topographic surveys processed with structure-from-motion: Ground control quality, quantity and bundle adjustment, Geomorphology, 280, 51–66, https://doi.org/10.1016/j.geomorph.2016.11.021, 2017.
James, T. S., Henton, J. A., Leonard, L. J., Darlington, A., Forbes, D. L., and Craymer, M.: Relative sea-level projections in Canada and the adjacent mainland United States,Geological Survey of Canada, Ottawa, Ontario, Open file 7737, available at: http://publications.gc.ca/site/eng/9.819835/publication.html (last access: 10 May 2019), 2014.
Jones, B. M., Hinkel, K. M., Arp, C. D., and Eisner, W. R.: Modern erosion rates and loss of coastal features and sites, Beaufort Sea coastline, Alaska, Arctic, 61, 361–372, , 2008.
Jones, B. M., Arp, C. D., Beck, R. A., Grosse, G., Webster, J. M., and Urban, F. E.: Erosional history of Cape Halkett and contemporary monitoring of bluff retreat, Beaufort Sea coast, Alaska, Polar Geography, 32, 129–142, https://doi.org/10.1080/10889370903486449, 2009a.
Jones, B. M., Arp, C. D., Jorgenson, M. T., Hinkel, K. M., Schmutz, J. A., and Flint, P. L.: Increase in the rate and uniformity of coastline erosion in Arctic Alaska, Geophys. Res. Lett., 36, L03503, https://doi.org/10.1029/2008GL036205, 2009b.
Jones, B. M., Farquharson, L. M., Baughman, C. A., Buzard, R. M., Arp, C. D., Grosse, G., Bull, D. L., Günther, F., Nitze, I., Urban, F., Kasper, J. L., Frederick, J. M., Thomas, M., Jones, C., Mota, A., Dallimore, S., Tweedie, C., Maio, C., Mann, D. H., Richmond, B., Gibbs, A., Xiao, M., Sachs, T., Iwahana, G., Kanevskiy, M., and Romanovsky, V. E.: A decade of remotely sensed observations highlight complex processes linked to coastal permafrost bluff erosion in the Arctic, Environ. Res. Lett., 13, 115001, https://doi.org/10.1088/1748-9326/aae471, 2018.
Jorgenson, M. T. and Brown, J.: Classification of the Alaskan Beaufort Sea Coast and estimation of carbon and sediment inputs from coastal erosion, Geo-Mar. Lett., 25, 69–80, https://doi.org/10.1007/s00367-004-0188-8, 2005.
Klemas, V. V.: Coastal and environmental remote sensing from unmanned aerial vehicles: an overview, J. Coastal Res., 1260–1267, https://doi.org/10.2112/JCOASTRES-D-15-00005.1, 2015.
Kritsuk, L. N., Dubrovin, V. A., and Yastreba, N. V.: Some results of integrated study of the Kara Sea coastal dynamics in the Marre-Sale meteorological station area, with the use of GIS technologies, Earth's Cryosphere, 4, 59–69, 2014.
Lantuit, H. and Pollard, W. H.: Temporal stereophotogrammetric analysis of retrogressive thaw slumps on Herschel Island, Yukon Territory, Nat. Hazards Earth Syst. Sci., 5, 413–423, https://doi.org/10.5194/nhess-5-413-2005, 2005.
Lantuit, H. and Pollard, W. H.: Fifty years of coastal erosion and retrogressive thaw slump activity on Herschel Island, southern Beaufort Sea, Yukon Territory, Canada, Geomorphology, 95, 84–102, https://doi.org/10.1016/j.geomorph.2006.07.040, 2008.
Lantuit, H., Overduin, P. P., Couture, N., Wetterich, S., Aré, F., Atkinson, D., Brown, J., Cherkashov, G., Drozdov, D., Forbes, D. L., Graves-Gaylord, A., Grigoriev, M., Hubberten, H.-W., Jordan, J., Jorgenson, T., Ødegård, R. S., Ogorodov, S., Pollard, W. H., Rachold, V., Sedenko, S., Solomon, S., Steenhuisen, F., Streletskaya, I., and Vasiliev, A.: The Arctic Coastal Dynamics Database: A New Classification Scheme and Statistics on Arctic Permafrost Coastlines, Estuar. Coast., 35, 383–400, https://doi.org/10.1007/s12237-010-9362-6, 2012.
Mancini, F., Dubbini, M., Gattelli, M., Stecchi, F., Fabbri, S., and Gabbianelli, G.: Using unmanned aerial vehicles (UAV) for high-resolution reconstruction of topography: the structure from motion approach on coastal environments, Remote Sensing, 5, 6880–6898, https://doi.org/10.3390/rs5126880, 2013.
Manson, G. K., Solomon, S. M., Forbes, D. L., Atkinson, D. E., and Craymer, M.: Spatial variability of factors influencing coastal change in the Western Canadian Arctic, Geo-Mar. Lett., 25, 138–145, https://doi.org/10.1007/s00367-004-0195-9, 2005.
Mars, J. C. and Houseknecht, D. W.: Quantitative remote sensing study indicates doubling of coastal erosion rate in past 50 yr along a segment of the Arctic coast of Alaska, Geology, 35, 583–586, https://doi.org/10.1130/G23672A.1, 2007.
Metcalfe, D. B., Hermans, T. D. G., Ahlstrand, J., Becker, M., Berggren, M., Björk, R. G., Björkman, M. P., Blok, D., Chaudhary, N., Chisholm, C., Classen, A. T., Hasselquist, N. J., Jonsson, M., Kristensen, J. A., Kumordzi, B. B., Lee, H., Mayor, J. R., Prevéy, J., Pantazatou, K., Rousk, J., Sponseller, R. A., Sundqvist, M. K., Tang, J., Uddling, J., Wallin, G., Zhang, W., Ahlström, A., Tenenbaum, D. E., and Abdi, A. M.: Patchy field sampling biases understanding of climate change impacts across the Arctic, Nature Ecology & Evolution, 2, 1443, https://doi.org/10.1038/s41559-018-0612-5, 2018.
Myers-Smith, I. H. and Lehtonen, S.: NOAA's Arkctic: The Great Flood of July 2016, Team Shrub: Tundra Ecology Lab, available at: https://teamshrub.com/2016/07/22/noaas-arkctic-the-great-flood-of-july-2016/ (last access: 11 February 2018), 2016.
Myers-Smith, I. H., Grabowski, M. M., Thomas, H. J. D., Angers-Blondin, S., Daskalova, G. N., Bjorkman, A. D., Cunliffe, A. M., Assmann, J. J., Boyle, J. S., McLeod, E., McLeod, S., Joe, R., Lennie, P., Arey, D., Gordon, R. R., and Eckert, C. D.: Eighteen years of ecological monitoring reveals multiple lines of evidence for tundra vegetation change, Ecol. Monogr., 89, e01351, https://doi.org/10.1002/ecm.1351, 2019.
Novikova, A., Belova, N., Baranskaya, A., Aleksyutina, D., Maslakov, A., Zelenin, E., Shabanova, N., and Ogorodov, S.: Dynamics of permafrost coasts of Baydaratskaya Bay (Kara Sea) based on multi-temporal remote sensing data, Remote Sensing, 10, 1481, https://doi.org/10.3390/rs10091481, 2018.
Obu, J., Lantuit, H., Myers-Smith, I., Heim, B., Wolter, J., and Fritz, M.: Effect of terrain characteristics on soil organic carbon and total nitrogen stocks in soils of Herschel Island, Western Canadian Arctic, Permafrost Periglac., 28, 92–107, https://doi.org/10.1002/ppp.1881, 2015.
Obu, J., Lantuit, H., Fritz, M., Pollard, W. H., Sachs, T., and Guenther, F.: Relation between planimetric and volumetric measurements of permafrost coast erosion: a case study from Herschel Island, western Canadian Arctic, Polar Res., 35, 30313, https://doi.org/10.3402/polar.v35.30313, 2016.
Ogorodov, S. A., Baranskaya, A., Belova, N. G., Kamalov, A. M., Kuznetsov, D. E., Overduin, P., Shabanova, N. N., and Vergun, A. P.: Coastal Dynamics of the Pechora and Kara Seas Under Changing Climatic Conditions and Human Disturbances, Geography, Environment, Sustainability, 9, 53–73, https://doi.org/10.15356/2071-9388_03v09_2016_04, 2016.
Olynyk, D.: Buildings, in Herschel Island – Qikiqtaryuk: A natural and cultural history of Yukon's Arctic island, edited by: Burn, C. R., University of Calgary Press, Calgary, Canada, 202–209, 2012.
Overduin, P. P., Strzelecki, M. C., Grigoriev, M. N., Couture, N., Lantuit, H., St-Hilaire-Gravel, D., Günther, F., and Wetterich, S.: Coastal changes in the Arctic, in: Sedimentary Coastal Zones from High to Low Latitudes: Similarities and Differences, Geological Society, London, UK, Special Publications, 388, 103–129, https://doi.org/10.1144/SP388.13, 2014.
Ping, C.-L., Michaelson, G. J., Guo, L., Jorgenson, M. T., Kanevskiy, Shur, Y., Dou, F., and Liang, J.: Soil carbon and material fluxes across the eroding Alaska Beaufort Sea coastline, J. Geophys. Res., 116, G02004, https://doi.org/10.1029/2010JG001588, 2011.
Pollard, W.: The Nature and Origin of Ground Ice in the Herschel Island Area, Yukon Territory, in: 5th Canadian Permafrost Conference, Universite Laval, Québec, 6–8 June 1990.
Radosavljevic, B., Lantuit, H., Pollard, W., Overduin, P., Couture, N., Sachs, T., Helm, V., and Fritz, M.: Erosion and Flooding-Threats to Coastal Infrastructure in the Arctic: A Case Study from Herschel Island, Yukon Territory, Canada, Estuaries Coasts, 39, 900–915, https://doi.org/10.1007/s12237-015-0046-0, 2016.
Rampton, V. N.: Quaternary geology of the Yukon Coastal Plain, Geological Survey of Canada, Bulletin 317, 49 pp., https://doi.org/10.4095/111347, 1982.
Retamal, L., Bonilla, S., and Vincent, W. F.: Optical gradients and phytoplankton production in the Mackenzie River and the coastal Beaufort Sea, Polar Biol., 31, 363–379, https://doi.org/10.1007/s00300-007-0365-0, 2008.
Richter-Menge, J., Overland, J. E., Mathis, J. T., and Osborne, E.: Arctic Report Card 2017, available at: http://www.arctic.noaa.gov/Report-Card (last access: 10 May 2019), 2017.
Río, L. D. and Gracia, F. J.: Error determination in the photogrammetric assessment of shoreline changes, Nat. Hazards, 65, 2385–2397, https://doi.org/10.1007/s11069-012-0407-y, 2013.
Schuur, E. A. G., McGuire, A. D., Schädel, C., Grosse, G., Harden, J. W., Hayes, D. J., Hugelius, G., Koven, C. D., Kuhry, P., Lawrence, D. M., Natali, S. M., Olefeldt, D., Romanovsky, V. E., Schaefer, K., Turetsky, M. R., Treat, C. C., and Vonk, J. E.: Climate change and the permafrost carbon feedback, Nature, 520, 171–179, https://doi.org/10.1038/nature14338, 2015.
Semiletov, I., Pipko, I., Gustafsson, Ö., Anderson, L. G., Sergienko, V., Pugach, S., Dudarev, O., Charkin, A., Gukov, A., Bröder, L., Andersson, A., Spivak, E., and Shakhova, N.: Acidification of East Siberian Arctic Shelf waters through addition of freshwater and terrestrial carbon, Nat. Geosci., 9, 361–365, https://doi.org/10.1038/ngeo2695, 2016.
Serreze, M. C. and Barry, R. G.: Processes and impacts of Arctic amplification: A research synthesis, Global Planet. Change, 77, 85–96, https://doi.org/10.1016/j.gloplacha.2011.03.004, 2011.
Solomon, S. M., Forbes, D. L., and Kierstead, B.: Coastal impacts of climate change: Beaufort Sea erosion study, Natural Resources Canada, Geological Survey of Canada, Ottawa, Ontario, Open File Number 2890, M183-2/2890E-PDF, available at: http://publications.gc.ca/site/eng/9.820125/publication.html (last access: 5 December 2018), 1993.
Sona, G., Pinto, L., Pagliari, D., Passoni, D., and Gini, R.: Experimental analysis of different software packages for orientation and digital surface modelling from UAV images, Earth Sci. Inform., 7, 97–107, https://doi.org/10.1007/s12145-013-0142-2, 2014.
Stow, D. A., Hope, A., McGuire, D., Verbyla, D., Gamon, J., Huemmrich, F., Houston, S., Racine, C., Sturm, M., Tape, K., Hinzman, L., Yoshikawa, K., Tweedie, C., Noyle, B., Silapaswan, C., Douglas, D., Griffith, B., Jia, G., Epstein, H., Walker, D., Daeschner, S., Petersen, A., Zhou, L., and Myneni, R.: Remote sensing of vegetation and land-cover change in Arctic Tundra Ecosystems, Remote Sens. Environ., 89, 281–308, https://doi.org/10.1016/j.rse.2003.10.018, 2004.
Stroeve, J. C., Markus, T., Miller, J., and Barrett, A.: Changes in Arctic melt season and implications for sea ice loss, Geophys. Res. Lett., 41, 1216–1225, https://doi.org/10.1002/2013GL058951, 2014.
Thieler, E. R., Himmelstoss, E. A., Zichichi, J. L., and Ergul, A.: The Digital Shoreline Analysis System (DSAS) Version 4.0 – An ArcGIS extension for calculating shoreline change (Ver.4.4, July 2017), USGS Numbered Series, U.S. Geological Survey, Reston, Open-File Report 2008-1278, https://doi.org/10.3133/ofr20081278, 2009.
Turner, I. L., Harley, M. D., and Drummond, C. D.: UAVs for coastal surveying, Coast. Eng., 114, 19–24, https://doi.org/10.1016/j.coastaleng.2016.03.011, 2016.
UNEP: Policy Implications of Warming Permafrost, UNEP, available at: https://epic.awi.de/33086/1/permafrost.pdf (last access: 10 May 2019), 2012.
UNESCO: Ivvavik/Vuntut/Herschel Island (Qikiqtaruk), UNESCO World Heritage Centre, available at: http://whc.unesco.org/en/tentativelists/1939/ (last access: 7 February 2018), 2004.
Vasiliev, A., Kanevskiy, M., Cherkashov, G., and Vanshtein, B.: Coastal dynamics at the Barents and Kara Sea key sites, Geo-Mar. Lett., 25, 110–120, https://doi.org/10.1007/s00367-004-0192-z, 2005.
Vonk, J. E., Sánchez-García, L., Dongen, B. E. van, Alling, V., Kosmach, D., Charkin, A., Semiletov, I. P., Dudarev, O. V., Shakhova, N., Roos, P., Eglinton, T. I., Andersson, A., and Gustafsson, Ö.: Activation of old carbon by erosion of coastal and subsea permafrost in Arctic Siberia, Nature, 489, 137–140, https://doi.org/10.1038/nature11392, 2012.
Wegner, C., Bennett, K. E., Vernal, A. de, Forwick, M., Fritz, M., Heikkilä, M., Łącka, M., Lantuit, H., Laska, M., Moskalik, M., O'Regan, M., Pawłowska, J., Promińska, A., Rachold, V., Vonk, J. E., and Werner, K.: Variability in transport of terrigenous material on the shelves and the deep Arctic Ocean during the Holocene, Polar Res., 34, 24964, https://doi.org/10.3402/polar.v34.24964, 2015.
Wessel, P. and Smith, W. H. F.: A Global, Self-Consistent, Hierarchical, High-Resolution Shoreline Database, J. Geophys. Res., 101, 8741–8743, https://doi.org/10.1029/96JB00104, 1996.
Westoby, M. J., Brasington, J., Glasser, N. F., Hambrey, M. J., and Reynolds, J. M.: 'Structure-from-motion' photogrammetry: A low-cost, effective tool for geoscience applications, Geomorphology, 179, 300–314, https://doi.org/10.1016/j.geomorph.2012.08.021, 2012.
Whalen, D.: Monitoring, understanding and predicting costal change in the Mackenzie-Beaufort Region, NT, Quebec City, Quebec, Canada, 2017.
Whalen, D., Fraser, R., and MacLeod, R.: The acceleration of change – how UAV technology is being used to better understand coastal permafrost landscapes in the Mackenzie-Beaufort Region, NT, ArcticNet, available at: http://www.arcticnet.ulaval.ca/pdf/media/IRIS-1-newsletter-Dec-2017.pdf (last access: 10 May 2019), 2017.
Wobus, C., Anderson, R., Overeem, I., Matell, N., Clow, G., and Urban, F.: Thermal erosion of a permafrost coastline: improving process-based models using time-lapse photography, Arct. Antarct. Alp. Res., 43, 474–484, https://doi.org/10.1657/1938-4246-43.3.474, 2011.