the Creative Commons Attribution 4.0 License.
the Creative Commons Attribution 4.0 License.
 | 28 Jan 2020
Glacial sedimentation, fluxes and erosion rates associated with ice retreat in Petermann Fjord and Nares Strait, north-west Greenland
Martin Jakobsson
Larry Mayer
Brendan T. Reilly
Anne E. Jennings
Joseph S. Stoner
Tove Nielsen
Katrine J. Andresen
Egon Nørmark
Katrien A. Heirman
Elina Kamla
Kevin Jerram
Christian Stranne
Alan Mix
Petermann Fjord is a deep (>1000 m) fjord that incises the coastline of north-west Greenland and was carved by an expanded Petermann Glacier, one of the six largest outlet glaciers draining the modern Greenland Ice Sheet (GrIS). Between 5 and 70 m of unconsolidated glacigenic material infills in the fjord and adjacent Nares Strait, deposited as the Petermann and Nares Strait ice streams retreated through the area after the Last Glacial Maximum. We have investigated the deglacial deposits using seismic stratigraphic techniques and have correlated our results with high-resolution bathymetric data and core lithofacies. We identify six seismo-acoustic facies in more than 3500 line kilometres of sub-bottom and seismic-reflection profiles throughout the fjord, Hall Basin and Kennedy Channel. Seismo-acoustic facies relate to bedrock or till surfaces (Facies I), subglacial deposition (Facies II), deposition from meltwater plumes and icebergs in quiescent glacimarine conditions (Facies III, IV), deposition at grounded ice margins during stillstands in retreat (grounding-zone wedges; Facies V) and the redeposition of material downslope (Facies IV). These sediment units represent the total volume of glacial sediment delivered to the mapped marine environment during retreat. We calculate a glacial sediment flux for the former Petermann ice stream as 1080–1420 m3 a−1 per metre of ice stream width and an average deglacial erosion rate for the basin of 0.29–0.34 mm a−1. Our deglacial erosion rates are consistent with results from Antarctic Peninsula fjord systems but are several times lower than values for other modern GrIS catchments. This difference is attributed to fact that large volumes of surface water do not access the bed in the Petermann system, and we conclude that glacial erosion is limited to areas overridden by streaming ice in this large outlet glacier setting. Erosion rates are also presented for two phases of ice retreat and confirm that there is significant variation in rates over a glacial–deglacial transition. Our new glacial sediment fluxes and erosion rates show that the Petermann ice stream was approximately as efficient as the palaeo-Jakobshavn Isbræ at eroding, transporting and delivering sediment to its margin during early deglaciation.
- Article
(35938 KB) -
Supplement
(459 KB) - BibTeX
- EndNote


The volume and distribution of glacial sediment in fjords is largely a function of the retreat behaviour of the marine-terminating glaciers that occupy them. This sediment infill is the final product of material eroded across the catchment area, transported to the ice margin by glacial processes and ultimately released into fjord basins as grounded ice decays. As a result, these sedimentary archives can provide information about both (i) ice-retreat dynamics and (ii) glacial erosion rates and sediment fluxes, that relate to periods of past climatic warming and associated glacier retreat. The present decay of the Greenland Ice Sheet (GrIS), and its accelerating contribution to sea level rise (Chen et al., 2017), is occurring predominantly through mass loss from its marine-terminating outlet glaciers (Mouginot et al., 2019). This will likely enhance glacial erosion rates and, therefore, sediment influx to the global ocean. This has implications for marine biogeochemical cycles (e.g. Hawkings et al., 2015) and ultimately organic carbon sequestration in fjord sediments, which are a known hotspot for carbon burial (Smith et al., 2015). Yet we have very few estimates of glacial erosion or sediment fluxes for either the present-day GrIS or for past configurations of the ice sheet (Hallet et al., 1996; Overeem et al., 2017). Obtaining in situ observations of sediment fluxes close to the margins of Greenland's major marine-terminating glaciers remains logistically difficult. Thus, investigations of the sediment infill of fjords provide an important tool for quantifying rates of glacial erosion and sediment transport to the global ocean, as well as for reconstructing glacier behaviour and its drivers beyond the observational record.
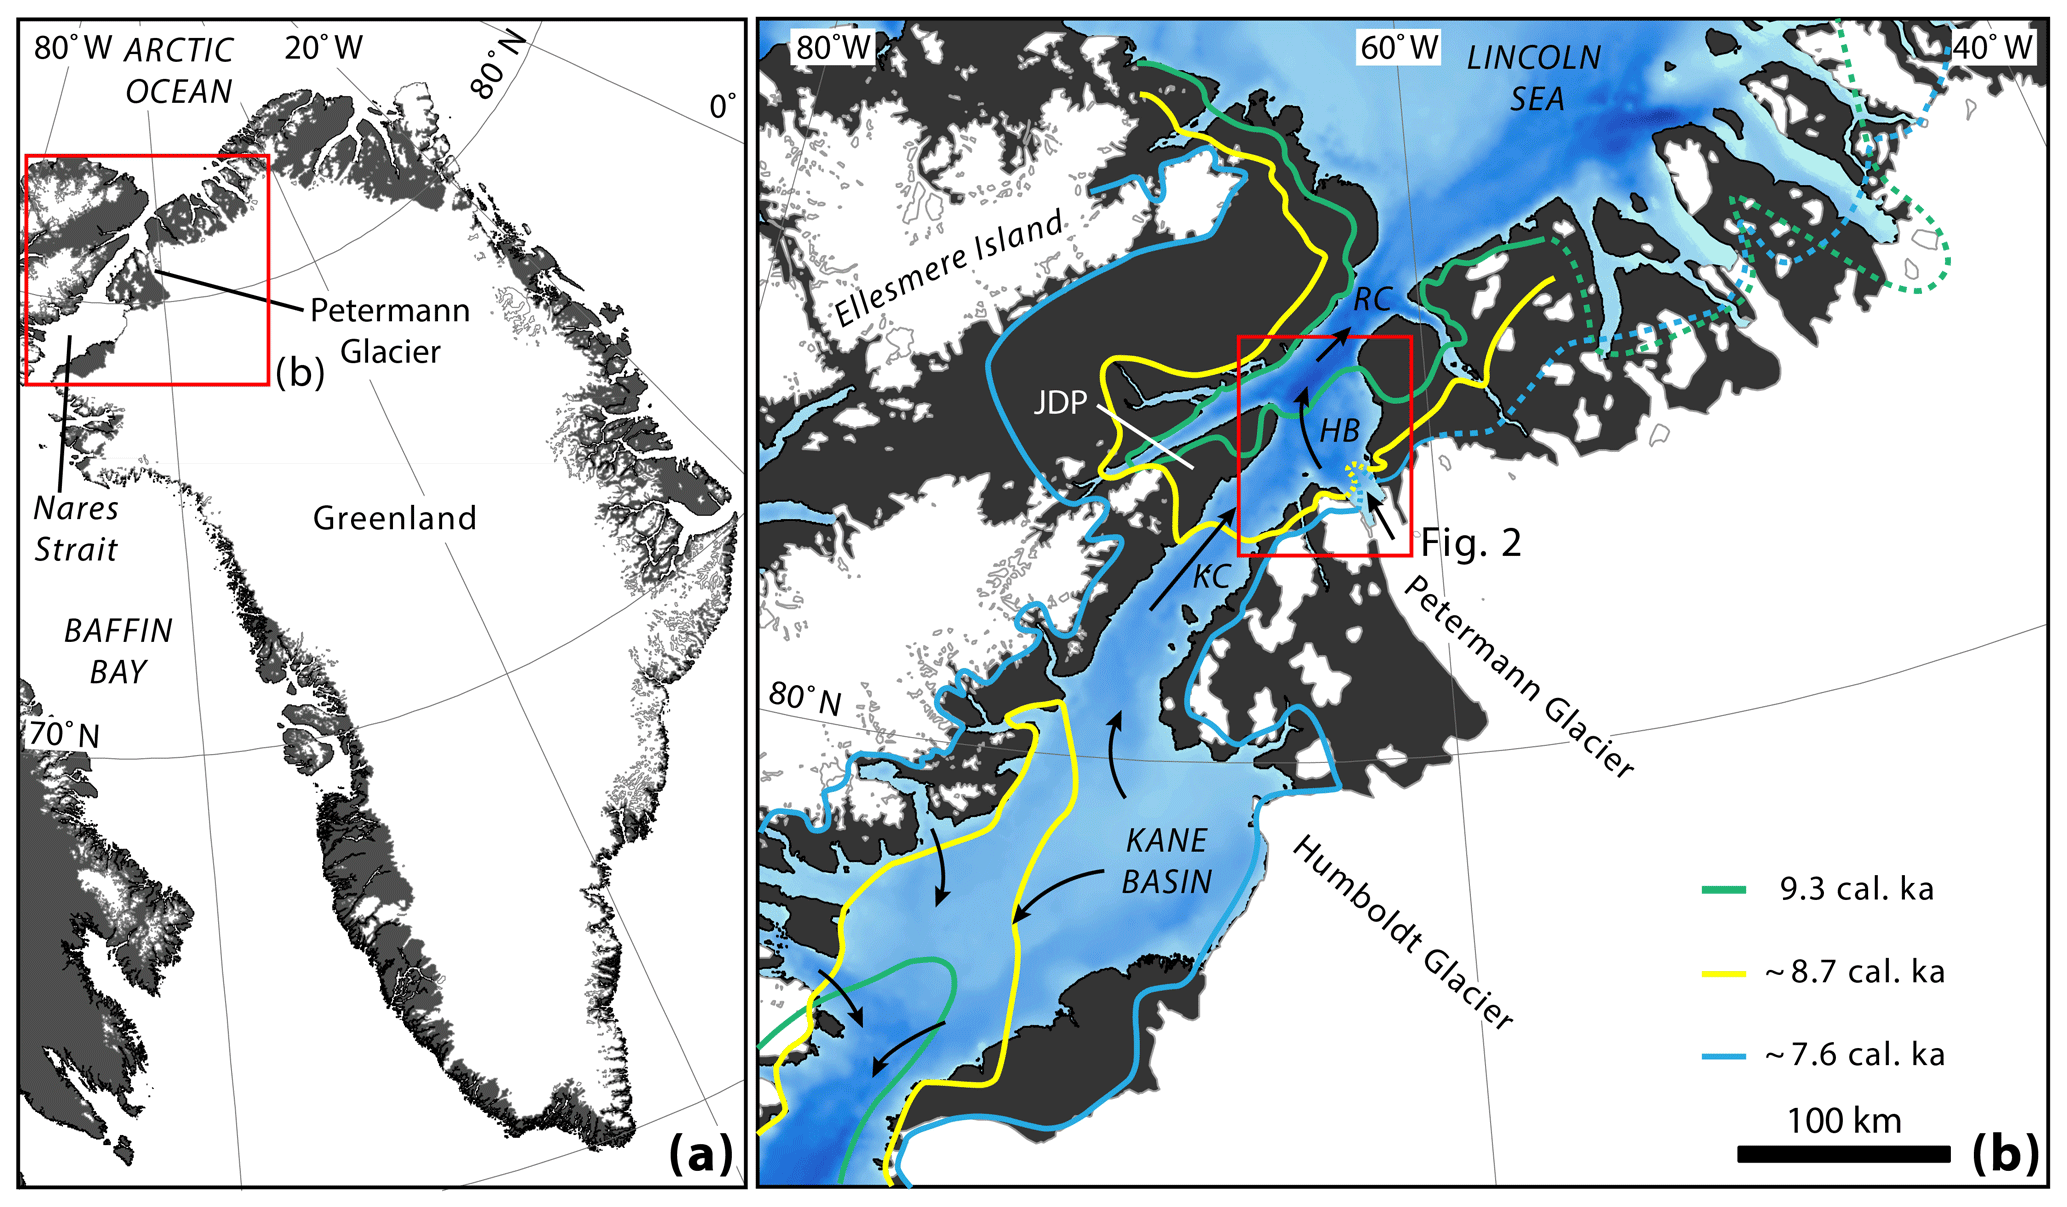
Figure 1Maps of Greenland and the study area. (a) Location of Petermann Glacier and Nares Strait. (b) Location of the study area (red box; Fig. 2) in Petermann Fjord and the adjacent Nares Strait including Hall Basin (HB), Kennedy Channel (KC) and Robeson Channel (RC); JDP is Judge Daly Promontory. Ice flow in marine areas (black arrows) and deglacial ice-sheet margins for the early Holocene (9.3, ∼8.7 and ∼7.6 ka cal BP) are also shown for Nares Strait and were compiled from England (1999), Georgiadis et al. (2018) and Jakobsson et al. (2018). Dashed lines outside of this area are from Young and Briner (2015) and references therein.
Many studies of fjord infill exist for Norwegian, Svalbard and Alaskan fjords; however, in Greenland, ship-based research is hampered by difficult ice conditions and relatively remote locations, issues that generally increase in complexity further north. Fjords housing major outlet glaciers are often choked by an ice mélange – a dense pack of calved icebergs and sea ice (see Amundsen et al., 2010) – that renders some fjords almost inaccessible to research vessels. This situation is augmented in northern Greenland by persistent sea-ice cover cementing icebergs together in winter and extending far beyond the coast for up to 11 months of the year (DMI, 2018). As a result, there are only a few previous studies of marine sediments from northern Greenland that are based on sediment cores (e.g. Jennings et al., 2011, 2019; Madaj, 2016; Reilly et al., 2019) and none with extensive or detailed geophysical mapping of the glacial sediment infill in fjords. For comparison, some geophysical surveys do exist from central and southern Greenland fjords that tend to be ice-free more often (e.g. Uenzelmann-Neben et al., 1991; Andrews et al., 1994; Gilbert et al., 1998, 2002; Ó Cofaigh et al., 2001, 2016; Evans et al., 2002). However, these typically have only a small number of survey lines to represent an entire fjord system, show only a few profiles as exemplars and/or have not mapped the sediment stratigraphy in detail. This data gap was addressed by the Petermann 2015 Expedition, which collected, in addition to terrestrial, biological and oceanographic datasets (Münchow et al., 2016; Heuzé et al., 2017; Lomac-MacNair et al., 2018), a comprehensive suite of marine geophysical and geological data from Petermann Fjord and the adjacent part of Nares Strait, north-west Greenland (Figs. 1b, 2) (Jakobsson et al., 2018). Combining systematic classification and mapping of the seismic (acoustic) datasets with seafloor geomorphology provides a means to correlate sediment infill with glacidynamic processes leading to an improved understanding of the Holocene retreat of the Petermann and Nares Strait ice streams (see England, 1999; Jakobsson et al., 2018).
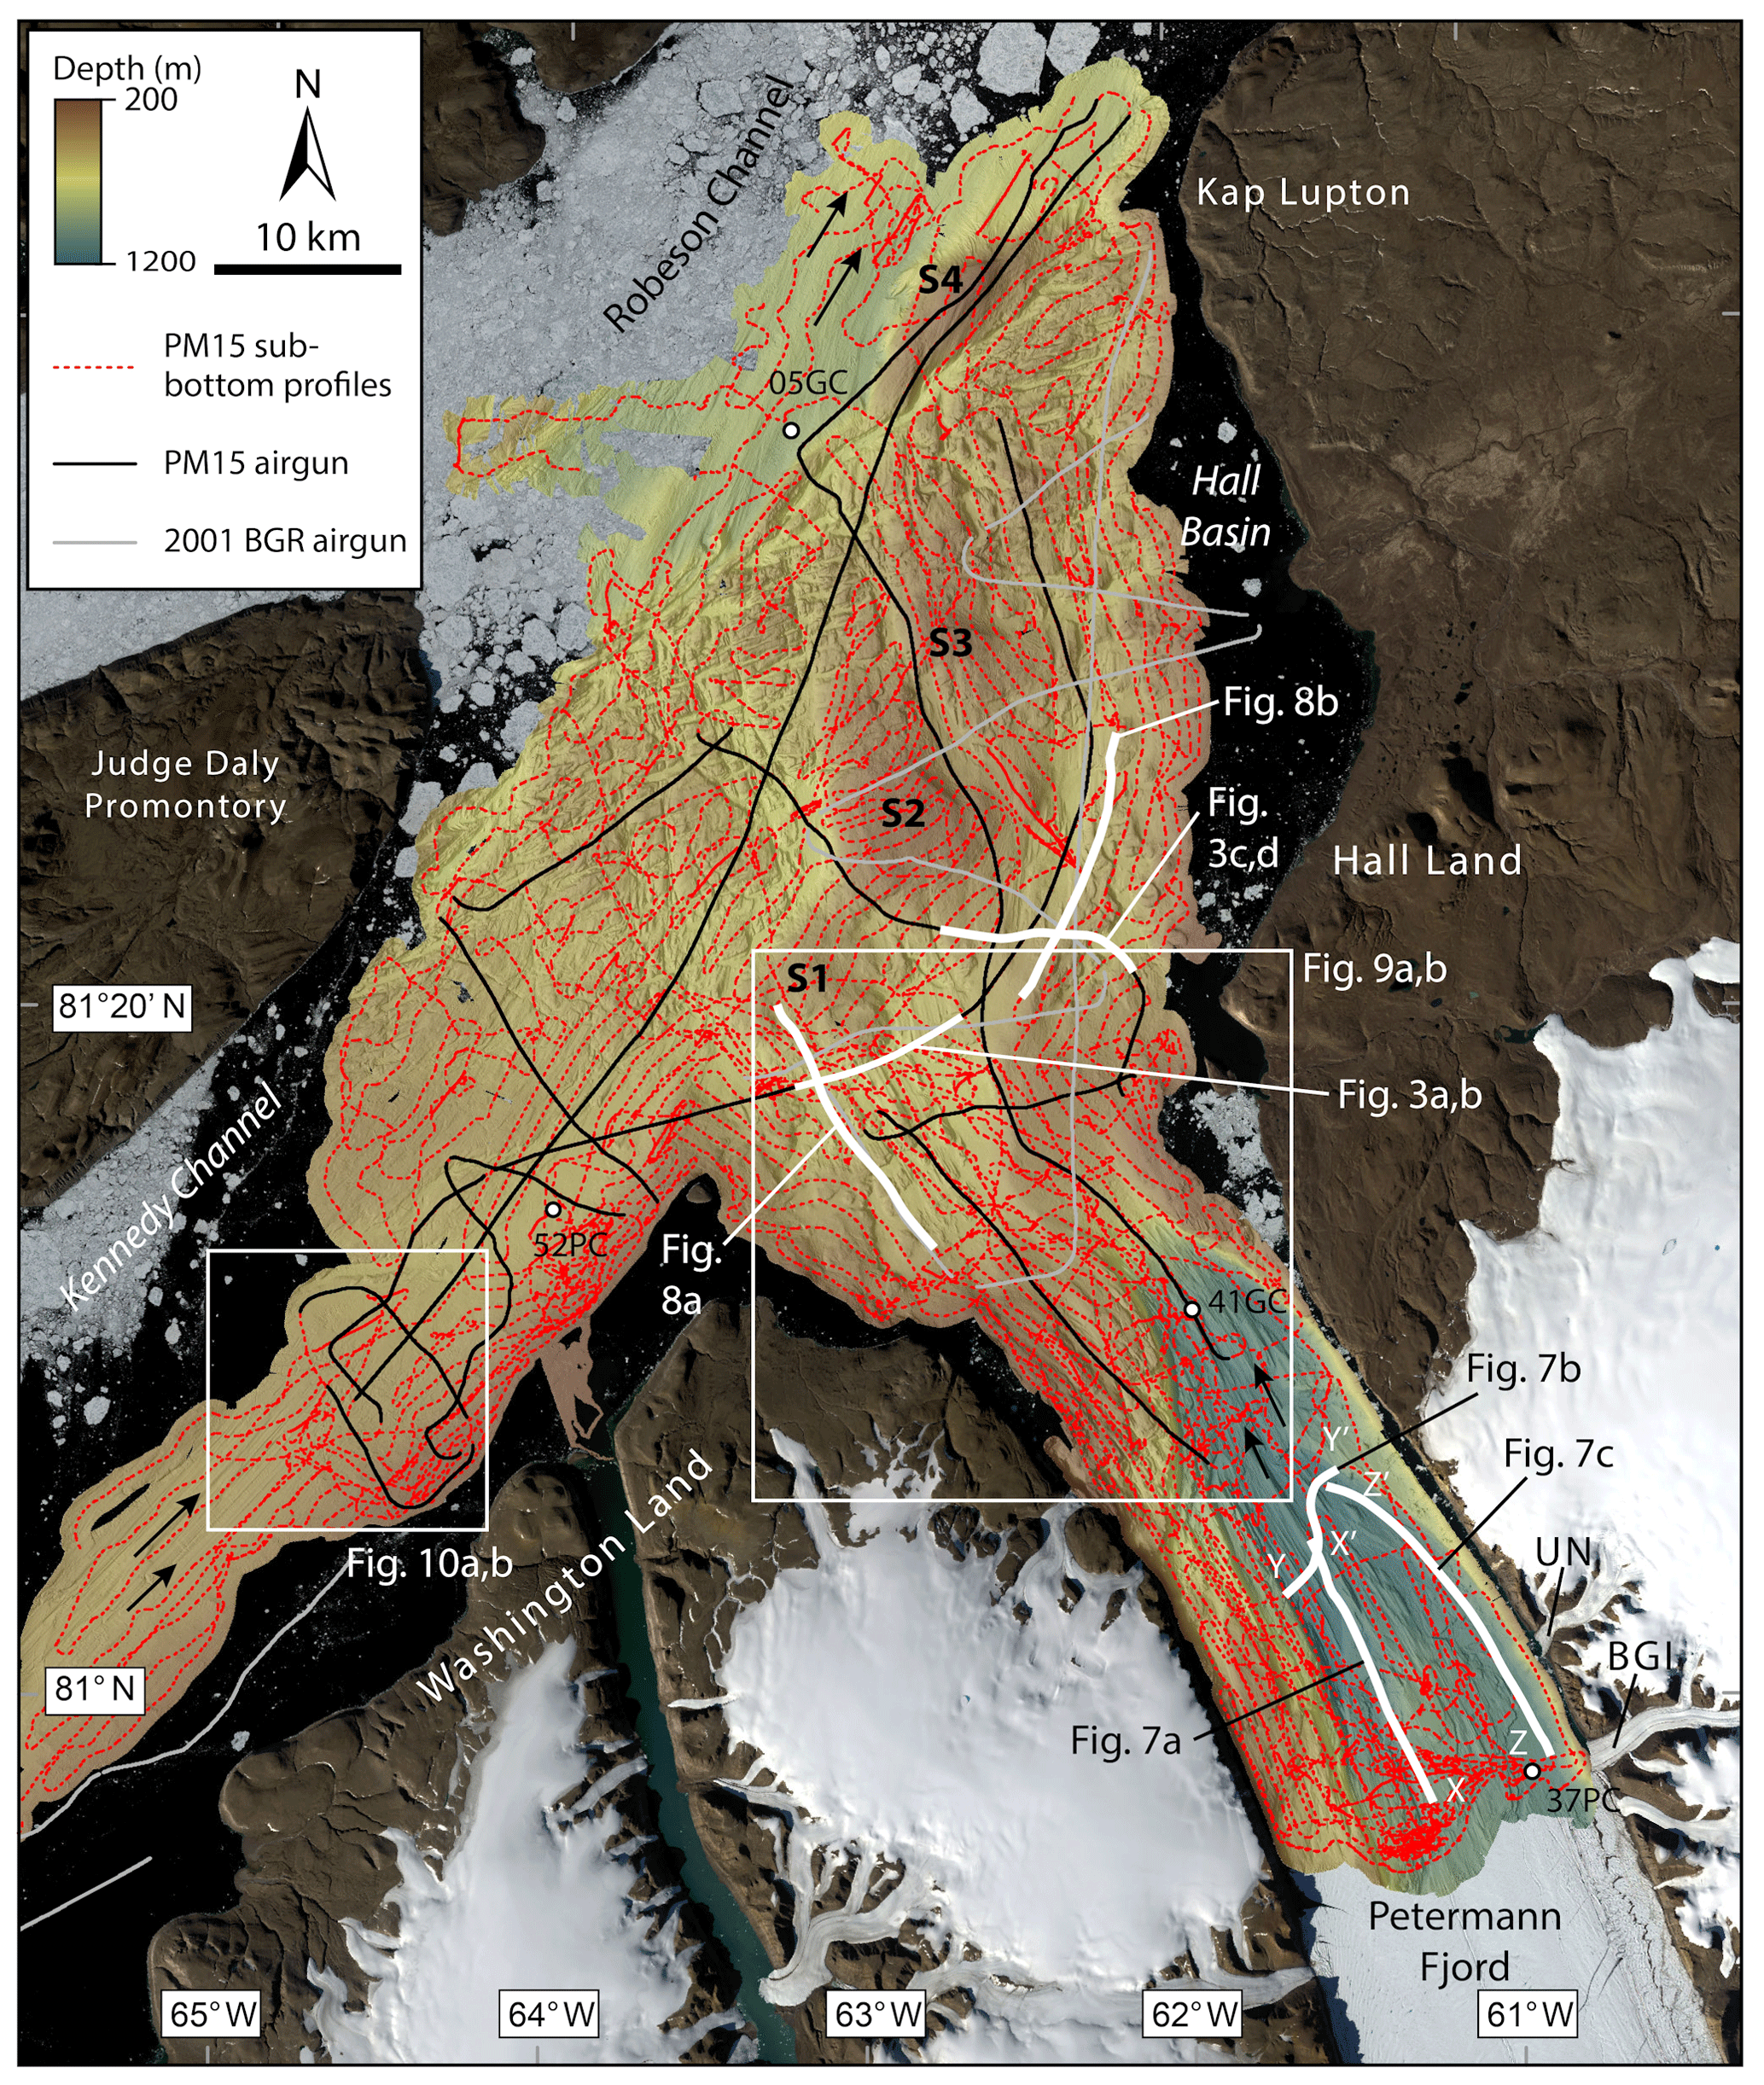
Figure 2The locations of SBP profiles (red dashed), 2015 AG profiles (black) and 2001 legacy AG profiles (grey) shown over the gridded multibeam bathymetry for the area. S1–S4 are the bathymetric highs described by Jakobsson et al. (2018) and referred to in the text. UN is unnamed glacier; BGl is Belgrade Glacier. Glacial lineations denoting the former directions of ice flow are shown as black arrows (after Jakobsson et al., 2018). Sediment cores used to correlate seismo-acoustic facies with sediment lithofacies are also shown.
This study reconstructs de- and post-glacial sedimentary processes and fluxes in Petermann Fjord and the adjacent stretch of Nares Strait (Fig. 1b) using seismic stratigraphy and seismo-acoustic facies. The objectives are (1) to map glacimarine sediment units, interpret their seismic stratigraphy and calculate their volumes; (2) to derive deglacial sediment fluxes and erosion rates; (3) to compare our results with other high-latitude fjord settings (Northern and Southern Hemisphere) considering regional variations; and (4) to provide geological boundary conditions for numerical glacier modelling exercises. This is the first study to employ high-resolution seismo-acoustic methods with such a high density of survey lines, meaning that the sediment stratigraphy of a fjord beyond a major Greenland outlet glacier has been revealed and mapped in unprecedented detail. It is also the first dataset from the northern part of the landmass. It sheds new light on glacial erosion rates for Greenland over millennial timescales and provides quantitative estimates of the sediment flux to the ocean from a major Greenland glacier.
2.1 Physiography and hydrography
Nares Strait is the narrow body of water between north-west Greenland and Ellesmere Island that opens out northwards in to the Lincoln Sea and Arctic Ocean (Fig. 1). The northern part of the strait consists of Robeson Channel, Hall Basin and Kennedy Channel and is typically around 30 km wide, 400–800 m deep. The Kennedy and Robeson channels have generally smooth seafloors, whereas Hall Basin is somewhat wider (∼40–60 km) and has a notably rougher or fractured seafloor beyond the mouth of Petermann Fjord (Jakobsson et al., 2018; Fig. 2). The bedrock geology in the area consists of Precambrian basement rocks capped by Palaeozoic platform limestones that have been dissected by two sets of approximately orthogonal faults trending NNE–SSW and N–S. The Wegener Transform Fault, crossing from Judge Daly Promontory to Kap Lupton (Fig. 2) in the study area and extending northwards in Nares Strait (Dawes, 2004; Tessensohn et al., 2006), provides a strong structural control on seafloor morphology in Hall Basin (Jakobsson et al., 2018).
Petermann Fjord is a deep (>1000 m), relatively flat-bottomed fjord with a straight planform shape that is 15–20 km wide. The fjord walls have steep gradients (>70∘) resulting in a box-like cross section. The most prominent bathymetric feature of the fjord is a sill at the fjord mouth rising to between 350 and 450 m water depth but with its deepest part (443 m) about 2 km west of the midline of the fjord mouth (Jakobsson et al., 2018). Modified Atlantic Water (AW) flows into both Nares Strait and Petermann Fjord from the Lincoln Sea (Münchow et al., 2016; Johnson et al., 2011) but is overlain by a cooler, fresher water mass (Arctic Water) that is also advected into the fjord (Straneo et al., 2012). Oceanographic results from the Petermann 2015 Expedition have shown that water in the fjord is dominated by Atlantic Water at depth (450–600 m) which does not interact with the 40 km long floating ice tongue over the fjord but is thought to reach the grounding line and contribute to melting there (Münchow et al., 2016; Heuzé et al., 2017). Meltwater from Petermann Glacier was also recorded in all 46 hydrographic casts collected in 2015 in the fjord and in Nares Strait, with meltwater exiting the fjord on its northern side at water depths of 100–300 m (Heuzé et al., 2017). The present-day retreat of Greenland's marine-terminating glaciers, including Petermann Glacier, has been partly attributed to warming of the AW that reaches the ice margins and enhances frontal melting (Holland et al., 2008; Rignot et al., 2010; Johnson et al., 2011; Straneo et al., 2012; Heuzé et al., 2017; Cai et al., 2017). Furthermore, AW was present in Hall Basin during deglaciation and may have promoted grounded ice retreat during deglaciation (Jennings et al., 2011).
2.2 Late Weichselian to Holocene glacial history
During the Last Glacial Maximum (LGM), the ice sheet in northern Greenland was coalescent with the Innuitian Ice Sheet over Ellesmere Island (England, 1999; England et al., 2006), and grounded ice occupied Nares Strait. The distribution and magnitude of isostatic rebound in the area suggests that ice was at least 1 km thick in the strait, and terrestrial landforms indicate that Greenland ice extended across to the eastern side of Ellesmere Island (England, 1999). Ice is thought to have been distributed northward and southward from Kane Basin in the central Nares Strait (Fig. 1b), with deglaciation of the strait occurring from its northern and southern ends from 11.3 and 11.7–11.2 ka cal BP, respectively (recalibrated from England, 1999; Jennings et al., 2019). A sediment core from the north-eastern Hall Basin indicates that this area, in front of Petermann Fjord, was free from grounded ice by 9.7 ka cal BP and was experiencing distal glacimarine conditions by 8.9 ka cal BP (Jennings et al., 2011). Further south, dates from a core in Kane Basin show that it had deglaciated around 9.0 ka cal BP (Georgiadis et al., 2018) (Fig. 1b). Owing to uncertainties in the reservoir corrections for the area and differences in the material dated for deglacial ages, there is still some debate as to when the ice saddle between north-west Greenland and Ellesmere Island disintegrated. However, a recent study by Jennings et al. (2019) discussed this issue in detail and concluded that the strait could have opened as early as 9.0 ka cal BP or as late as 8.3 ka cal BP.
Reconstructions of full-glacial ice flow in the area include north-eastward flow out of Nares Strait contributing to eastward flow of ice along the north Greenland coastal plain (Möller et al., 2010; Larsen et al., 2010; Funder et al., 2011). North of Kane Basin, strong convergent flow from the Innuitian and Greenland ice sheets, as evidenced by glacial striae and erratics, probably resulted in an ice stream in Nares Strait (England et al., 2006). This flow pattern is supported by recent mapping of submarine landforms including mega-scale glacial lineations (MSGL) in the Kennedy and Robeson channels which indicate northward movement of fast-flowing grounded ice in the strait, most likely representing the late deglacial imprint of grounded ice activity (Jakobsson et al., 2018). A change in lineation orientation close to the mouth of Petermann Fjord was interpreted as a signature of ice exiting the fjord and merging with ice flow in Nares Strait causing a slight deflection in the flow pattern (Jakobsson et al., 2018).
By combining terrestrial evidence with the submarine landform record, Jakobsson et al. (2018) suggested the following sequence of events for the deglaciation of the northern Nares Strait and Petermann Fjord (see Fig. 1b for location). All ages were inferred by correlating the mapped marine landforms to dated ice margins on land by England (1999). Since the ice margins on land were presented as uncalibrated 14C years BP (England, 1999), the calibration to calendar years was made by Jakobsson et al. (2018) using the Marine13 radiocarbon age calibration curve (Reimer et al., 2013) and a years.
At 9.3 ka cal BP (1σ range: 9440–9140 cal BP) the retreating ice margin was grounded between Kap Lupton and the Judge Daly Promontory (Fig. 1b) along a prominent bathymetric shoaling (S4 on Fig. 2). At this time, there is evidence for abundant meltwater release and ice stagnation on the eastern side of Hall Basin. By 8.7 ka cal BP (1σ range: 8835–8459 cal BP) the ice margin is thought to have retreated to the mouth of Petermann Fjord where it rested on the prominent fjord-mouth sill (Fig. 1b) and was probably fronted by an ice tongue. A significant sedimentary wedge – a grounding-zone wedge (GZW) – built up on the sill and reinforced ice-margin stability at this location (see Alley et al., 2007; Dowdeswell and Fugelli, 2012). The ice margin subsequently lost its ice shelf and retreated down the backside of the sill as a tidewater glacier cliff, possibly due to catastrophic calving by a process termed marine ice cliff instability (Pollard et al., 2015). Based on terrestrial dates this is inferred to have occurred around 7.6 ka cal BP (1σ range: 7740–7495 cal BP), after which the retreat of grounded ice through the remainder of the fjord was rapid. Recent sedimentological work suggests that the fjord was probably not covered by a floating ice tongue directly after this rapid retreat of the grounded Petermann ice stream (which became Petermann Glacier), for around 5000 years in the mid-Holocene (Reilly et al., 2019). The modern glaciologic setting, which includes a 40 km long floating tongue, did not develop until ca. 2.2 ka cal BP (Reilly et al., 2019).
3.1 Geophysical datasets
Two primary geophysical datasets were used in this study: high-resolution, sub-bottom profiles (SBP) and airgun seismic-reflection profiles (AG), both collected during the Petermann 2015 Expedition to the Petermann Fjord and Nares Strait area in 2015 on the Icebreaker (IB) Oden. More than 3100 line kilometres of SBP were acquired using the hull-mounted parametric Kongsberg SBP 120, which transmits a low-frequency (2.5–7 kHz) chirp pulse with a narrow (3∘) main beam. Vertical resolution of the SBP profiles is approximately 0.35 ms (∼70 cm using a sediment velocity of 1500 m s−1). Penetration was up to 60 m in unlithified sediments, and the quality of the SBP data was generally good, although frequently influenced by noise from ice breaking. Two artefacts are prominent in the data: (i) on steep slopes, side echoes and the scattering of acoustic energy resulted in returned reflections being diffuse; and (ii) a rugged and hard seafloor generated numerous sidewall echoes and hyperbolae. Line spacing was generally as low as 600 m and rarely exceeded 2.5 km. The multidisciplinary nature of the expedition required an abundance of sampling stations and, in turn, resulted in numerous crossing lines and multiple transects of key areas (Fig. 2). The nature of deeper sediments and bedrock structure was studied using 10 AG profiles (Fig. 2) acquired with a single airgun source (210 in.3 (3.4 L) generator injection (GI) gun with a firing interval of 5 s and a record length of 3 s). The streamer had a total active length of 300 m with 48 hydrophone groups (8 hydrophones each) and was towed at depths of 7–16 m. Navigation for the SBP profiles was taken directly from the ship's Seatex Seapath 320 GPS feed. Motion correction of the SBP data was applied using information provided by the installed Seatex MRU5 motion reference unit. For the AG profiles, a separate Thales DG16 GPS system was used to calculate positions and offset geometries for the ship, source and hydrophones. Heritage seismic-reflection profiles acquired in 2001 were also available and were used to investigate the character of key glacial landforms. These data were acquired by Bundesanstalt für Geowissenschaften und Rohstoffe (BGR) using six GI guns and a 48-channel array (24 hydrophones each) in a 100 m long streamer (shortened due to ice conditions). Details of the acquisition and processing of this dataset (2001 BGR lines on Fig. 2) are provided in Jackson et al. (2006).
Processing of the SBP data involved calculation of instantaneous amplitudes from the correlated SBP 120 output which were then visualized as variable density traces in open-source software (dGB Earth Sciences OpendTect v6.4.0). The 2015 AG profiles were processed using standard processing techniques including geometry definition, amplitude correction and bandpass filtering preserving data in the frequency range of 40–350 Hz. Frequency–wavenumber (FK) filtering was applied in order to remove propeller noise. After CDP (common depth point) stacking and migration, a gentle trace mix and automatic scaling was also applied. The output AG data were interpreted in Petrel 2015 and OpendTect. The seismic datasets were analysed alongside a gridded 3-D surface of the seafloor produced from high-resolution bathymetric data also acquired during the Petermann 2015 Expedition. The bathymetric data were collected using a Kongsberg EM122 (12 kHz) multibeam echosounder with a 1∘ (TX) (RX) array. Data coverage and water depths in the area resulted in the final grid having 15 m square grid cells. Detailed information and interpretation of the multibeam bathymetric dataset is presented in Jakobsson et al. (2018).
3.2 Seismic data interpretation
All output profiles are in two-way travel time (TWT). Seismo-acoustic facies were identified primarily from SBP profiles based on reflection geometry, reflection strength and continuity; these were cross-checked on AG profiles and one additional facies (IV) was identified only on AG profiles. For the SBP data, the profiles were inspected and a coherent and continuous, high-amplitude reflection (R1) at the base of the uppermost unlithified sediment package (often marking the acoustic basement) was identified and digitized (Fig. 3a, c). In general, this reflection was picked manually because auto-tracking methods in OpendTect could not be used due to the variable penetration of the SBP 120, the rugged nature of the reflection, the noise artefacts noted above and some limitations with the 2-D picking algorithm. R1 picks on SBP profiles were supplemented and verified by the deeper-penetrating AG lines (Fig. 3b, d). R1 picks were gridded to make separate 3-D surfaces for Petermann Fjord and Nares Strait, based on the separation of these areas by the shallow sill at the fjord mouth (over which the unlithified sediments disappear on SBP profiles) and the known glacial history of the area (see Sect. 2.2). Isopach maps for the unlithified sediment package were produced by subtracting the depth-converted R1 surface from the multibeam bathymetric digital elevation model of the seafloor; in general, stratigraphic thicknesses in metres in this study have been calculated using a sediment sound velocity of 1500 m s−1 (see Nygård et al., 2007; Hjelstuen et al., 2009; Hogan et al., 2012). Key glacial landforms, predominantly GZWs in this case, were also identified and mapped on the AG and SBP profiles because these landforms indicate former grounding-line locations. Significantly, when they are tied with deglacial chronology, these landforms can be used to calculate sedimentary processes associated with specific time periods and stillstand events (e.g. Callard et al., 2018; Nielsen and Rasmussen, 2018). Base GZW reflections were digitized where AG profiles exist over these features and where they were visible on SBP profiles. These were gridded using the surface splines in the tension algorithm in GMT (Smith and Wessel, 1990), converted to depth below the seafloor, and used to calculate GZW volumes. For the GZWs, volumes were calculated with sediment velocities of 1500 m s−1 but also with the higher value of 1800 m s−1. The latter value is based on previous estimates of velocities in subglacial tills from (over-ice) seismic data (e.g. Smith, 1997; Tulaczyk et al., 1998; King et al., 2004), including recent measurements from Greenland (Hofstede et al., 2018) and on the measured physical properties of coarse shelf sediments including diamictons (e.g. Hamilton, 1969; Cochrane et al., 1995). Thus, for GZW thicknesses and volumes, a range of values is given.

Figure 3Comparison of SBP profiles with coincident AG profiles showing the mapped basal reflector (R1) on SBP profiles and the corresponding reflector (green) on AG profiles. Dotted lines mark the lowermost reflections on each profile; dotted lines and question marks indicate the uncertainty in mapping of the unlithified sediment package over basement. Sub-bottom reflections may be geological boundaries in sedimentary bedrock in Hall Basin. (a) SBP profile acquired on 11 August 2015 in Hall Basin, coincident with AG profile pm15_07 (b). (c) SBP profile from 18 August 2015 also in Hall Basin, coincident with AG profile pm15_12 (d). The location of profiles is shown in Fig. 2; the intersection of Fig. 6b with panels (c) and (d) is shown as vertical grey dashed line.
Table 1Core locations and acquisition information for cores used in seismo-acoustic facies and lithofacies correlations.
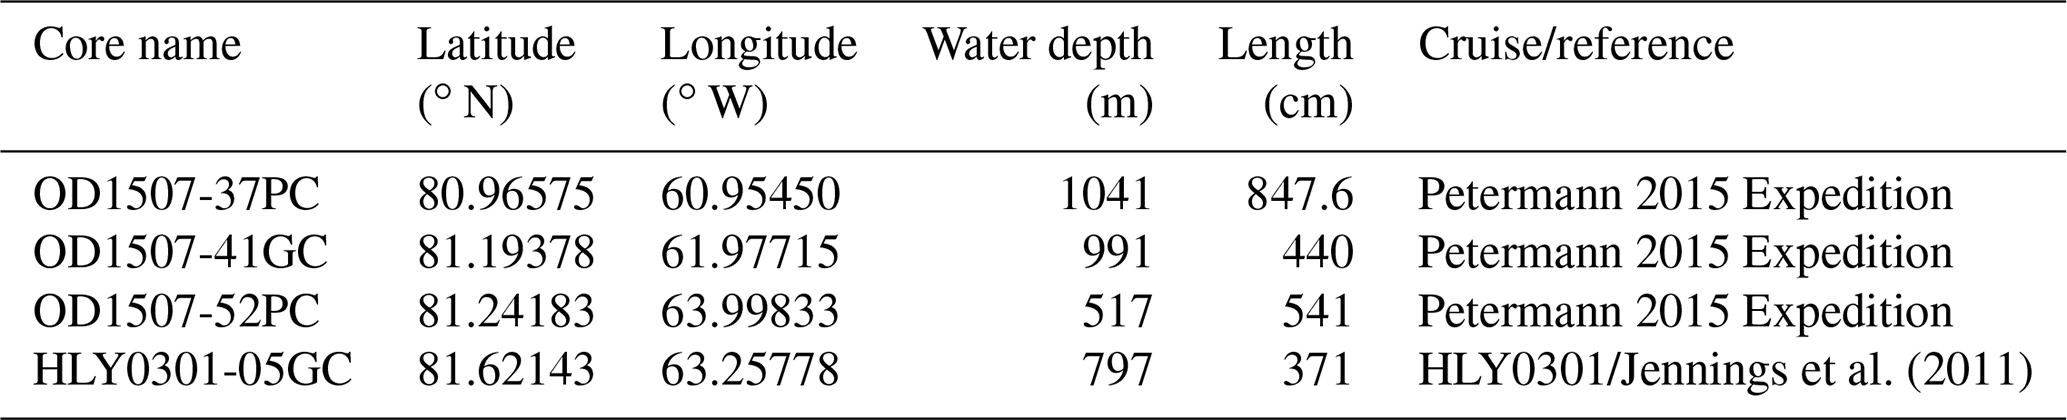
Three sediment cores acquired during the Petermann 2015 Expedition and one previously published core (Table 1; locations in Fig. 2) were used to correlate seismo-acoustic facies with lithofacies. The correlation was based on comparing SBP profiles at individual core sites with core CT scans, photographs and descriptions. Full descriptions of the methods used to acquire the cores and the CT scans can be found in Reilly et al. (2017, 2019).
3.3 Glacial volumes, fluxes and erosion rates
In high-latitude fjords and glacial troughs beyond the coastline, the unlithified sediment accumulation may be taken to represent material deposited since these areas were last occupied by grounded ice, during ice retreat following the LGM (e.g. Aarseth, 1997; Gilbert et al., 1998; Hjelstuen et al., 2009; Hogan et al., 2012; Bellwald et al., 2016; Callard et al., 2018; Neilsen and Rasmussen, 2018). This glacimarine sedimentation has two components (Fig. 4). The first component is coarse or mixed material delivered to the grounding zone subglacially but deposited seaward of there by gravity-flow processes (dark grey on Fig. 4); the second is predominantly fine-grained units (with some coarser particles) that settle out from meltwater plumes within several tens of kilometres from the grounding line (“plumites”; Hesse et al., 1997; yellow on Fig. 4) and as ice-rafted debris (IRD). Here, we have mapped total glacimarine sediment volumes for the Petermann Fjord–Nares Strait system and then used these volumes to calculate glacial sediment fluxes and erosion rates.
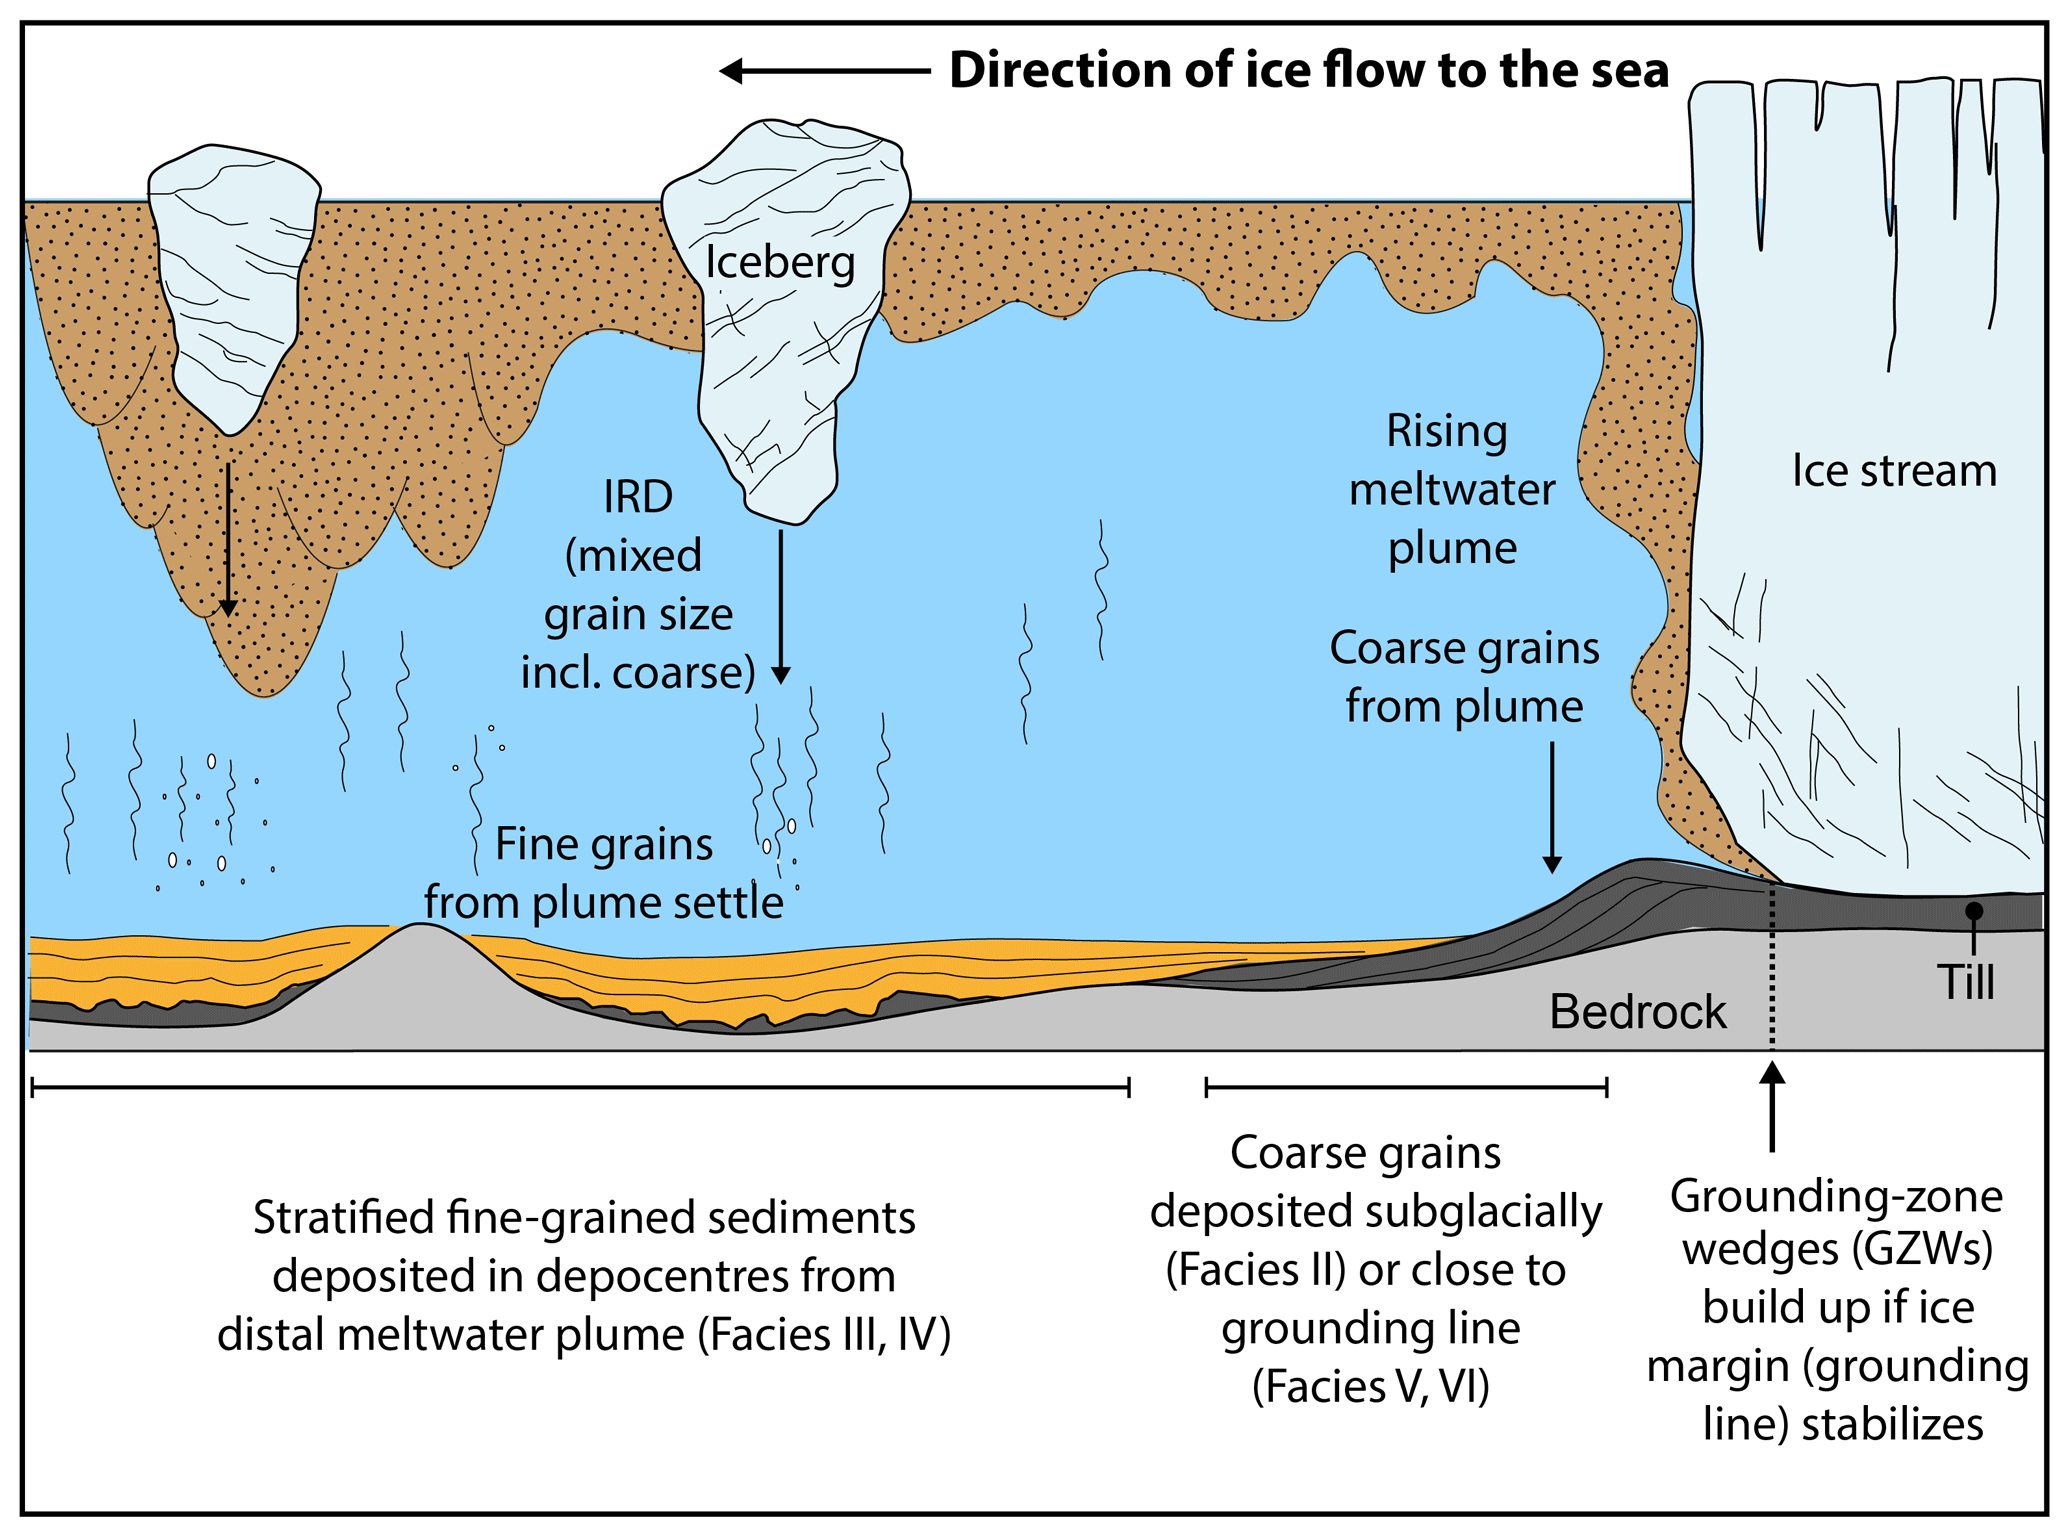
Figure 4Processes of glacimarine sedimentation at the marine-terminating margin of a Greenland outlet glacier (no ice shelf/tongue). The related seismo-acoustic facies as mapped in the Petermann–Nares Strait system are shown at the bottom of the figure.
We make two adjustments to the mapped volumes before calculating sediment fluxes and erosion rates. First, we assume that our marine study areas were fully excavated (to bedrock) by grounded ice during the previous glacial event. This assumption is required because we are not able to distinguish pre-LGM sediments in our data even though we acknowledge that older (pre-LGM) sediment is sometimes preserved in these settings (e.g. Hooke and Elverhøi, 1996; Aarseth, 1997; O'Regan et al., 2017; Jennings et al., 2019). This assumption is justified by theoretical studies of glacial erosion/sediment transport, which are based on observations, that most often suggest that fjords are rapidly and fully excavated during glacial advances (Powell, 1984; Aarseth, 1997; Hjelstuen et al., 2009). Likewise, this assumption is usually applied to studies of fjord sediment volumes used to calculate glacial erosion rates (e.g. Powell et al., 1991; Hunter, 1994; Hallet et al., 1996). We derive some support for this assumption from the seafloor morphology of Petermann Fjord and Hall Basin. Ice-sculpted bedrock surfaces of probably LGM age are clearly visible across much of the area (Jakobsson et al., 2018), indicating that significant pre-LGM sediments most likely do not remain in the fjord. We also note that, although it is possible for pre-LGM sediments to be present, if they are too deep to be resolved on our SBP profiles then they have not been included in our volume estimates. Furthermore, if they are preserved as the lowermost part of the stratigraphy (i.e. most likely in basins), they are probably not volumetrically significant because there are relatively few basins containing thick sediments in the area (e.g. Fig. 12). Still, we acknowledge this potential source of error in our estimations. Second, we elect to remove 0.5 m of sediment cover for all mapped areas because dates from nearby sediment cores reveal that the upper ∼0.5 m of the stratigraphy was deposited after the ice margin had retreated into the fjord (Jennings et al., 2011, 2018); essentially, these uppermost sediments are not associated with a nearby ice margin. We also assume that other sediment sources (biogenic, aeolian, sidewall erosion) are volumetrically insignificant, which is typically the case in polar fjord settings (Powell, 2005). This is supported by total organic carbon (TOC) measurements on core tops from the area that return extremely low percentages of TOC (≪0.5 %) (Anne Jennings, personal communication, 2019), as well as by the lack of widespread flow deposits in the fjord or in Hall Basin (e.g. Figs. 7–9).
Ultimately, glacial sediment fluxes are calculated simply by dividing the total glacial sediment volume by the time that the ice margin was supplying sediment to the area, which is taken from existing deglacial chronologies. In order to compare to previous estimates of glacial sediment flux, this number is further divided by the ice stream width to return a sediment flux per ice stream width (see Alley et al., 1989). Grounding-line lengths, which are the same as the ice stream width, were measured along the fronts of the Petermann GZW from the multibeam bathymetric surface. Chronological information follows the deglacial reconstructions of England (1999) and Jakobsson et al. (2018); 1σ uncertainties in the ages for the Jakobsson et al. (2018) ice margin positions are used to provide an error bar on the calculated fluxes (see Sect. 4.5).
Glacial erosion rates were calculated by applying the methodology outlined in Fernandez et al. (2016) to our volumetric results to calculate the average basin- and time-averaged erosion rates () through
where VolRx is the volume of (dry) rock; Adr is the effective drainage basin area (in km2); and T is the time for sediment accumulation (in years), in effect the time since ice was near enough to supply sediment to the area concerned. Erosion rates are calculated for the erosion of lithified rock and, therefore, our wet sediment volumes had to be converted to dry rock volumes (VolRx). This was done using a wet density (ρsed) of 1850 kg m−3 for the sediments (based on measured density values from Petermann 2015 Expedition cores) and a density (ρsource) of 2700 kg m−3 for the source rocks (a commonly used density for parental rock types gneiss and limestones, following Andrews et al., 1994 and Fernandez et al., 2016).
4.1 Seismo-acoustic facies and depositional environments in Petermann Fjord and Nares Strait
We identify six seismo-acoustic facies in Petermann Fjord and the adjacent area of Nares Strait (Fig. 5) and correlate these with core lithologies where possible. Seismo-acoustic Facies I (bedrock), II (subglacial till) and VI (GZW units), as defined below, were not recovered by either piston or gravity cores, generally because they were too deep in the stratigraphy to be sampled or are not able to be sampled by these types of coring devices (i.e. bedrock). Therefore, only seismo-acoustic Facies III, IV and V were correlated with sediment lithofacies (Fig. 6). The seismo-acoustic facies are described as follows.
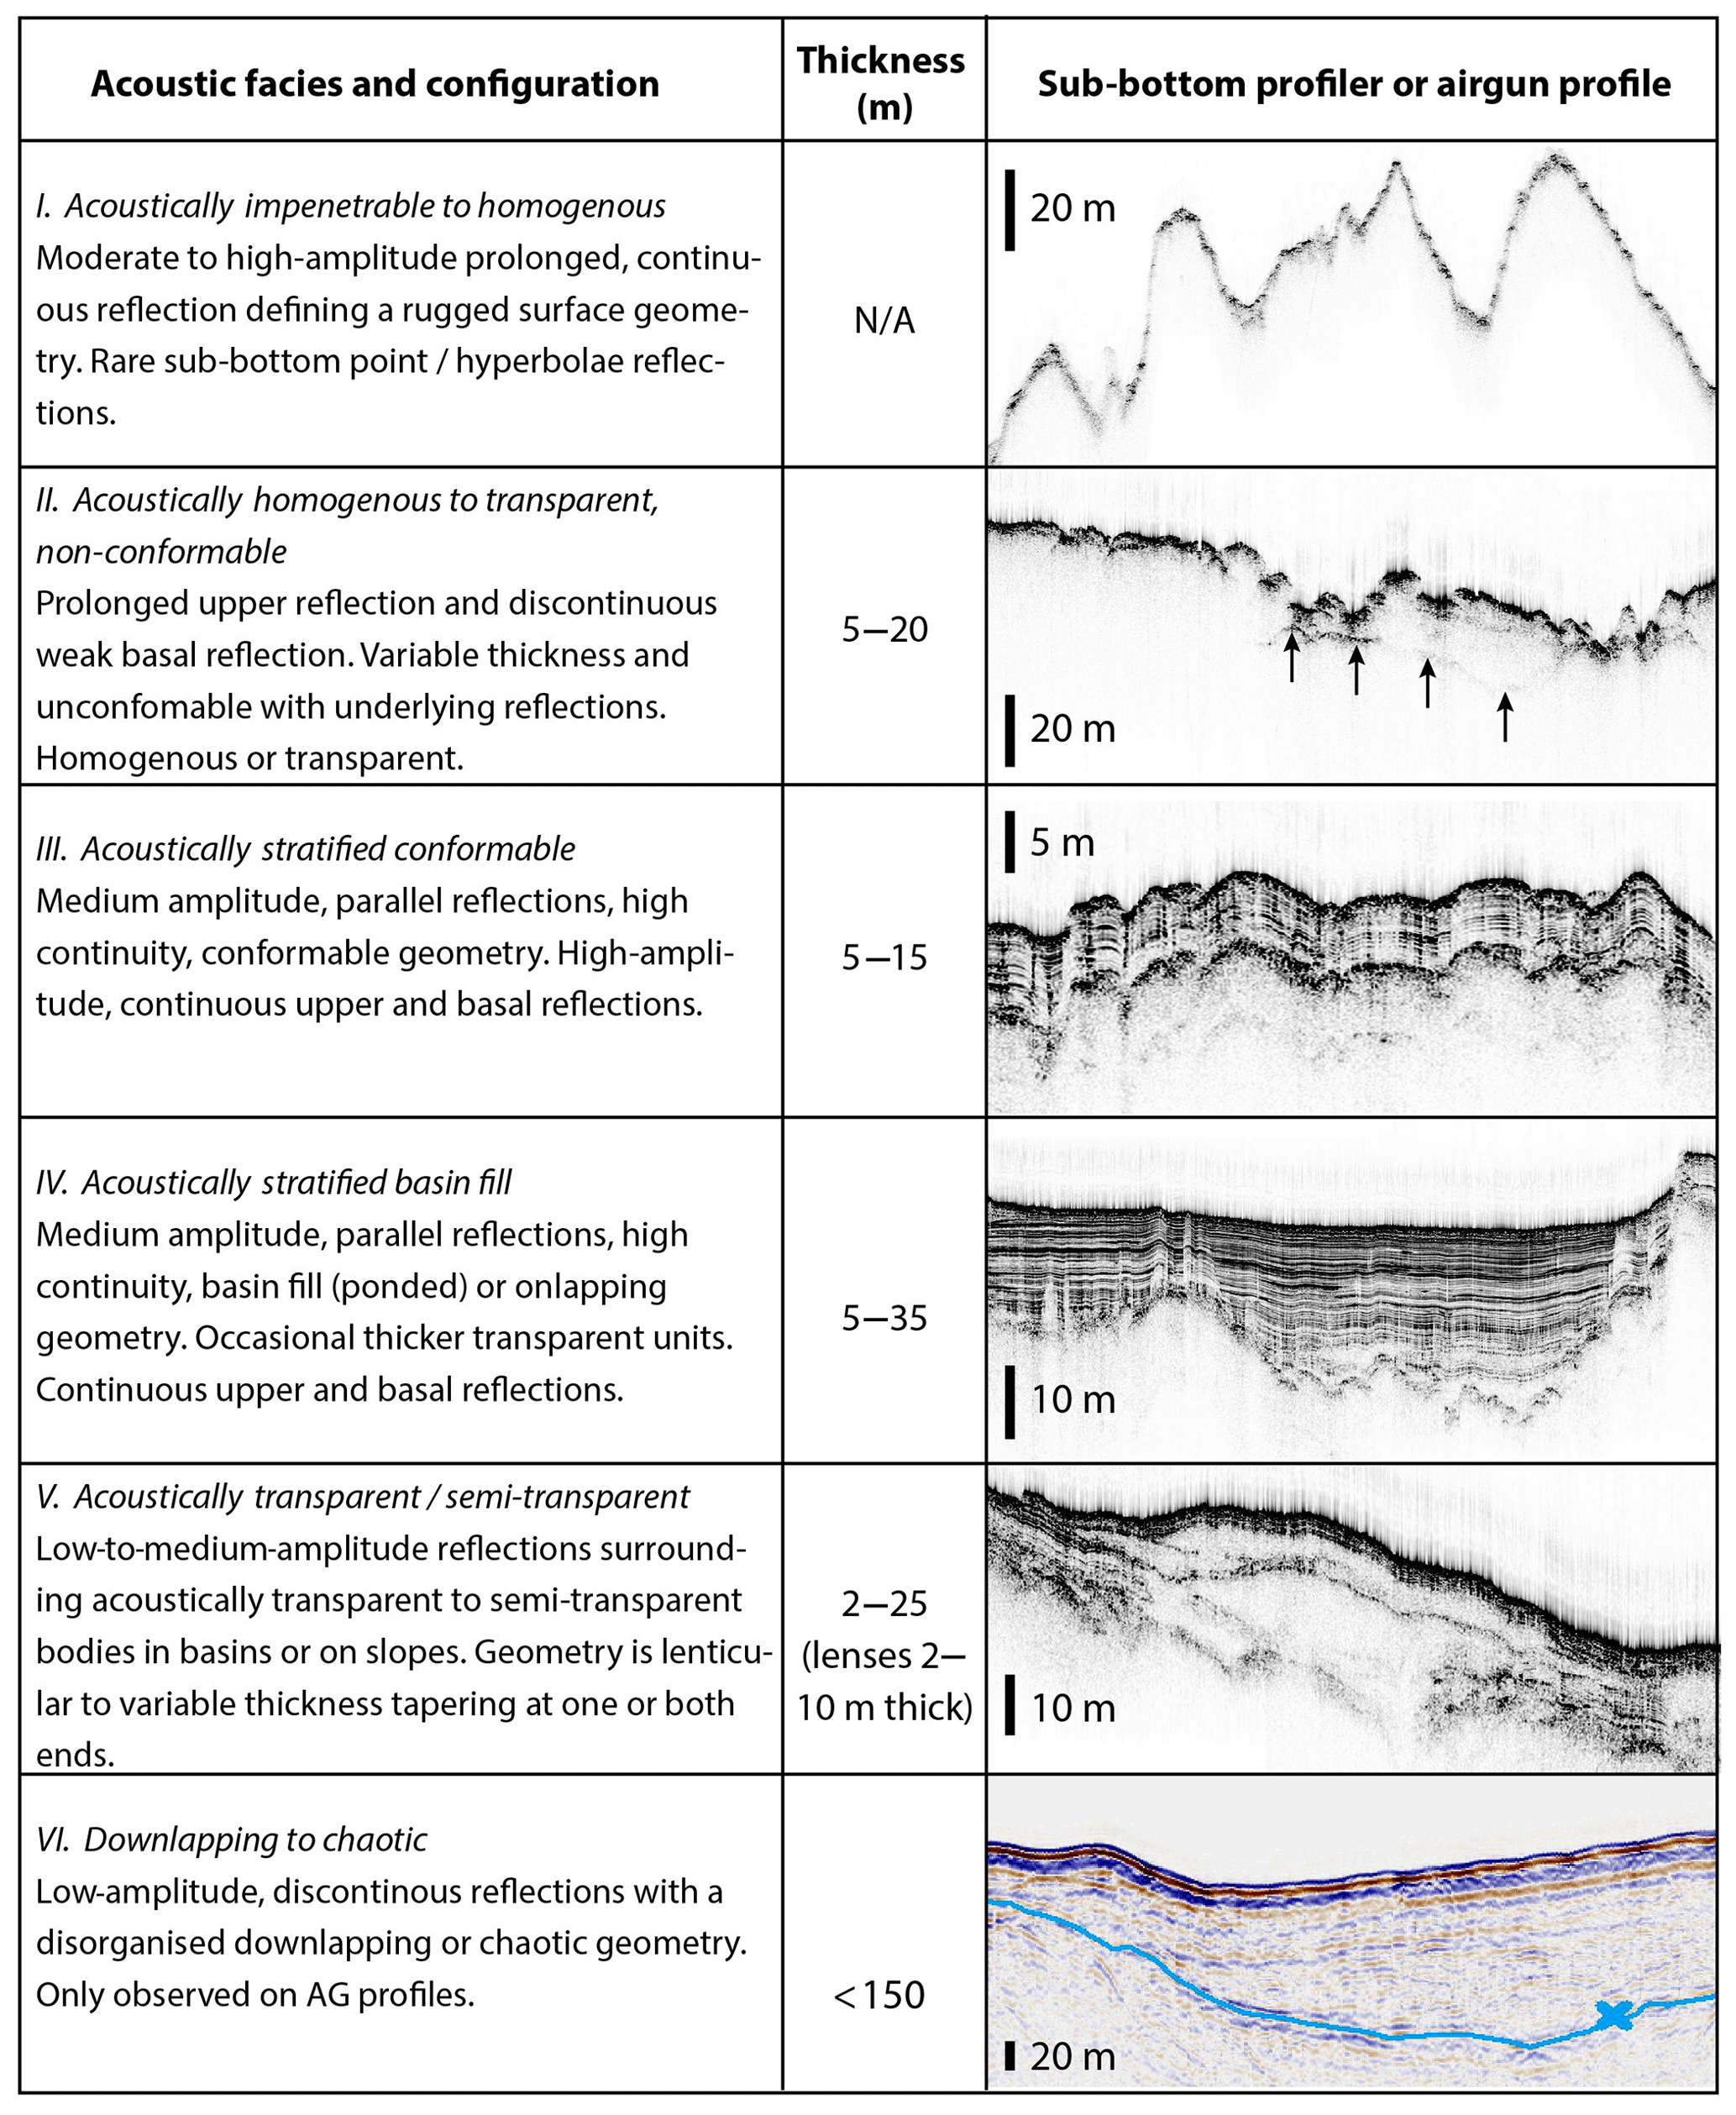
Figure 5Seismo-acoustic facies identified from SBP profiles and AG profiles in Petermann Fjord and Nares Strait. Seismo-acoustic Facies I–V mapped primarily on SBP profiles and checked with AG profiles; Facies VI mapped only from AG profiles.
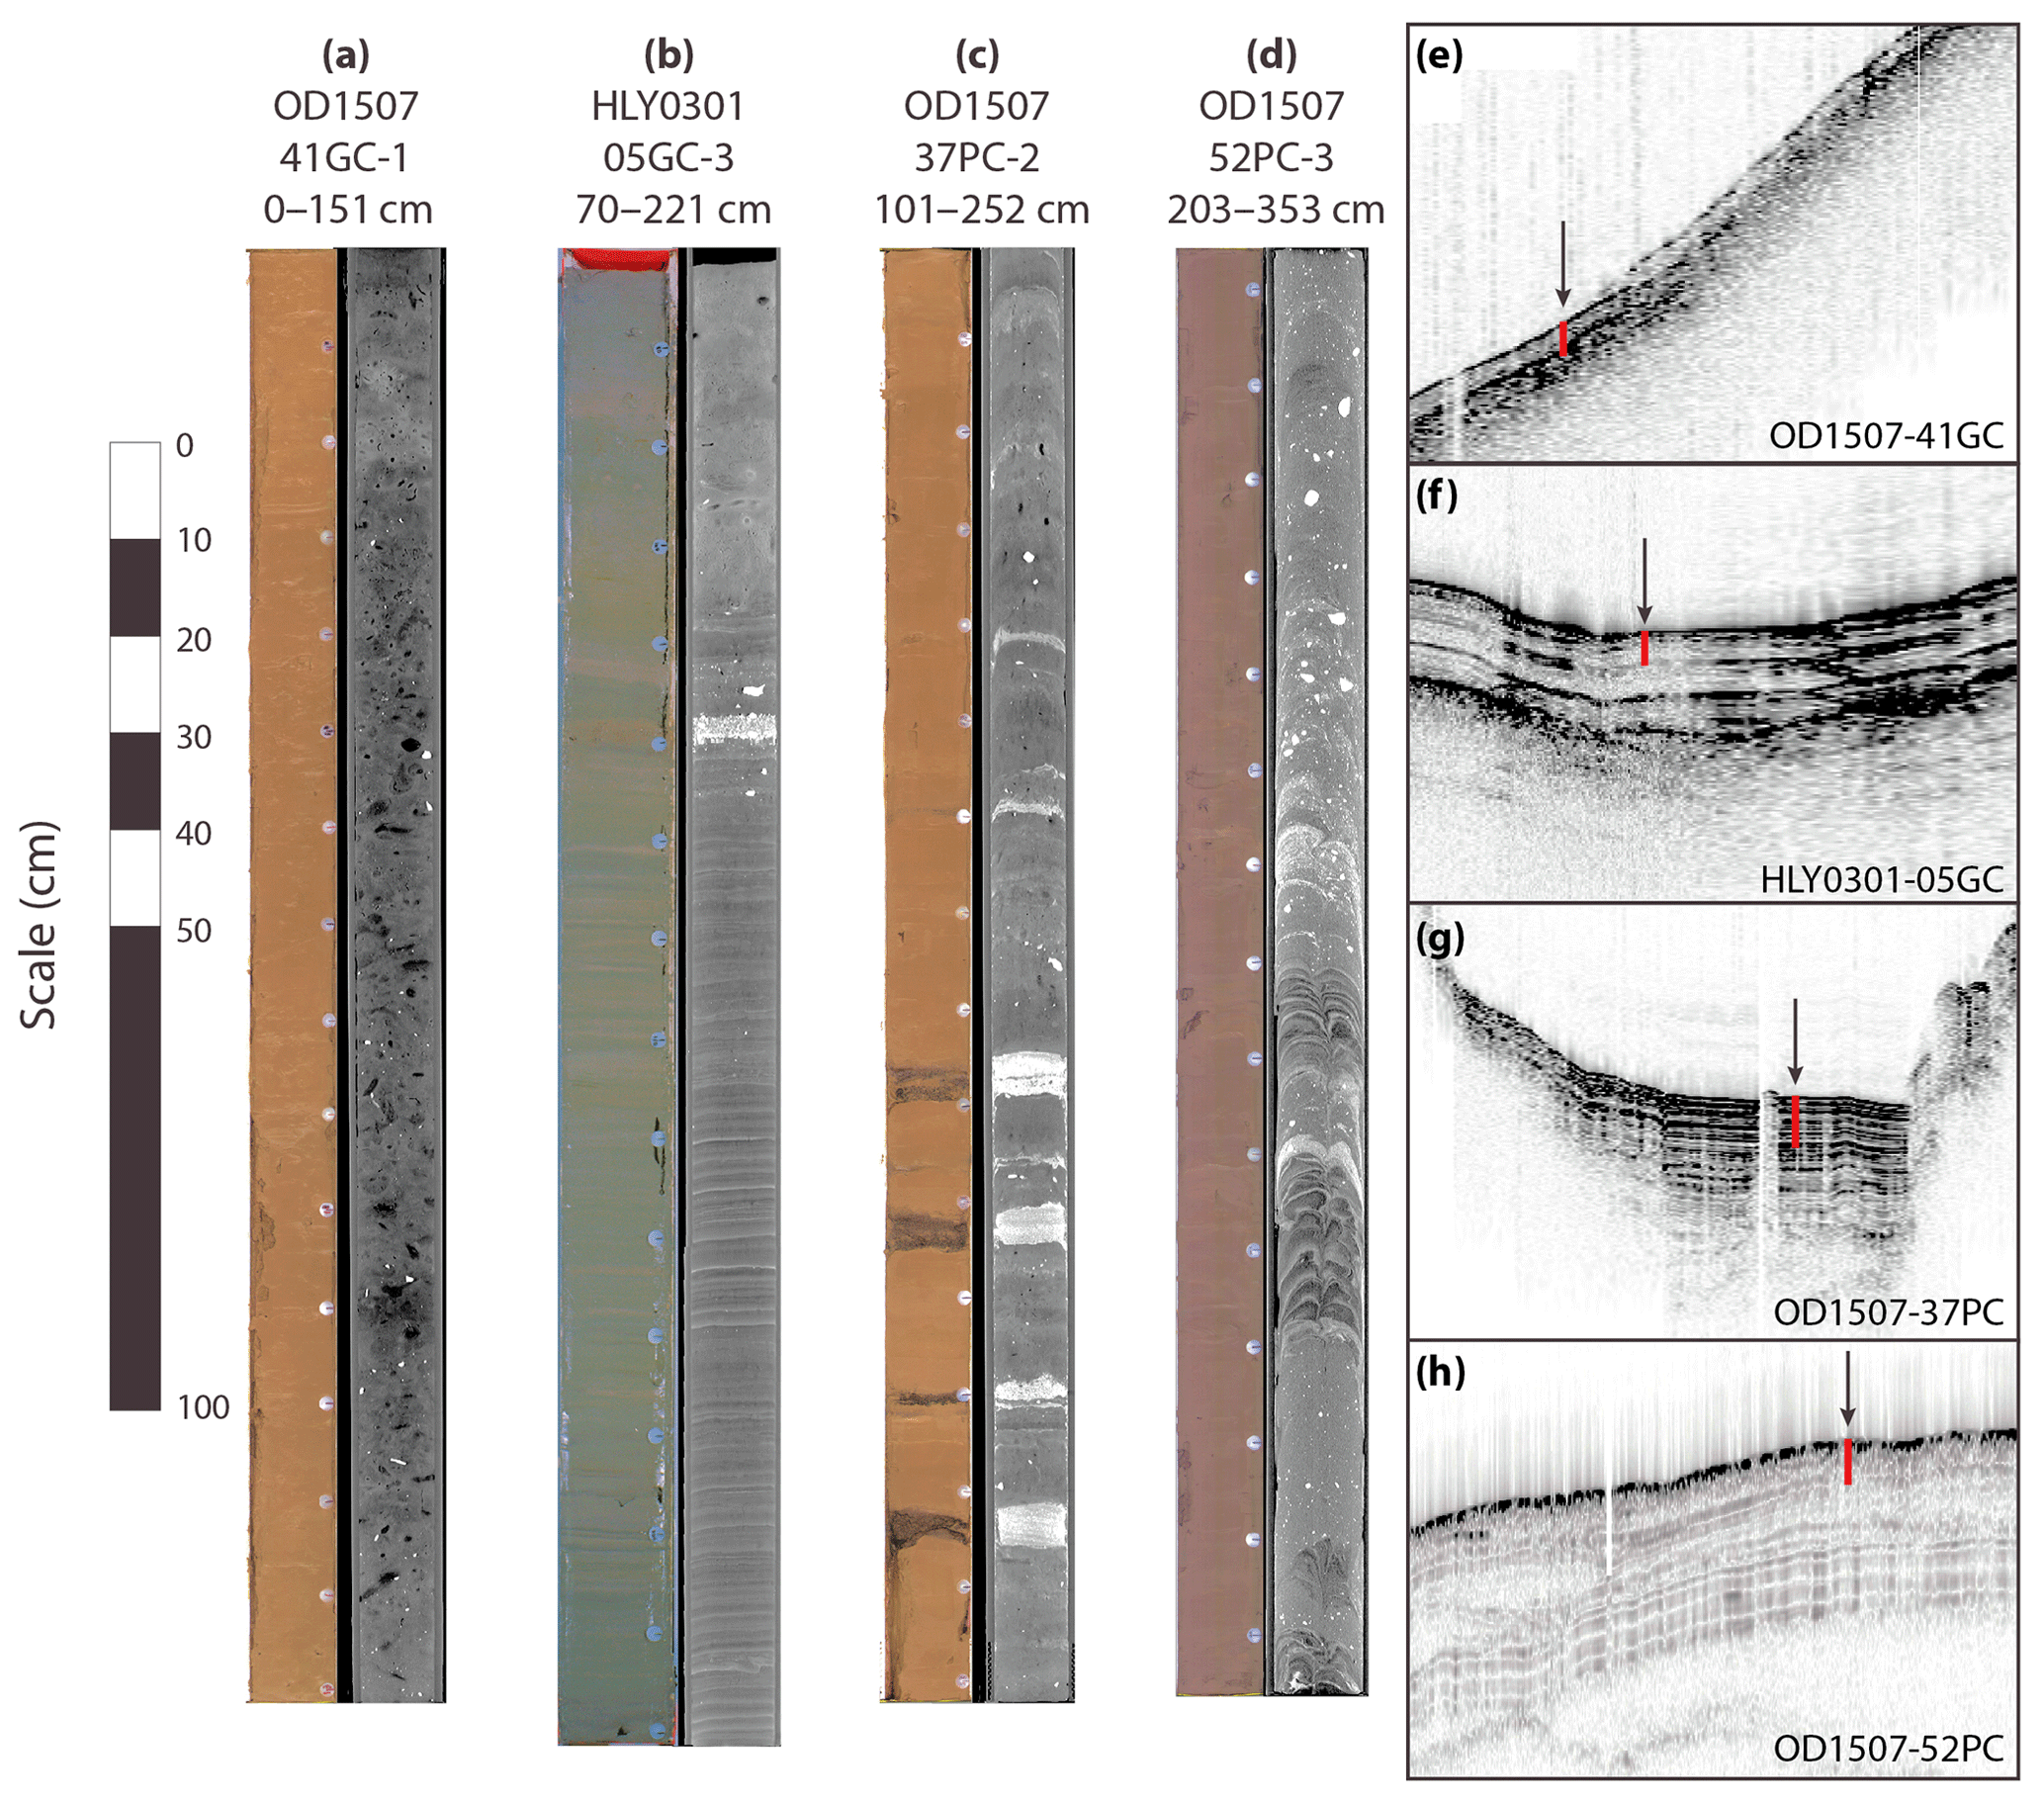
Figure 6Correlation of core lithofacies with seismo-acoustic Facies III (a, b, e, f), IV (c, g) and V (d, h). Core lithofacies are shown using CT scans (dark: lower density; light: higher density) and core photographs; seismo-acoustic facies at each core site are shown in panels (e)–(h). Note the coring artefact in core OD1507-52PC with layers bent down at the sides. The red bars in panels (e)–(h) represent the total core length for each core (using a velocity through sediment of 1500 m s−1); core locations are shown on Fig. 2.
- I.
Acoustically impenetrable to homogenous facies. This facies is represented by a high-amplitude, prolonged reflection defining a rugged surface with rare sub-bottom point and diffraction hyperbolae on slopes. It marks the base of the acoustic stratigraphy on SBP profiles, and we interpret it to be bedrock or a till surface. The SBP data alone do not allow us to differentiate between these two types, but by correlating with AG lines where the seismic basement is reached we can identify this facies as bedrock in Hall Basin. However, in areas where glacial lineations (which are formed subglacially in deforming till) are present, the upper reflection of this unit is interpreted to be a till surface (e.g. Fig. 7b).
- II.
Acoustically homogenous, non-conformable facies. This unit has a strong, prolonged upper reflection and a lower-amplitude basal reflection that can be discontinuous. It is acoustically homogenous and shows a varying thickness that is not conformable with the basal reflection or underlying units. In areas where this unit is correlated with MSGL it is interpreted as a subglacial till layer (see Ó Cofaigh et al., 2005); where this unit occurs on seafloor highs in Nares Strait it is interpreted as an iceberg-ploughed or current-reworked facies based on correlation with iceberg plough marks on the multibeam bathymetric data.
- III.
Acoustically stratified, conformable facies. This is characterized by parallel to sub-parallel, continuous, high- to medium-amplitude reflections with conformable geometries. It is typically 5–15 m thick. We interpret this facies as glacimarine and/or hemipelagic sediments primarily deposited via suspension settling (with variable IRD) in an ice-distal setting. Support for this interpretation comes from lithofacies correlation with the upper part of core OD1507-41GC from Petermann Fjord and core HLY03-05GC which samples the facies from Robeson Channel just beyond the S4 ridge (Fig. 2). The upper part of core OD1507-41GC recovered a brown, homogeneous clay with dispersed sand and clasts (Fig. 6a, e) consistent with distal glacimarine sediments deposited largely from suspension with dispersed IRD (see Elverhøi et al., 1989; Powell and Domack, 2002) and also described in cores from the fjord by Reilly et al. (2019). The sedimentology of HLY03-05GC was described by Jennings et al. (2011), who identified bioturbated muds from the core top to 112 cm, a transitional laminated pebbly mud unit from 112 to 125 cm, and a laminated mud unit from 125 cm to the base of the core (Fig. 6b, f). The laminated units were interpreted as distal glacimarine sediments with the transitional unit reflecting the breakup of ice in Nares Strait and Kennedy Channel (Jennings et al., 2011).
- IV.
Acoustically stratified basin or onlapping fill. This facies also comprises parallel to sub-parallel, continuous, high- to medium-amplitude reflections either in a ponded basin-fill geometry (reflections terminate at basin sides) or in an onlapping fill geometry (reflections curve up the flanks of basins). It can include acoustically transparent bodies, usually several metres thick that pinch out laterally. This facies is interpreted as a combination of suspension settling of glacimarine and hemipelagic sediments and gravity-flow deposits (GFDs) forming the acoustically transparent bodies (see Facies V) made up of material redeposited into basins from nearby slopes. Core OD1507-37PC penetrated Facies IV (Fig. 6g) in Petermann Fjord in a basin around 2 km from the ice-tongue margin as it was in 2015 (Fig. 2). It sampled grey-brown clay with dispersed clasts interrupted by multiple coarse, sand units (typically <10 cm thick) that are normally graded and have sharp basal contacts (Fig. 6c). The clay with clasts is interpreted as glacimarine sediments with IRD, and the individual sand units have properties consistent with gravity-flow deposits (i.e. erosive at their base and grading upwards; e.g. Bøe et al., 2004; Gilbert et al., 2002). Although such thin sand units may not be resolved in the acoustic SBP data over the core site, this lithofacies supports our interpretation of the seismo-acoustic facies as glacimarine units with interbedded GFDs.
- V.
Acoustically transparent facies. Multiple reflectors in Kennedy Channel comprise this facies in lens-shaped or tapered bodies on slopes. This facies is also present in local basins where it often pinches out towards the basin flanks, both in Petermann Fjord and Hall Basin. The lensoid and pinching-out geometries of these units, their erosion of underlying sediments and their acoustically transparent nature are characteristic of GFDs (see Laberg and Vorren, 2000; Hjelstuen et al., 2009). Core OD1507-52PC (Fig. 6d) was recovered from a stratigraphy that included discrete lenticular bodies (Fig. 6h), and it sampled laminated muds interbedded with diamictic units with sharp contacts consistent with sediment flow deposits consisting of glacigenic debris (see Laberg and Vorren, 2000). Note that the individual diamictic units in the core are not resolved in the SBP data as discrete reflections.
- VI.
Downlapping to chaotic facies. This facies is only seen on the AG profiles over the GZWs in the area. It consists of low-amplitude chaotic point reflections and rare discontinuous, sub-parallel reflections forming either a layered or downlapping pattern. The location of this facies at a known GZW location (Jakobsson et al., 2018) and its seismic character are consistent with its interpretation as subglacial till forming a GZW on a bathymetric high (e.g. Anderson, 1999; Dowdeswell and Fugelli, 2012). Deposition most likely occurred via subglacial plastering (aggradation) on the ice-proximal slope of the wedge and proglacially (i.e. seaward of the grounding line) via small gravity flows on the ice-distal slope (progradation). These processes probably occurred asynchronously with aggradation during advance of the grounding line over the sill and progradation only occurring when the grounding zone was on the sill. Thus, the GZW on the sill may be more of a combined morainal bank with GZW on its upper part, rather than a wedge-shaped GZW in its traditional form.
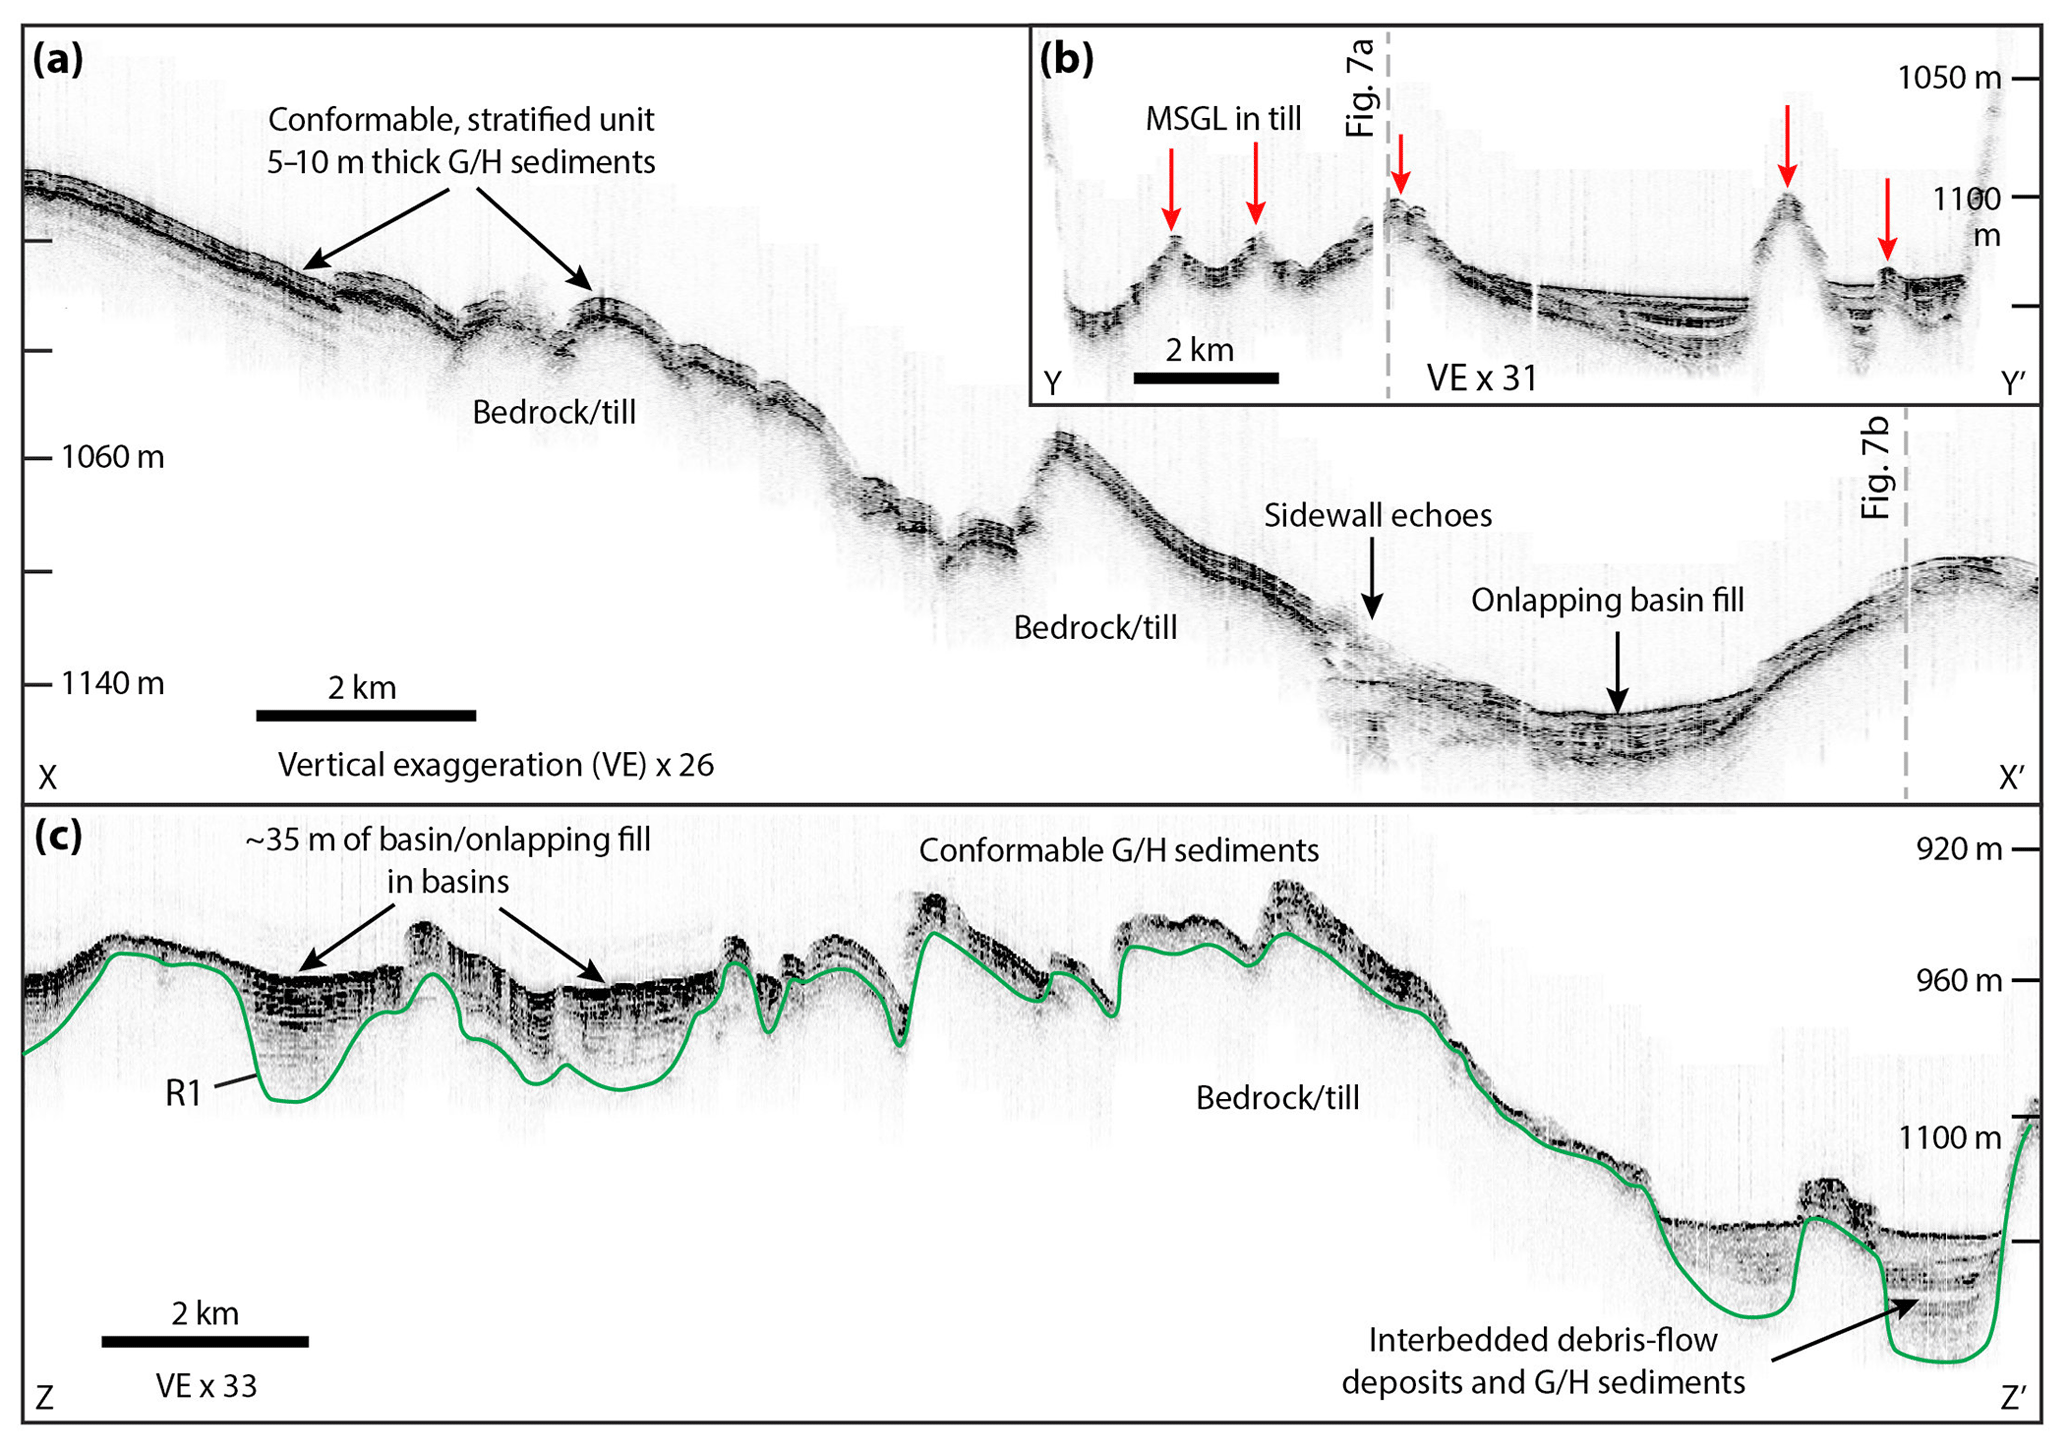
Figure 7Typical SBP profiles from Petermann Fjord (see Fig. 2 for locations) showing the acoustic stratigraphy of the glacimarine sediment package. (a) Fjord-parallel line showing conformable units (Facies III) overlying R1 reflection. (b) Outer fjord profile running approximately SW–NE showing conformable fill (Facies III) over subglacial till deposits (Facies II) mapped as MSGL (red arrows) and basin fill with GFDs (Facies IV) in local depressions. (c) Fjord-parallel line on the eastern side of the fjord showing basin fill in local depressions and conformable fill elsewhere. G/H is glacimarine and/or hemipelagic sediments.
4.2 Glacimarine sediment infill in Petermann Fjord and Nares Strait
The deepest part of Petermann Fjord, lying inside of (SE of) the mouth sill within the steep sidewalls (up to 70∘ slopes), is generally draped by a 5–15 m unit of Facies III (Figs. 5, 7). This unit conformably overlies the rugged surface of Facies I (Fig. 5). The seafloor morphology of the fjord bottom, which comprises relatively flat-lying parts separated by steep steps and has been strongly sculpted by ice (Jakobsson et al., 2018), suggests that the basal reflection here usually represents bedrock. In the few small areas where glacial lineations have been identified (e.g. around 61∘39′ W, 81∘03.5′ N), the basal reflection on SBP profiles represents a subglacial till surface (Fig. 7b). On the terraces on the western side of the fjord, bedrock is covered by about 5 m of draped Facies III overlying a thin unit of Facies II; these are interpreted as glacimarine and/or hemipelagic sediments overlying a plastered till unit.
On the eastern side of the fjord and in some places in the mid-fjord area, about 25 km from the 2015 ice tongue margin, local basins in the bedrock surface are filled with at least 35 m of stratified sediments (Fig. 7c). This basin fill is typically ponded in basins in the central part of the fjord and has an onlapping geometry with relatively more transparent subunits in basins on the eastern side of the fjord (Facies IV; Fig. 6g). We interpret these both as glacimarine and hemipelagic sediments with the onlapping fill including interbedded GFDs promoted by increased sediment input from two small glaciers entering the fjord there (Belgrade Glacier and unnamed glacier; Fig. 2). Some basins in the central fjord also contain sediment gravity-flow deposits (Fig. 5b) presumably representing material redeposited from local slopes. From the seafloor morphology, we note that there are two clear fan-shaped deposits in the fjord immediately seaward of the margins of Belgrade and unnamed glaciers, which are interpreted as ice-proximal fans (e.g. Fig. 12). Unfortunately, the SBP profiles do not penetrate the fan deposits and we do not have AG profiles in this area.
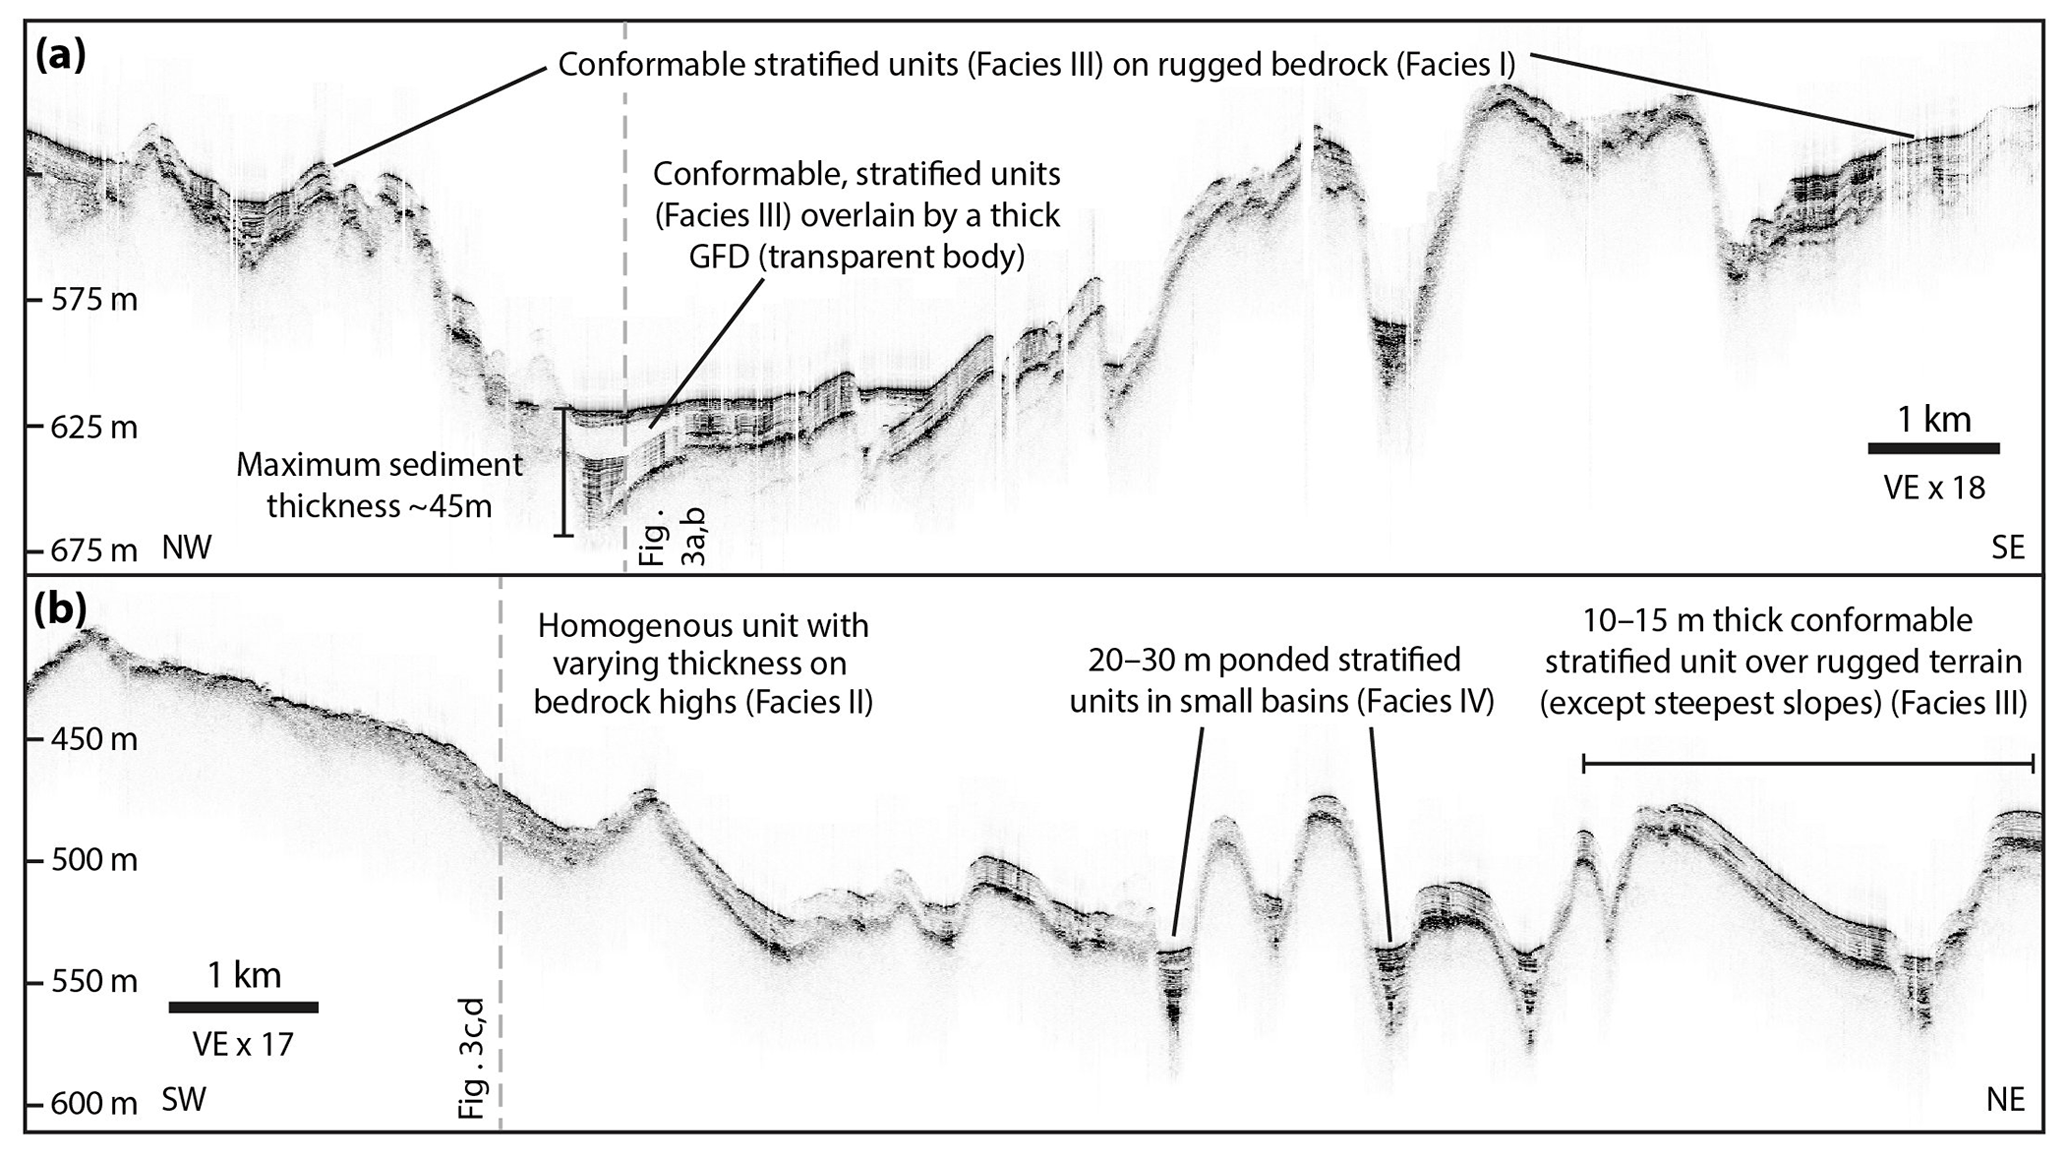
Figure 8Examples of SBP profiles from Hall Basin, Nares Strait (see Fig. 2 for locations). (a) NW–SE profile in Hall Basin showing bedrock topography (Facies I) mantled with conformable sediment (Facies III) and ponded basin fill, sometimes with significant GFDs in local depressions (Facies IV). (b) A SW–NE profile between the Petermann sill and S1 high showing a similar stratigraphy but including non-conformable, homogenous sediment on steep slopes (Facies II). Intersections with Fig. 3a–d are marked with vertical grey dashed lines.
In the Hall Basin area of Nares Strait, between the Petermann fjord-mouth sill and the S2 high (Fig. 2), the seafloor deepens to 500–620 m and includes several small basins (1 to >10 km2), sometimes interconnected and expressed as flat areas of seafloor interrupted by rugged seafloor highs. The highs comprise Facies I, are variously ice sculpted (Jakobsson et al., 2018) and are easily interpreted as bedrock. In the basins, the unlithified sediment package consists of stratified basin fill with GFDs (Facies IV) up to 45 m thick. Between basins, bedrock is mantled by 10–15 m of Facies III. Together these units are interpreted to be the product of rainout of glacimarine and hemipelagic material that forms conformable layers over bedrock where slopes are relatively gentle but is focused into basins by redeposition from nearby slopes (gradients up to 20∘). The largest flow deposits are apparent as thick (>10 m) acoustically transparent bodies (Fig. 8) and indicate that redeposition from the basin sides is an important process locally. They are correlated with the flattest basin floors with sharp, well-defined basin edges showing that sediment has run in to the basin and then been dammed by a bedrock high (Fig. 8a). On the most prominent bedrock highs (S2–S4; Fig. 2), unlithified sediments consist of Facies II and are usually <8 m thick (Fig. 8b). However, in deeper areas (>350 m water depth) the rugged bedrock surface is mantled with 7–15 m of Facies III (Fig. 8). We interpret this pattern to reflect a dominance of rainout processes that uniformly draped bedrock/till with up to 15 m of layered sediments unless (i) material was redeposited downslope and into basins or (ii) strong currents in Nares Strait (e.g. Mudie et al., 2006; Münchow et al., 2006) prevented the deposition of fine-grained material on the highest seafloor areas. Iceberg ploughing also probably helped to homogenize sediment layers deposited on the highs (see iceberg plough marks on S2 in Jakobsson et al., 2018).
In the >500 m deep and relatively flat Kennedy and Robeson channels (Figs. 1, 2), unconsolidated sediment comprises a two-layer conformable stratigraphy of Facies III. The upper unit is acoustically stratified and is typically 5–10 m thick. The lower unit, which is separated from the upper unit by a high-amplitude reflection (R1 in Fig. 3), is also 5–10 m thick and conformable but can be either acoustically homogenous or acoustically stratified (e.g. Facies III on Fig. 5). Where the bottom unit is homogenous on SBP profiles it has a stratified character on AG lines (see Fig. 3). We interpret this as reflection of the SBP acoustic signal at R1 and, therefore, poor penetration of acoustic energy in to the bottom unit. MSGL in Kennedy Channel are formed in Facies II and interpreted as a subglacial till. A similar interpretation is made for MSGL in Robeson Channel where the MSGL are also formed in Facies II but underlie 5–10 m of Facies III as described above.
4.3 Large subglacial landforms: grounding-zone wedges (GZWs)
There are two large discrete sedimentary deposits in the study area that must be accounted for here because they represent direct glacial sediment delivery to the grounding line and so should be included in any glacial flux and erosion calculations. These are the two GZWs in the study area, one on the Petermann fjord-mouth sill that was identified by Jakobsson et al. (2018) and one in Kennedy Channel around 64∘39′ W, 81∘09′ N identified in this work from the SBP data (Figs. 9, 10). Both of these features are well covered by SBP line, and the Petermann GZW is also crossed by four AG profiles.
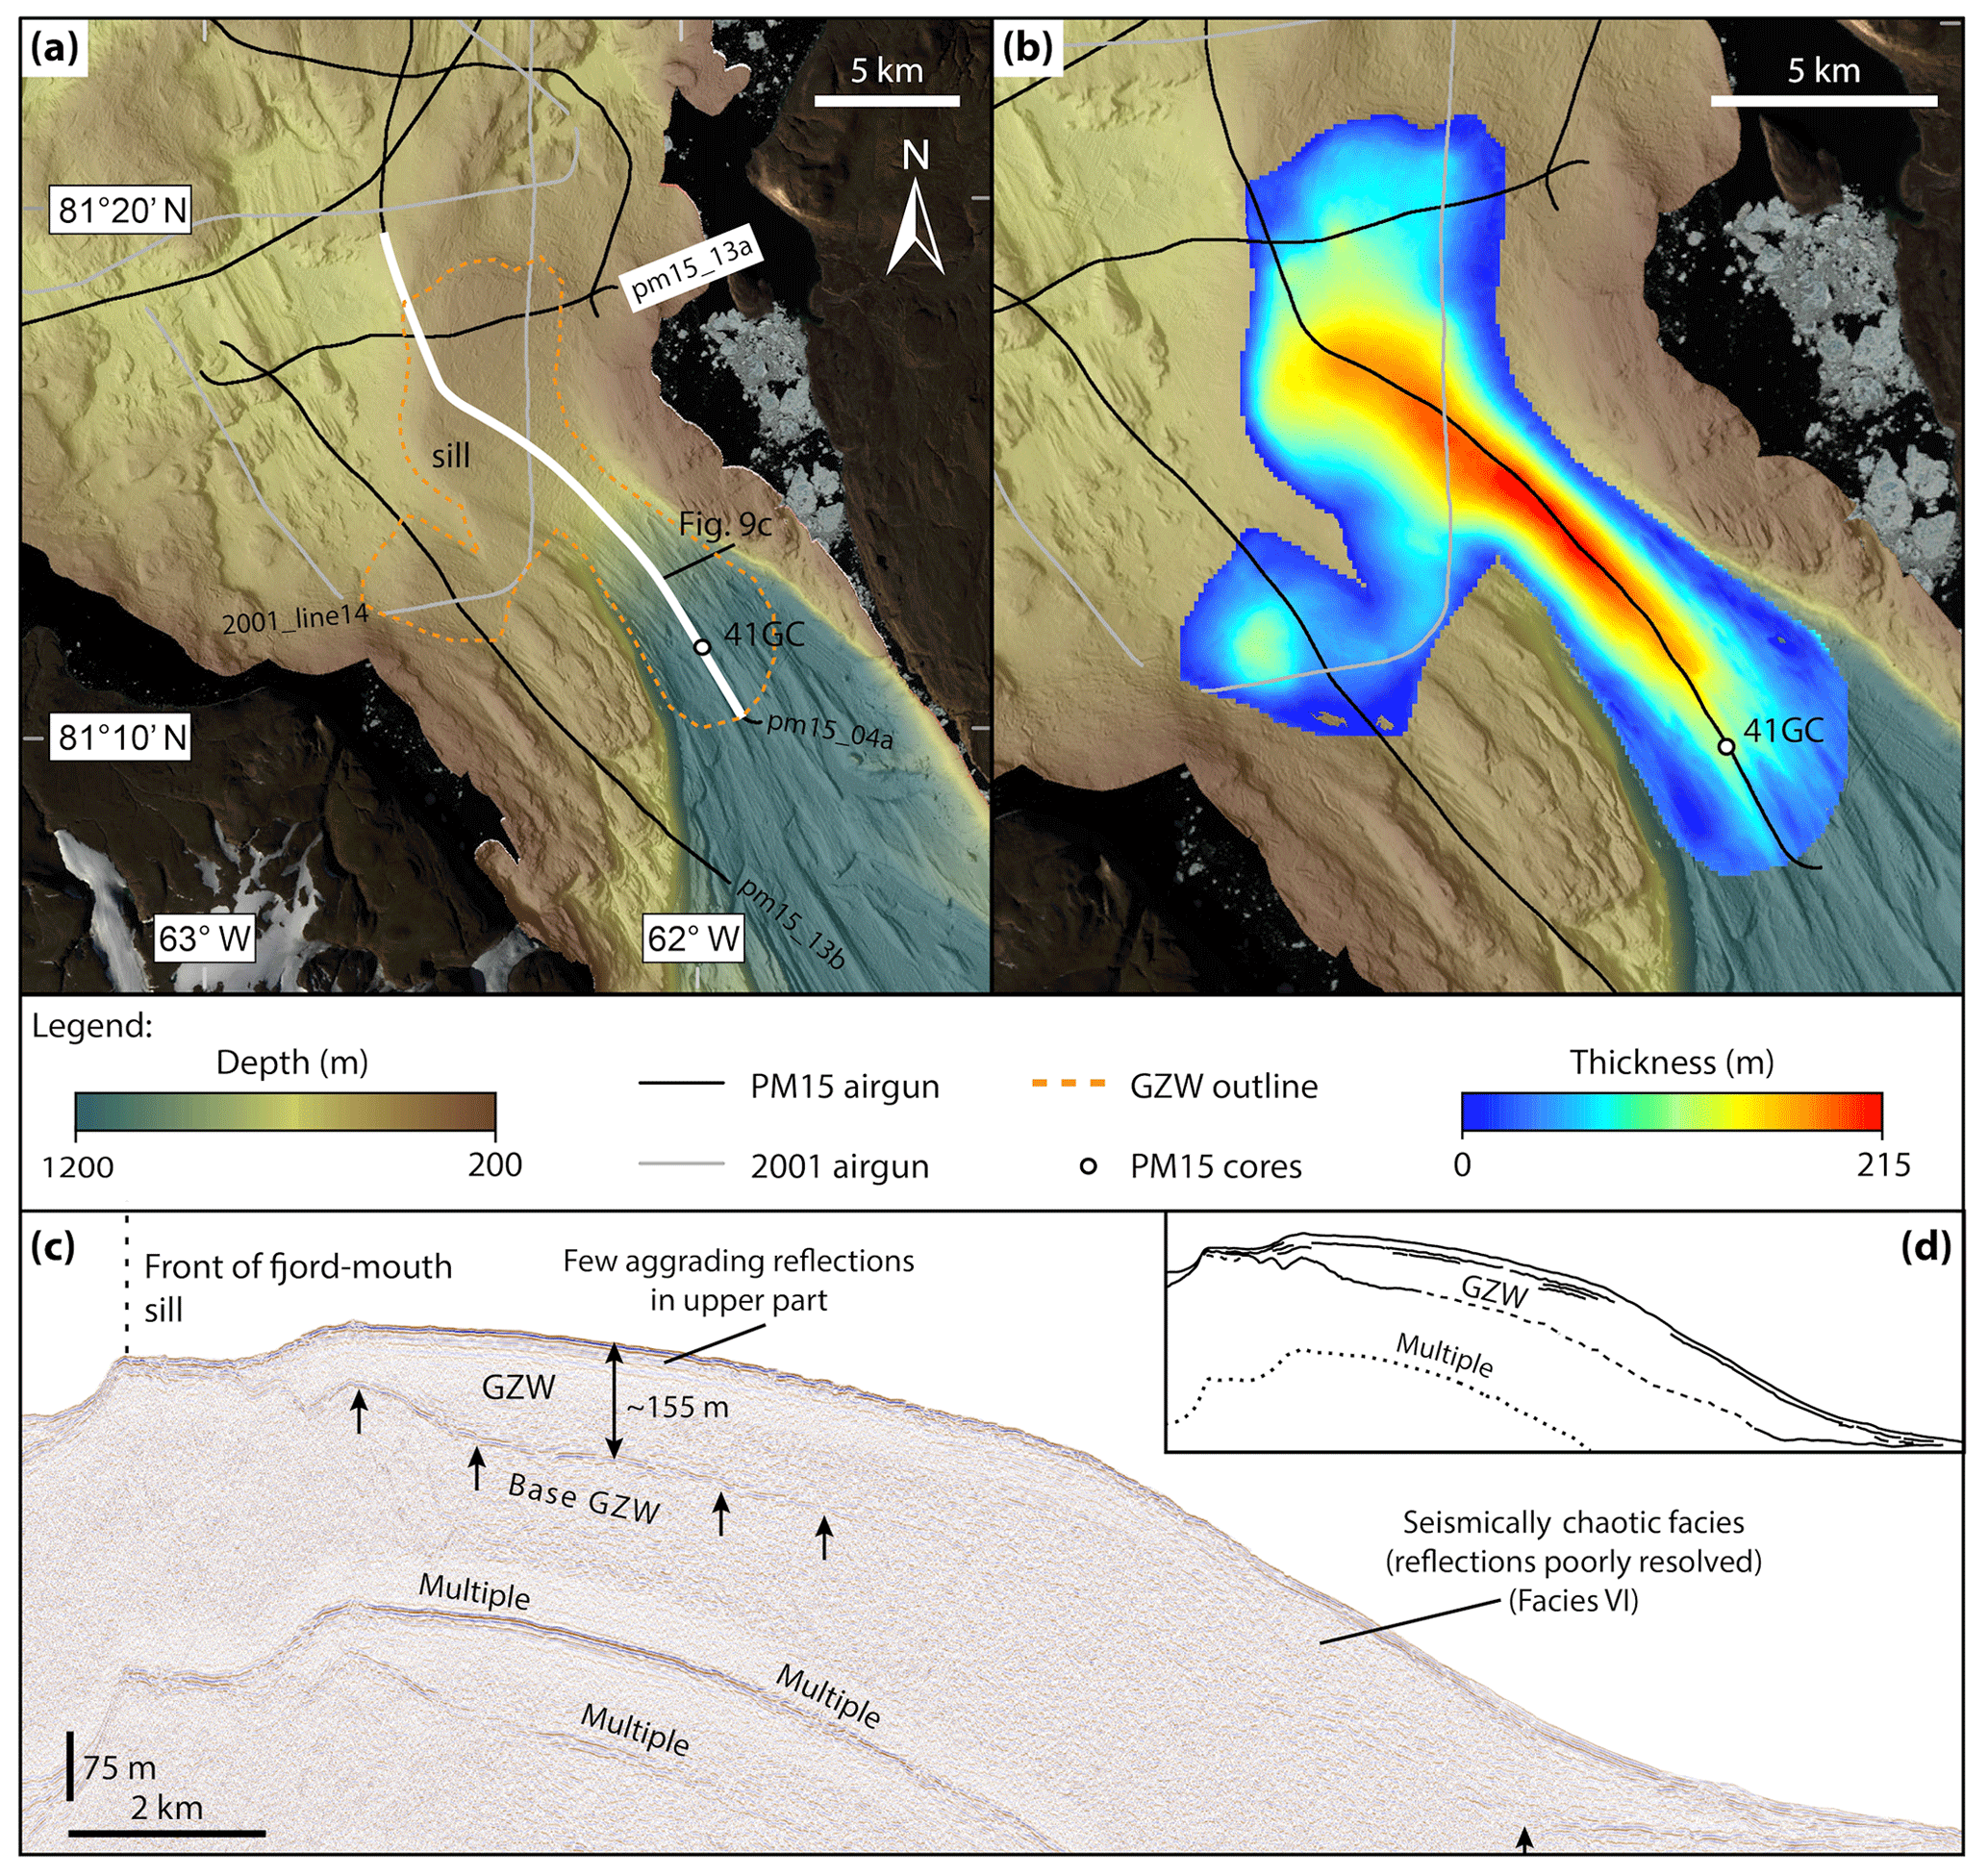
Figure 9Mapping of the Petermann sill grounding-zone wedge (GZW). (a) AG profiles over the GZW and outline used in volume calculations. (b) Isopach map of the GZW based on mapping from AG lines. (c) AG profile pm15_04a showing the seismic stratigraphy (Facies VI) of the GZW. (d) Line drawing of AG profile pm15_04a.
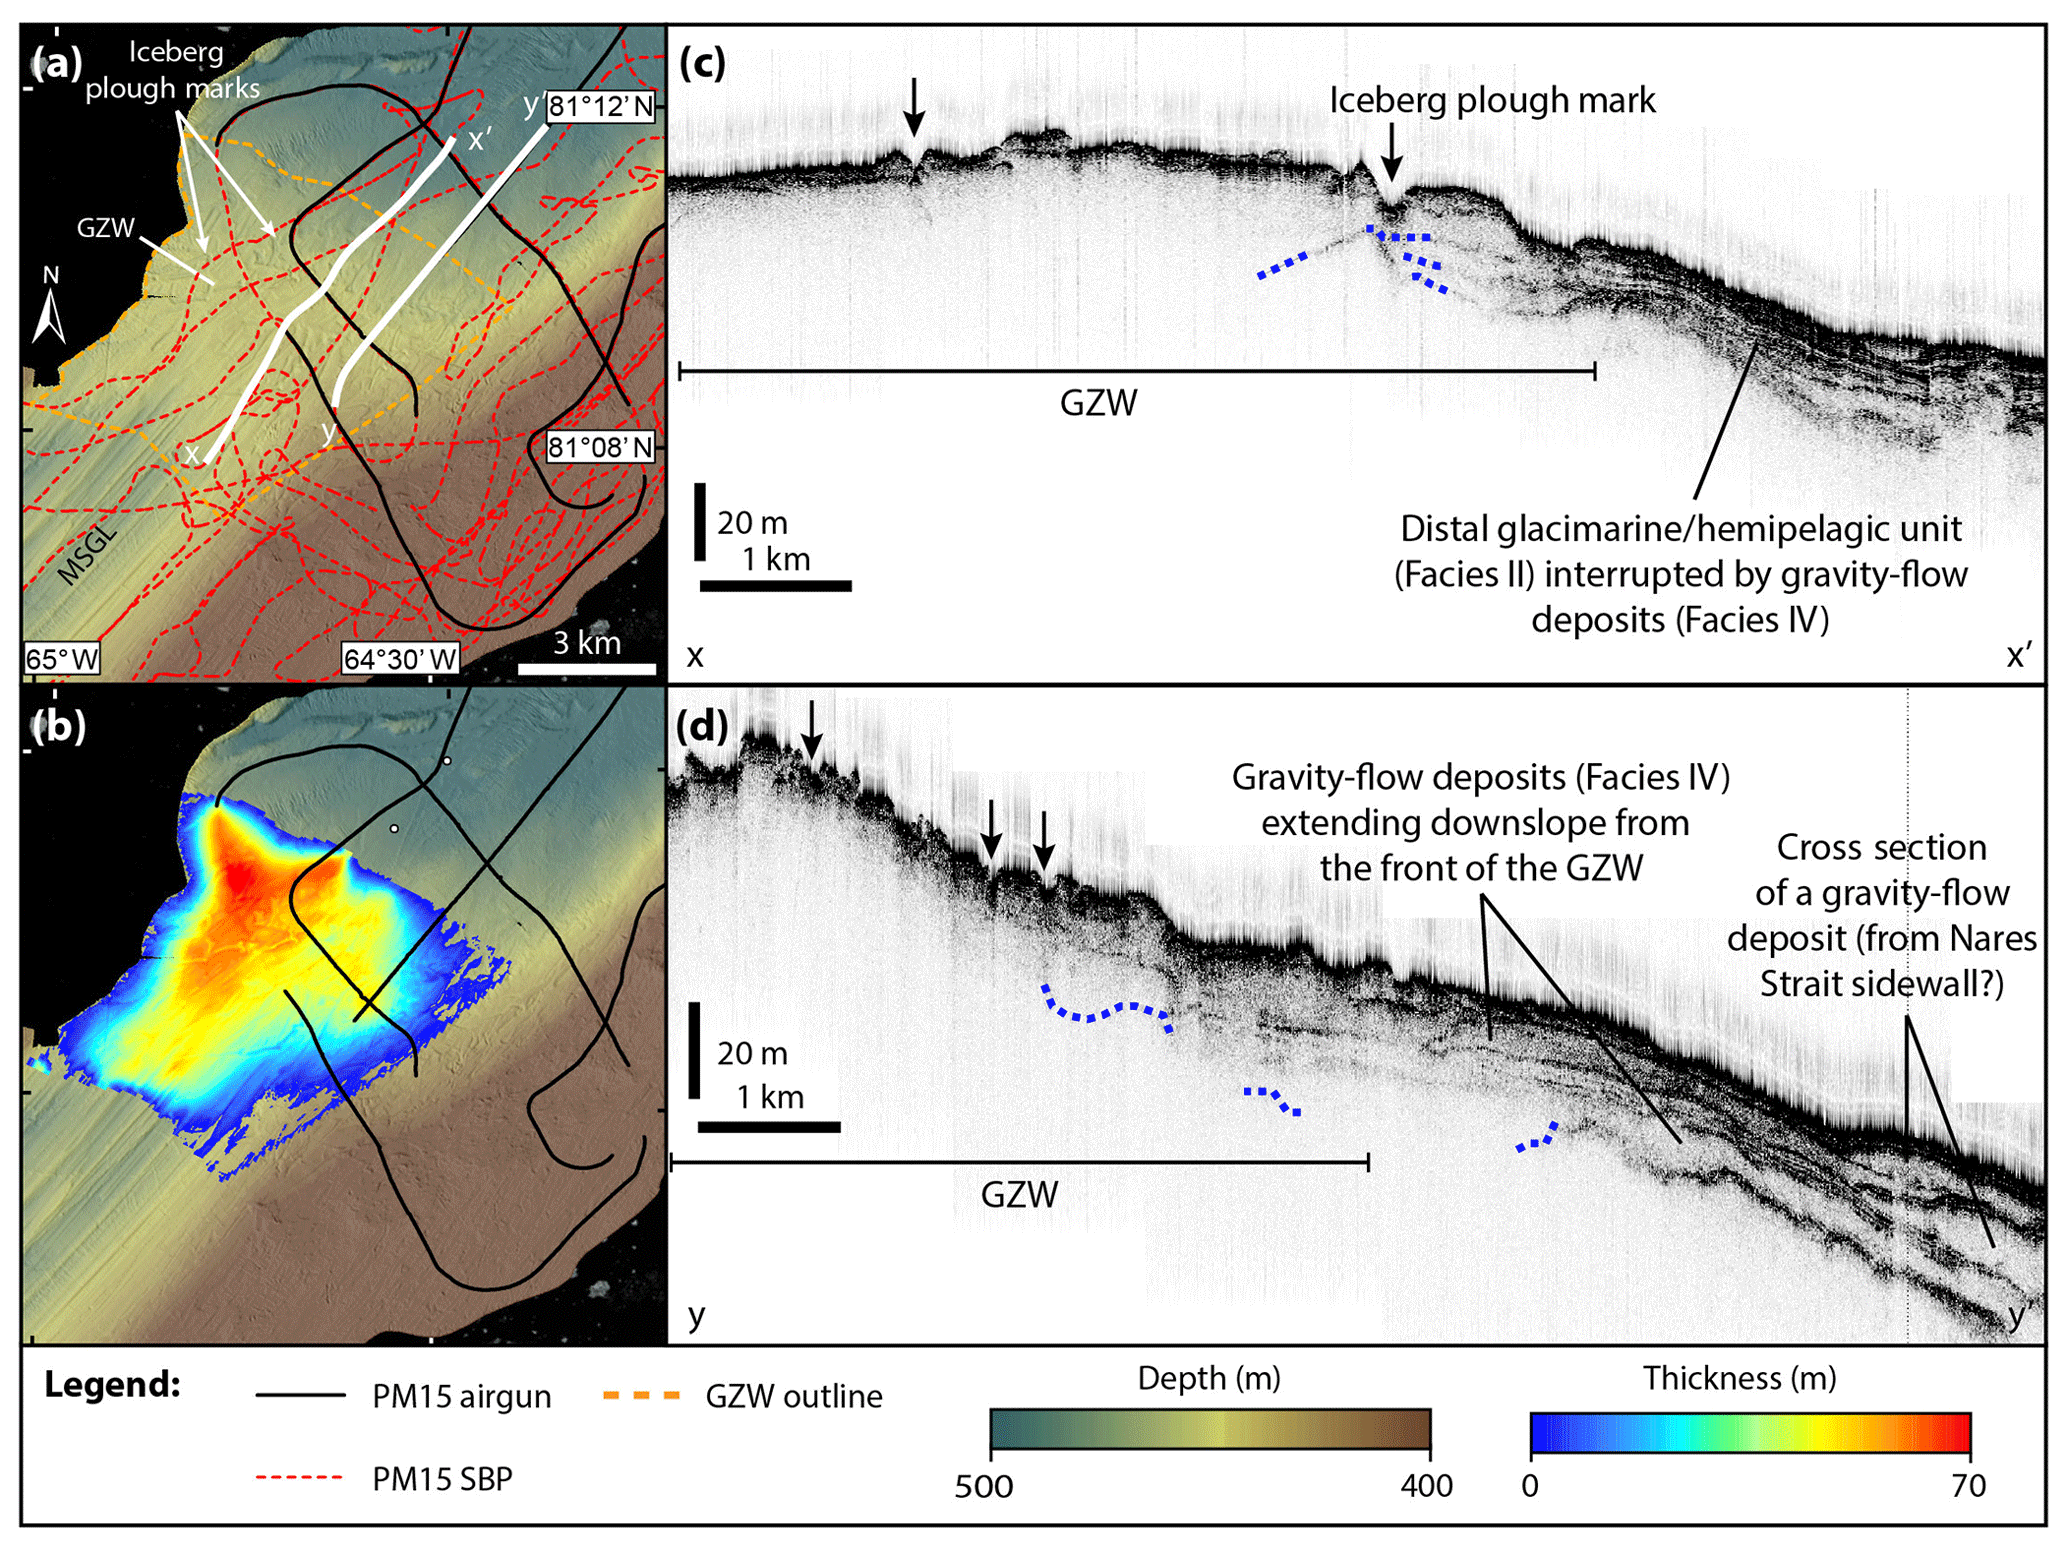
Figure 10Mapping of the Kennedy Channel GZW. (a) AG and SBP profiles over the GZW and outline used for volume calculations. (b) Isopach map for the Kennedy Channel GZW (using a sound velocity of 1500 m s−1). (c) SBP profile over the GZW showing the acoustically semi-transparent lenticular bodies (Facies IV) interfingered with acoustically stratified conformable units downslope (Facies III); location shown in panel (a). (d) SBP profile of the frontal part of the GZW showing semi-transparent units tapering downslope (Facies IV); location shown in panel (a). Black arrows point to iceberg plough marks; blue dashed lines show the deepest sub-bottom reflections in the GZW interpreted as the base of the GZW.
SBP profiles across the Petermann GZW show very limited penetration through this deposit. It has a high-amplitude reflection at its top and is otherwise acoustically impenetrable (Facies I). Only small mounds of acoustically homogenous material occur above this reflection; these were interpreted as recessional moraines based on their coincidence with small, sinuous ridges in the multibeam dataset (Supplement Fig. 3 in Jakobsson et al., 2018). AG profiles over the GZW provide some more information about its internal character (Fig. 9c). The GZW appears to contain several conformable reflections in its upper 50 ms (∼37–45 m) that down-lap at the base of the slope (Figs. 5, 9c, d); however, the reflections have low amplitudes and are discontinuous. Below these reflections the seismic character is poorly defined and chaotic (Facies VI), presumably because the deposit consists of a similar lithology throughout and, therefore, contains few acoustic impedance contrasts. However, the base of the deposit can be mapped along about 50 % of its length (e.g. Fig. 9c, d) and defines a surprisingly thick deposit (200 ms TWT; ∼150–180 m) that is continuous down the back slope of the fjord-mouth sill. We interpret this seismo-acoustic facies to be a diamictic deposit probably consisting of subglacial till plastered on to the sill by a formerly expanded Petermann Glacier. Coarse grains in the till deposit result in strong scattering of acoustic energy, making this deposit effectively impenetrable with the SBP source. It is notable that the GZW does not appear to contain the prograding reflections described from some GZWs (e.g. Larter and Vanneste, 1995; Anderson, 1999; Dowdeswell and Fugelli, 2012); we attribute this to its position on the back slope and upper ridge of the fjord-mouth sill. In this setting, it is difficult to see how a wedge would be built up by progradation up a slope (i.e. on the back slope of the sill). The deposit has instead been built by plastering of layers of material on the back slope and possibly through progradation on the top of the sill.
The Kennedy Channel GZW has a different geometry, position and architecture (Fig. 10). The GZW rises 10–15 m from the surrounding seafloor and is at least 5 km wide (along Kennedy Channel) and 7 km long (across Kennedy Channel). Although the multibeam echosounder coverage extends only to the midline of the strait, we note that the bathymetry shallows towards Ellesmere Island in this area (based on our multibeam dataset and IBCAO regional bathymetry; Jakobsson et al., 2012), meaning that the GZW persists across the deepest part of the strait. It has a convex-up expression in the bathymetry that is clearly marked by iceberg plough marks (Fig. 10a) and is situated in current water depths of ∼450 m just south of a marked slope to deeper waters (∼530 m) to the north (Fig. 10a). SBP profiles reveal that the deposit comprises 1–3 acoustically transparent units with variable thicknesses demarked by weak sub-bottom reflections (Facies V; Fig. 10c, d). AG lines in this area, which do not extend across the mapped GZW and do not fully image the deposit (Fig. 10a), reveal a chaotic seismic character (Facies VI) sometimes forming lenticular bodies. However, the deposit thins and eventually pinches out to the north (Fig. 10c, d). We interpret this acoustic signature as layers of till delivered to the grounding line and then deposited just seaward of it (probably by gravity flows) at the temporarily stabilized grounding zone of the Nares Strait ice stream. The ice margin stabilized at a bathymetric shallowing and narrowing of the deepest channel in this area. Subglacial till extruded from the grounding line as GFDs formed the acoustically homogenous units (Facies V) extending and tapering downslope in front of the GZW (Fig. 10d). Where such flow deposits are prolific and occur at the seafloor, they are easily identified as smooth, lobate features in front of known grounding-zone positions marked by terminal moraines (e.g. Ottesen and Dowdeswell, 2006; Flink et al., 2015) or GZWs (e.g. Bjarnardóttir et al., 2013; Esteves et al., 2017). Here, they may reflect local shifts in the location of the grounding zone during a phase of ice shelf instability interpreted from core records (Jennings et al., 2018) prior to further grounding-zone retreat.
4.4 Unlithified sediment volumes
Total sediment thicknesses (to acoustic basement) were mapped from SBP profiles in two areas: Petermann Fjord and the inner Hall Basin (Fig. 11). The isopach map for Petermann Fjord indicates that sediment thicknesses, typically 20–40 m, are relatively consistent on the fjord bottom with a few depressions holding 70 m of sediment (Fig. 11a). The total mapped sediment volume in the fjord was 14.2 km3. In Hall Basin, mapping was confined to the area in front of the Petermann sill and south of ridges S1–S3. This was primarily because the sill is a known grounding-zone location during ice retreat (Jakobsson et al., 2018) and because that area contains the majority of the sediment-filled basins in front of the sill and up to the topographic barrier at S2–S4. Secondary to this, the area beyond the S1–S3 ridges has a heavily fractured morphology with many small, isolated basins and trenches; these features complicate calculations of sediment thickness when survey lines have irregular spacing that is often greater than the distance between individual basins. However, mapping and the resultant isopach map for this area indicates sediment thicknesses are typically less than 30 m but up to 50 m in basins, which become more irregular in shape further northwards (Fig. 11b). The strong correlation of sediment thickness with seafloor morphology confirms that topography is a strong control on accumulation in this area. The total mapped sediment volume between the fjord mouth and the S1–S3 ridges is 16.3 km3 (using a sound velocity of 1500 m s−1).
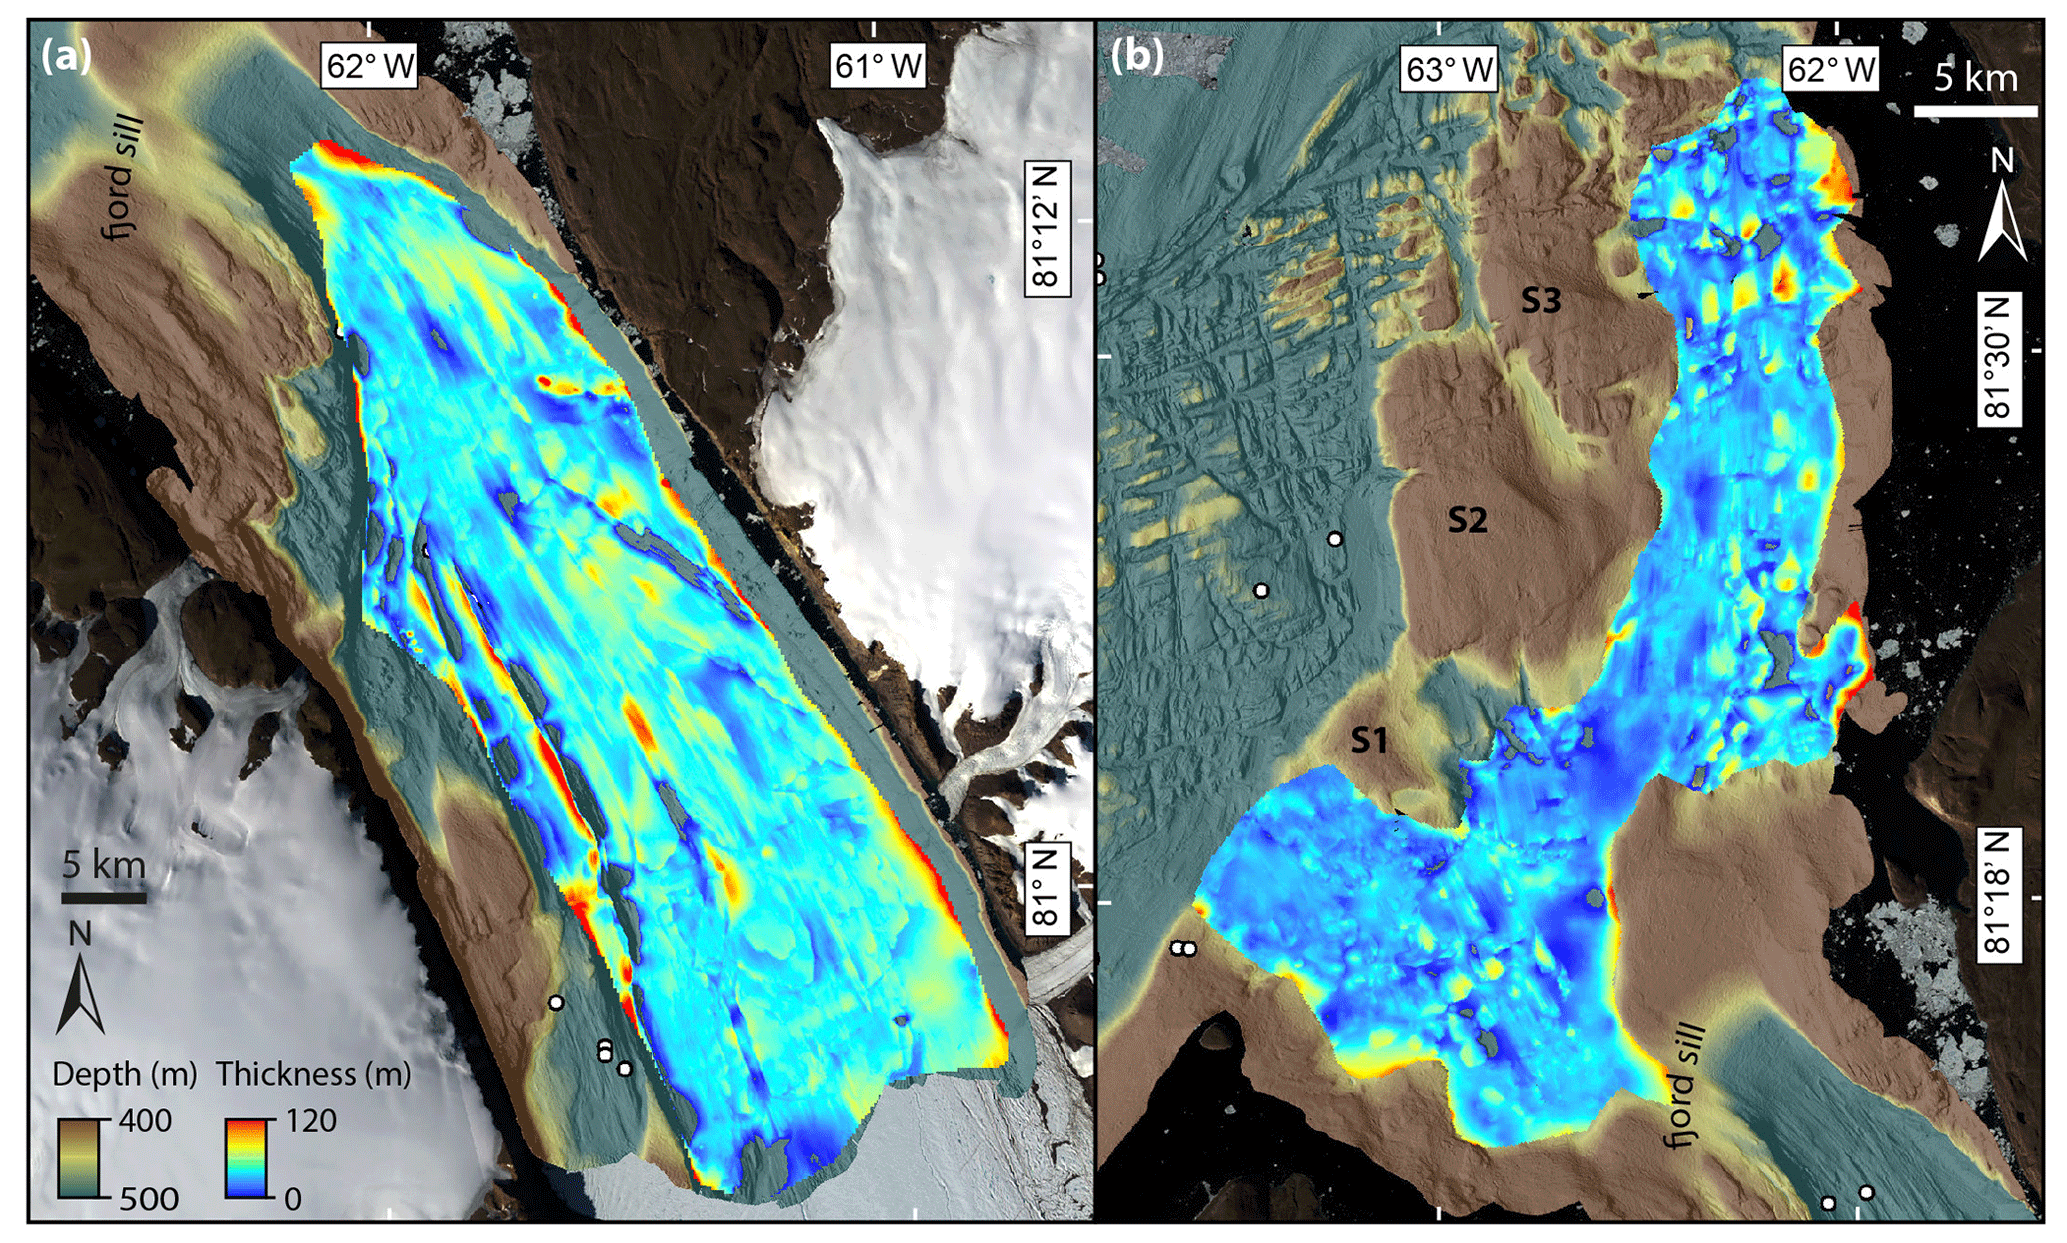
Figure 11Isopach maps of the deglacial sediment pile for (a) Petermann Fjord and (b) the inner Hall Basin.
The isopach map for the Petermann GZW shows a maximum sediment thickness of 215–260 m on the upper part of the back slope of the fjord-mouth sill (Fig. 9b). The thickest part of the deposit appears to be confined to a central fjord-parallel line, which is likely a function of gridding from a single line in the central part of the fjord (line 04a; Fig. 9a) and probably leads to an underestimation in sediment thicknesses for the GZW. However, a second line across the southern part of the sill (line 13b) confirms that the GZW does not extend off the top part of the sill in this area (Fig. 9b). Sediment thicknesses on the top of the sill are generally between 30 and 120 m and reach 160–190 m in its northern part. The shape of the GZW is defined by a zero-thickness contour as mapped on AG profiles joined by tracing along the front scarp of the wedge and extending down the deepest channel into Petermann Fjord. A volume calculation for the isopach map representing the GZW at the mouth of the Petermann Fjord gives a total volume of 7.7–15.1 km3 (using sound speeds of 1500 and 1800 m s−1). In Kennedy Channel, AG profiles do not fully cover the GZW (Fig. 10a); however, its volume has been estimated based on AG profiles and from SBP profiles that image the base of the deposit near its edges. The deposit here is more classically wedge-shaped (see Alley et al., 1989; Dowdeswell and Fugelli, 2012) compared to the deposits of the GZW at the Petermann Fjord mouth. The Kennedy Channel wedge has the greatest thickness toward the centre of the channel in the frontal part of the wedge (65–78 m; Fig. 10b). The total sediment volume for the mapped part of the wedge is 1.1–2.2 km3; however, our data cover only about half the width of the channel and we recognize that the deposit could be larger.
4.5 Glacial fluxes and erosion rates
Using our mapped volumes we can calculate glacial sediment fluxes and erosion rates for the palaeo-Petermann ice stream during its retreat from the fjord mouth. By adding the Petermann GZW volume (7.7–15.1 km3) to the volume of unlithified sediments in the inner Hall Basin (16.3 km3), we obtain a total glacial sediment volume of 24–31.4 km3 that was delivered by the Petermann ice stream during deglaciation, when it was located at the fjord mouth. It is not yet known whether the GZW was produced over multiple glacial cycles so we assume, for the purposes of these calculations, that the entire GZW was deposited during the last glacial period. The result is a total sediment volume of 23.8–31.2 km3 (when adjusted to remove the upper 0.5 m of non-glacial sediment). If this volume was deposited over the ∼1100 years when the ice margin was stable at the fjord mouth (England, 1999; Jakobsson et al., 2018), it indicates a glacial sediment flux for the Petermann ice stream of 1080–1420 m3 a−1 m−1. Using the 1σ uncertainties in ages for the Jakobsson et al. (2018) ice margin positions (maximum time at the fjord mouth is 1340 years; minimum time at the fjord mouth is 720 years), we can give the associated uncertainty in these fluxes as 890–2170 m3 a−1 m−1. However, we acknowledge the remaining uncertainties with these estimates due to the possibility that some material from the GZW was produced by a previous glacial event and also that some sediment may bypass the system (Petermann Fjord and Hall Basin) in icebergs that melt out elsewhere; it is not possible to quantify these volumes based on currently available data.
To calculate an average deglacial erosion rate for the palaeo-Petermann ice stream, we must add the volumes of Hall Basin and GZW sediment (23.8–31.2 km3) to the unconsolidated sediment fill in the fjord (14.2 km3). Converting this total volume (38.0–45.4 km3) to its rock-equivalent volume returns a dry volume of 26.0–31.1 km3. Using an effective drainage basin area (Adr) of 10 493 km2 for the Petermann ice stream (see Supplement and Fig. S1 in the Supplement for drainage basin definitions) and a sediment accumulation time (effectively the time since grounded ice had retreated from the fjord-mouth sill) of 8700 years (after Jakobsson et al., 2018), the average deglacial erosion rate is calculated as 0.29–0.34 mm a−1. For the palaeo-Petermann catchment we note that its area could not be significantly larger than the modern drainage basin because the ice stream was constrained to the fjord during deglaciation and the grounding line was at the fjord-mouth sill. Thus, we simply add the deglaciated area of the fjord to the modern Petermann catchment where ice velocities are high enough to allow glacial erosion and transport (i.e. where ice is at the pressure melting point and is not frozen to the bed). For this estimate, we have taken this as the area with (modern) ice velocities >50 m a−1 from the MEaSUREs v2 dataset, 2017–2018 velocities (Howat, 2017) (Fig. S1a).
Because of the physiography of the Petermann Fjord system, we are able distinguish between an “earlier” deglacial sediment volume (Petermann GZW and Hall Basin units), when the grounding line was on the fjord-mouth sill and deposition was only on the sill and in Hall Basin, from a “later” deglacial sediment volume (Petermann Fjord units), when grounded ice was retreating through the fjord. Using chronologies from Jakobsson et al. (2018), we can estimate an erosion rate for these two phases of deglaciation. The calculated for 8.7–7.6 ka when the Petermann ice stream was at the fjord mouth is 1.41–1.85 mm a−1. For the later phase, recent core chronologies show that the fjord was covered by a floating ice tongue by 6.9 ka (Reilly et al., 2019), and therefore must have been free from grounded ice by that time. This implies grounding-line retreat through the fjord in as little as 700 years. Assuming, as before, that all but the upper 0.5 m of fjord infill was deposited during this retreat returns a second-phase deglacial (7.6 ka to present) of 0.14 mm a−1.
One outstanding issue with this method of calculating glacial erosion rates is the potential storage of glacially derived material elsewhere in the system (see Cowton et al., 2012; Fernandez et al., 2016). Based on cores recovered from beneath the floating Petermann Ice Tongue (Reilly et al., 2019) there is at least some unconsolidated sediment cover beneath the tongue, and the modelled bathymetry there (based on a gravity inversion) also indicates the presence of an inner basin and sill with “some non-magnetic sediment cover” (Tinto et al., 2015). This inner basin may hold a considerable volume of ice-proximal sediment deposited since the grounding line has been close to its present location in the fjord. Assuming, for example, 30 m of sediment fill across the basin (approximately 10 km× 20 km in size after Tinto et al., 2015) adds 14 km3 of glacigenic sediment to the total volume and increases the estimated average erosion rate to 0.39–0.45 mm a−1. Additional material may also be stored subglacially upstream of the grounding line, and observations from Greenland confirm that tens of metres of sediment are indeed present in places (Walter et al., 2014). However, previous studies of glacimarine sediment volumes from a range of Northern and Southern Hemisphere fjords assume that the change in storage is negligible compared to the volume of material delivered to the fjord, particularly over 102–103 year timescales (Hallet et al., 1996; Koppes and Hallet, 2002; Fernandez et al., 2016), and we rely on the same assumption here. Nevertheless, for this reason, and because we cannot quantify the amount of sediment that exits the system in icebergs, our estimate should be taken as a minimum glacial erosion rate for the Petermann system.
5.1 Sedimentary infill of the Petermann–Nares Strait system
During the past ∼10 ka, the Petermann Fjord and adjacent parts of Nares Strait have been variably infilled with glacimarine sediment (Fig. 12) that is related primarily to the retreat of marine-terminating glaciers through the area, as is typical of today's ice-influenced fjords (Syvitski and Shaw, 1995). Stratigraphic, geomorphological and sedimentological observations are combined here with existing deglacial chronologies to produce a simple model for the evolution of fjord infill history. This model has three stages illustrating the major changes in glacier configuration, sediment supply and sedimentary processes.
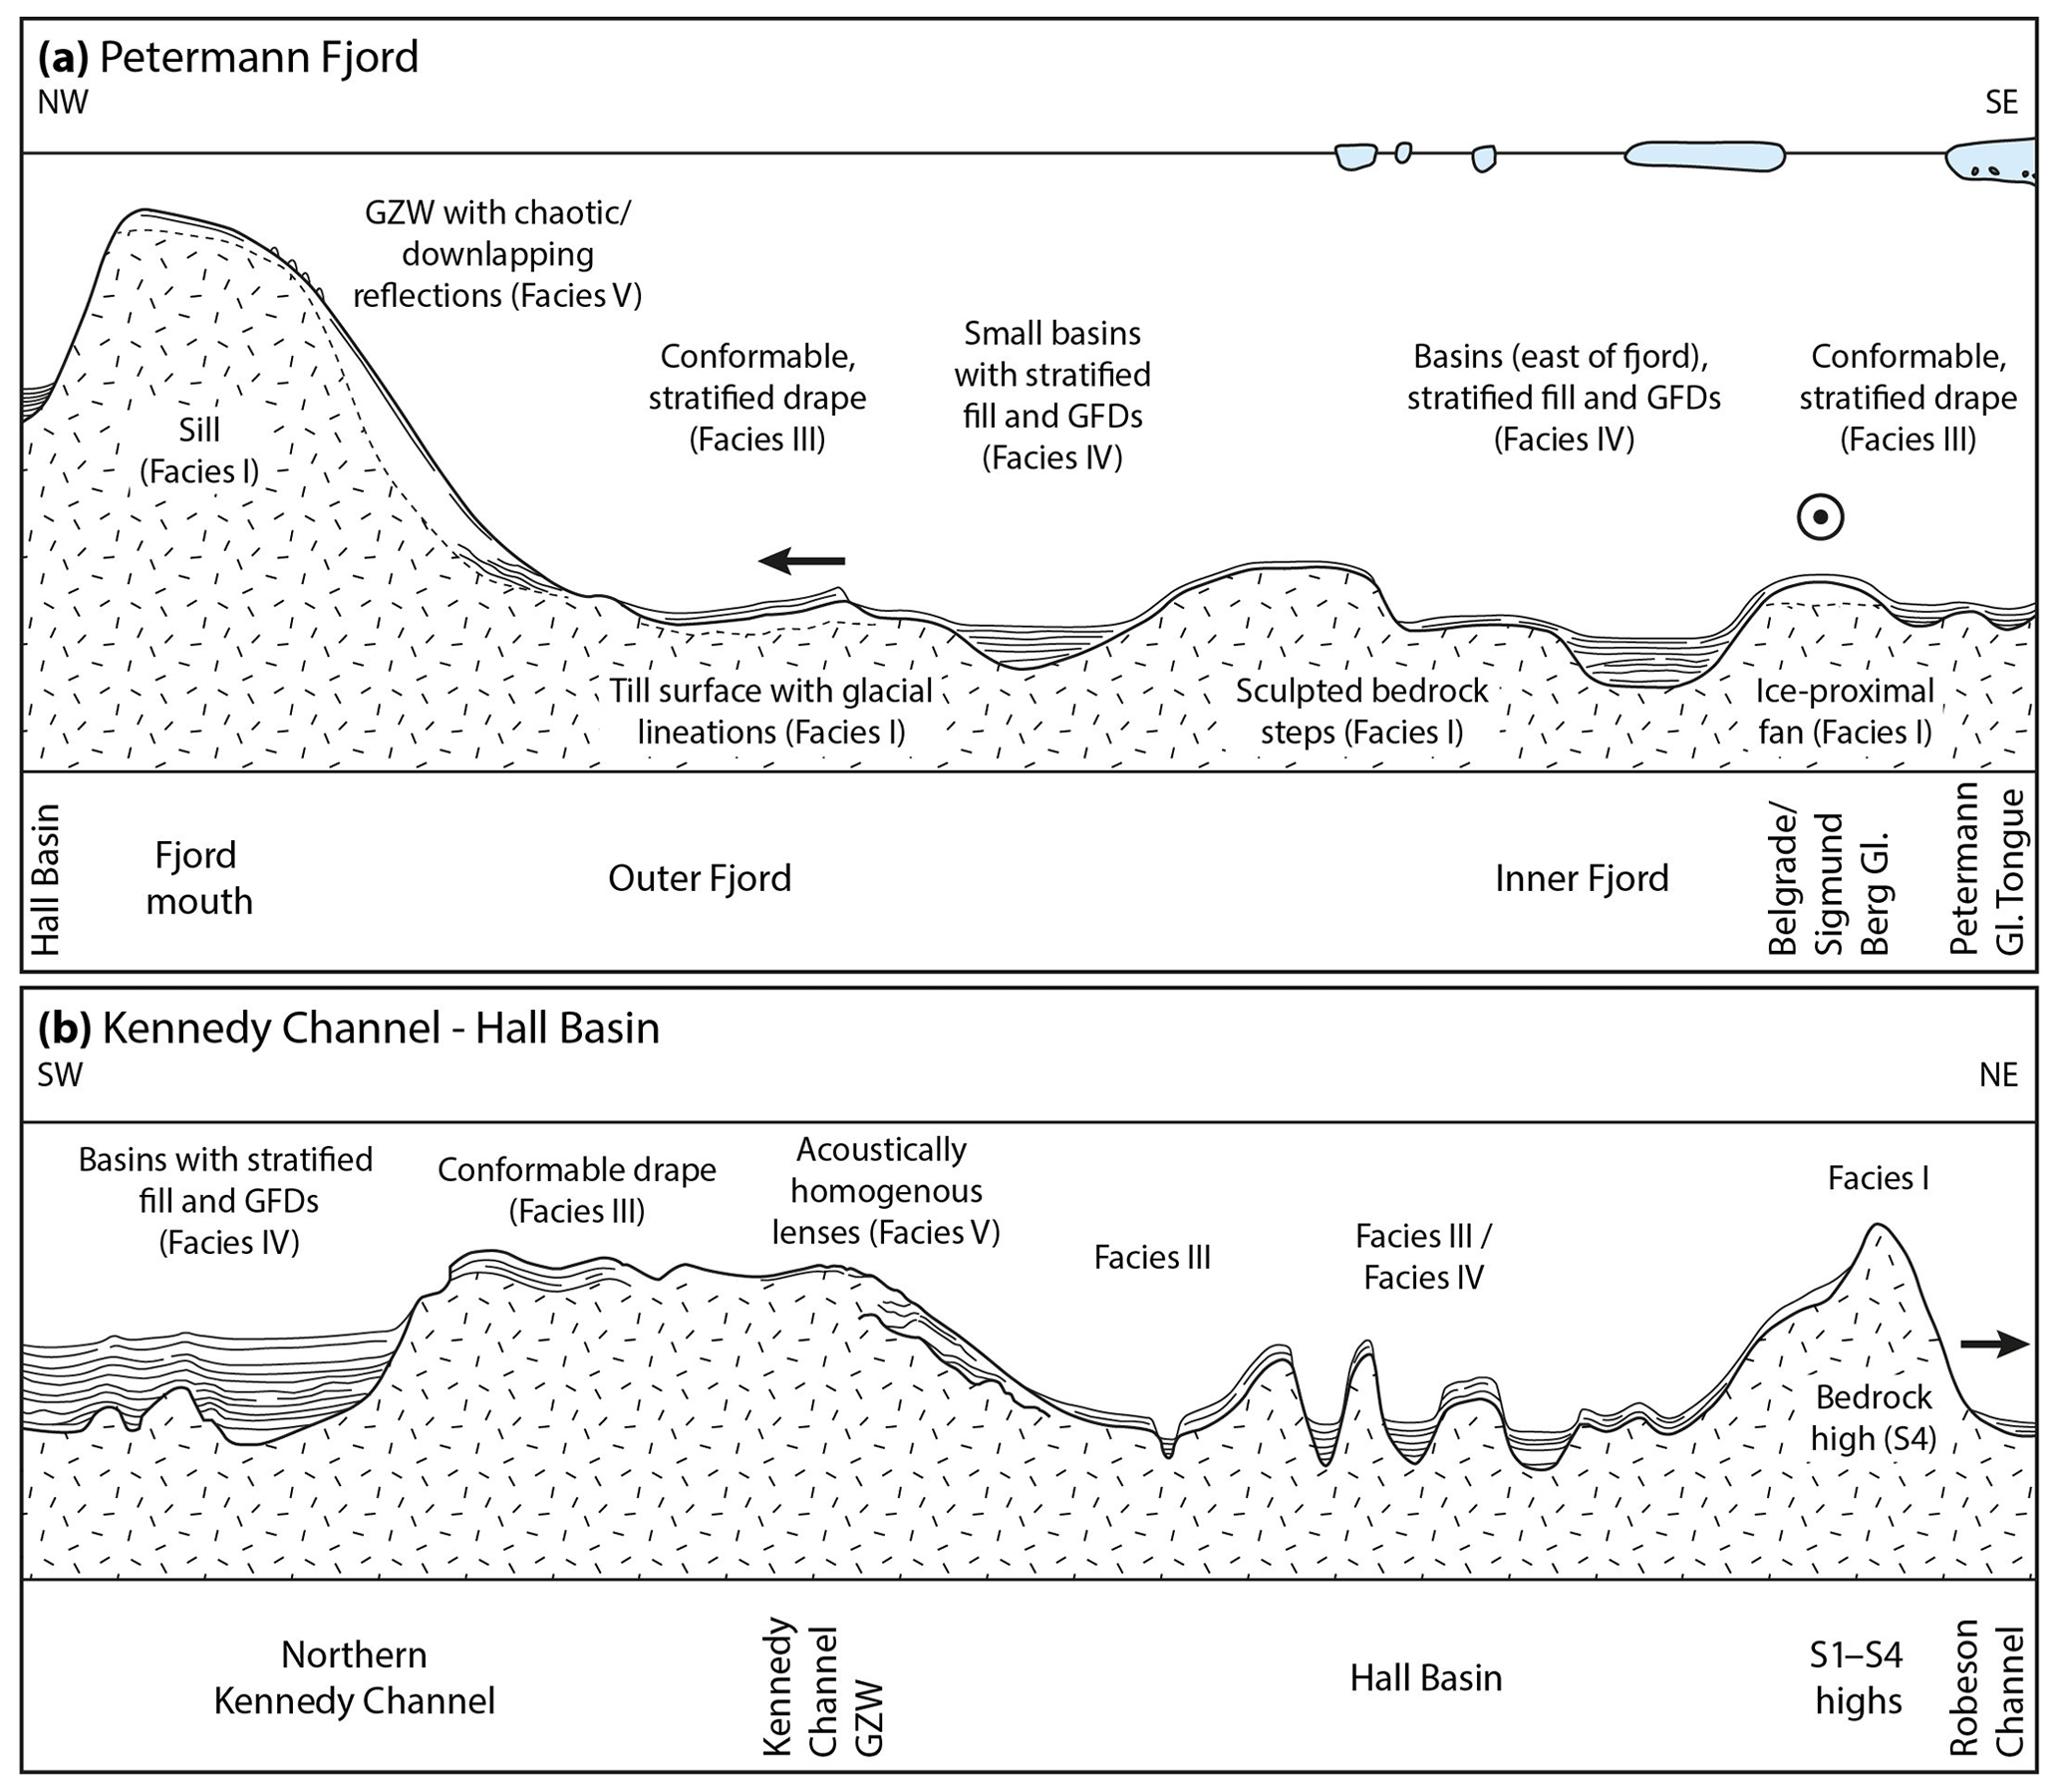
Figure 12Conceptual transects showing the seismic stratigraphy and distribution of glacimarine sediments in the Petermann Fjord–Nares Strait area. (a) Petermann Fjord with the fjord-mouth sill with GZW on the left side; localized sediment input into the NE side of the fjord from tributary glaciers and building an ice-proximal fan is shown as the bullseye. (b) Deglacial sediment cover in Nares Strait from Kennedy Channel to Hall Basin to Robeson Channel. Not to scale. Black arrows show the former ice flow direction through the system.
During the LGM, Petermann Fjord, Hall Basin, and the Robeson and Kennedy channels were all occupied by grounded ice of the coalesced Greenland and Innuitian ice sheets (England et al., 2006 and references therein; Jakobsson et al., 2018). Subglacial lineations were produced by fast ice flow in both the fjord and the Kennedy and Robeson channels depositing a thin till unit (e.g. Fig. 7c) that, based on our acoustic data, has a patchy distribution (e.g. Fig. 12a). However, till was also plastered onto bedrock terraces in the fjord as well as bedrock highs in Hall Basin (see Sect. 4.2).
By 8.7 ka cal BP, when the grounding line of the Petermann ice stream was on the fjord-mouth sill and was probably fronted by an ice shelf (Jakobsson et al., 2018; Jennings et al., 2018), Hall Basin was in an ice-proximal setting (i.e. within several tens of kilometres from the grounding line). Similarly, the outer Hall Basin and northern Kennedy Channel must have been in an ice-proximal setting when the ice margin in Nares Strait was located at the Kennedy Channel GZW, although the timing and duration of this stillstand event are not yet known. Subglacial deposits accumulated to form the wedges during the stillstands (Fig. 4). In Kennedy Channel, thick (>25 m) GFDs were deposited in front of the GZW (Figs. 10c, d, 12b), but similar units are conspicuously absent beyond the Petermann GZW (Figs. 8b, 12a). Seaward of these clear ice-proximal deposits, sedimentation in Hall Basin, Robeson Channel and northern Kennedy Channel was largely from the settling of IRD and fine-grained material from meltwater plumes. On slopes greater than about 5∘ in Hall Basin, this material was redeposited downslope and focussed into small basins (Fig. 12b), showing the strong influence of the rugged seafloor topography there. We find no evidence for additional stillstand events in our geophysical datasets, for example, on the S4 high between Hall Basin and Robeson Channel. As our understanding of ice shelf sediments increases (see Jennings et al., 2018; Smith et al., 2019), clues to the proximity of the grounding line, the configuration of ice shelves, and the timing of stillstand/ice shelf durations will be borne out by detailed (and forthcoming) sedimentological analyses of cores from Hall Basin.
Rapid glacier retreat through Petermann Fjord occurred after ∼7.6 ka cal BP (Jakobsson et al., 2018) with a floating tongue established over the fjord by 6.9 ka cal BP (Reilly et al., 2019). This new ice configuration removed glacial sediment inputs from outer and mid-fjord areas, placing these areas in an ice-distal setting where deposition was mostly from settling of IRD and distal plume deposits. From this time, the tributary glaciers that enter the fjord through valleys incised into its sidewalls (see Fig. 2) became an additional source of glacial sediment to the fjord and have built up small ice-proximal fans in front of their marine margins (Fig. 12a; Fig. 6b of Jakobsson et al., 2018). The near-instantaneous removal of sediment sources from the fjord (as the Petermann ice stream retreated rapidly) explains the lack of discrete accumulations of ice-contact or ice-proximal deposits in Petermann Fjord that are often associated with fjord settings (Fig. 12a; e.g. Hjelstuen et al., 2009; Stoker et al., 2009).
5.2 Comparisons with other ice stream systems: glacial sediment volumes and fluxes
There are relatively few previous studies that derive glacial sediment volumes, fluxes or basin-scale erosion rates for Greenland and none (for erosion rates) that we are aware of that use volumetric analyses in fjords. While it remains difficult to directly compare our results with other systems, recent mapping campaigns in the palaeo-catchment area of the Northeast Greenland Ice Stream (NEGIS; Roberts et al., 2017) will allow for a similar detailed study of that system. One possibly unusual feature of the Petermann Fjord–Nares Strait system is the absence of any thick (several hundreds of metres) accumulations of ice-proximal sediments beyond the fjord-mouth sill when the ice margin is known to have stabilized there for a period during retreat. As an analogue, a basin in front of the Jakobshavn Icefjord fjord-mouth sill holds more than 250 m of ice-proximal material deposited when the ice margin was at the sill (Hogan et al., 2012; Streuff et al., 2017) during the Fjord Stade ca. 10.6–9.4 ka (Young et al., 2013; Streuff et al., 2017). Similarly, fjords in Norway, east Greenland and Patagonia are known to contain 100–500 m of deglacial infill (Aarseth, 1997; Andrews et al., 1994; Bellwald et al., 2016; Fernandez et al., 2016), and seismic profiles of the inner shelf basin at the modern Pine Island Glacier ice shelf edge reveal that it holds >300 m of presumed ice-proximal sediment (Gohl, 2010; Nitsche et al., 2013). Given the similarity in fluxes between the palaeo-Jakobshavn and Petermann ice streams, we suggest that the lack of thick basin fill at Petermann is due to a shorter period of stabilization there, increased trapping efficiency of the large basin in front of the Jakobshavn sill when compared to the seafloor morphology of Hall Basin, or some combination of both factors.
Our calculated sediment flux for the palaeo-Petermann ice stream (1080–1420 m3 a−1 m−1; uncertainty range 890–2170 m3 a−1 m−1) is between estimates for modern ice streams (typically ∼102 m3 a−1 m−1; Kamb, 2001; Engelhardt and Kamb, 1998; Anandakrishnan et al., 2007; Christoffersen et al., 2010) and those for the largest Norwegian palaeo-ice streams that delivered sediment to the shelf break (6000–11 000 m3 a−1 m−1; Nygård, 2003; Nygård et al., 2007). The calculated flux range is notably similar to the range provided by Hogan et al. (2012) using the same methods for the palaeo-Jakobshavn Isbræ (1030–2300 m3 a−1 m−1) when that ice stream was also stable at its fjord-mouth sill, although that estimate did not include a subglacial (coarse/mixed-grain size) component. During the LGM, these two ice streams operated with the same glacier thermal regime (i.e. warm-based streaming ice; Roberts and Long, 2005; Ó Cofaigh et al., 2013; England, 1999; Jakobsson et al., 2018), which is known to be a primary control on glacial erosion rates along with climate (Hallet et al., 1996; Koppes et al., 2015). These two factors dominate over other variables like ice cover, sliding speeds and even ice flux (Elverhøi et al., 1998; Koppes et al., 2015), which explains the comparable estimates despite the larger (albeit modern) ice discharge of Jakobshavn Isbræ compared to Petermann (see Rignot and Kanagaratnam, 2006; Enderlin et al., 2014). The nature of the substrate is also important when considering sediment fluxes (Hallet et al., 1996), but its effect is somewhat difficult to assess for the two systems. Jakobshavn Isbræ erodes into banded gneiss with variable foliation and jointing (Roberts and Long, 2005), whereas Petermann Fjord has been eroded into bedded limestones of lower Palaeozoic age (Dawes et al., 2000) with slabs being removed along bedding planes. The bedrock steps left by removal of limestone beds are visible in the seafloor morphology (Fig. 2; Jakobsson et al., 2018). Upstream of the bedded limestones, the bedrock is the typical Archaean crystalline basement of Greenland that includes gneisses and granitoids (Henriksen et al., 2009). The abrasion strength of these rock types (based on Schmidt hammer rebound values; Krabbendam and Glasser, 2011) is similar if the limestones are hard (Goudie, 2006), but jointing is a major control on glacial plucking (e.g. Sugden et al., 1992; Dühnforth et al., 2010). Thus, it is difficult to distinguish between the erodibility of bedded limestones and Archaean basement versus jointed gneiss. Numerical modelling of these systems over our mapped bedrock surfaces and replicating our glacial fluxes would elucidate which factors control subglacial erosion rates and transport in the Petermann system. However, given the comparability of the two glacier systems, it appears from our results that the Petermann ice stream was approximately as efficient as the palaeo-Jakobshavn Isbræ at eroding, transporting and delivering sediment to its margin during the early deglaciation.
5.3 Comparisons with other fjord systems: glacial erosion rates
Erosion rates (and sediment fluxes) are likely to vary during a glacial–deglacial cycle due to pulsed ice streaming (e.g. Christoffersen et al., 2010) and because, early in the deglacial period, ice streaming may have been over unconsolidated sediment recently deposited during the preceding glacial advance (Elverhøi et al., 1998). Furthermore, increased erosion rates have been correlated with higher ice velocities associated with recent glacial retreat (Koppes and Hallet, 2002, 2006; Koppes et al., 2009). Our glacial erosion values for an earlier and later phase of deglaciation (1.41–1.85 and 0.14 mm a−1, respectively) indicate that deglacial erosion rates may have been an order of magnitude larger during the early deglacial when Petermann ice stream was grounded on the sill. Presumably, during this earlier stage, thinning ice and warmer basal temperatures led to enhanced ice flow at the bed (see Koppes and Montgomery, 2009); likewise, the ice stream was also in an expanded state allowing for relatively high erosion rates. Furthermore, there is landform evidence that surface meltwater may have reached the bed at this time (Jakobsson et al., 2018), thereby increasing the potential for subglacial erosion. We have to acknowledge that some sediment in the inner Hall Basin may have been produced by ice in Kennedy Channel, rather than the Petermann ice stream, which would artificially raise the early phase erosion rate calculated here. It is not possible to separate these two components based on currently available information, meaning the early phase erosion rate may be overestimated. However, our results are in line with past work showing that glacial erosion rates vary significantly over different timescales (see Koppes and Montgomery, 2009) and with different glaciologic states, especially during retreat when the glacier system experiences rapid changes (e.g. Hallet et al., 1996; Koppes and Hallet, 2002, 2006).
There are relatively few estimates of glacial erosion rates from Greenland. For the Kangerdlugssuaq Fjord and Trough system in east Greenland, Cowton et al. (2012) updated the modern erosion rate of Andrews et al. (1994) from 0.01 to 0.3 mm a−1. The former was based on estimated sediment discharges (for a certain ice flux), and Cowton et al. (2012) included the sediment deposited beneath the mélange (after Syvitski et al., 1996). However, as Cowton et al. (2012) noted, the Andrews et al. (1994) study assumed that glacial erosion occurred over the entire Kangerdlugssuaq catchment area (∼50 000 km2) including a large part of the ice-sheet interior, which has very low velocities (see Rignot and Kanagaratnam, 2006; Howat, 2017). In our comparison of glacial erosion rates, we elect to exclude portions of the ice-sheet interior that are likely frozen to the bed and, accordingly, decrease the catchment area for Kangerdlugssuaq to areas with ice velocities that would permit subglacial erosion. (Note that the catchment areas used for erosion rate calculations are fully described in the Supplement and Fig. S1). Using a catchment area (9437 km2) that includes only ice flowing at >50 m a−1 for the Kangerdlugssuaq system (Fig. S1c), as we have applied at Petermann, the modern erosion rate for the Kangerdlugssuaq system becomes 1.46 mm a−1. This rate is about 3 times larger than the average deglacial rate for the Petermann system. A useful exercise may be to calculate the basin-wide deglacial erosion rate for the Jakobshavn catchment area using the volume of glacimarine sediments deposited in front of the fjord-mouth sill (29.2 km3) during an 800 year stillstand (Hogan et al., 2012) and a glacial catchment area derived using the same procedures in this study (33 504 km2; Fig. S1b). This returns a glacial erosion rate for the palaeo-Jakobshavn Isbræ of 0.52 mm a−1 that can be compared with the early deglacial erosion rate for Petermann (1.41–1.85 mm a−1), as this was also calculated for the time when the grounding line was stable at its fjord mouth. As both systems were drained by a single, large, fast-flowing ice stream during the last glacial, the lower values for the palaeo-Jakobshavn ice stream may simply reflect the larger drainage basin used in those calculations. We note that the area of fastest ice flow (>400 m a−1) is considerably larger in the Petermann system than the Jakobshavn system (Petermann Fjord is about twice as wide) and that rates of glacial erosion are up to 4 times higher in fjords compared with inter-fjord areas (Stroeven et al., 2002; Briner et al., 2006). If the majority of glacial erosion occurs only in these narrow corridors for major outlet glacier systems, then the calculated glacial erosion rates would differ significantly as the narrow geometry of Jakobshavn would produce a much higher erosion rate. This indicates the need for a careful and consistent approach to defining the effective drainage basin area in glacial erosion studies for major outlet glaciers.
Modern glacial erosion rates have also been provided for the well-studied Kangerlussuaq area in central west Greenland, by measuring annual sediment loads (suspended and in solution) in proglacial rivers beyond land-terminating glaciers (Cowton et al., 2012; Hawkings et al., 2015; Hasholt et al., 2018) and dividing by the catchment area. Although individual study years have returned rates as high as 4.5 mm a−1, for the decade 2006–2016 the average rate was 0.5 mm a−1 (Hasholt et al., 2018). These studies used a consistent approach to defining the catchment area based on the ablation area for the Kangerlussuaq drainage basin and modelled hydrological catchment, which we deem as comparable to the approach taken here (i.e. excluding portions of the ice-sheet interior where erosion is limited). The average modern erosion rate from Kangerlussuaq (0.5 mm a−1) is similar to our average deglacial erosion rate for Petermann (0.29–0.34 mm a−1), despite the differences in methodologies employed, timescales studied (millennial vs. annual/decadal) and the glaciologic setting (multiple land-terminating glaciers vs. one large marine-terminating ice stream). Regarding the latter, significant surface melt occurs at Kangerlussuaq that then migrates to the bed via moulins and entrains sediment as it drains subglacially (Cowton et al., 2012). In contrast, although supra-glacial lakes are documented on the grounded portion of the modern Petermann Glacier during the summer, and may drain to the bed (MacDonald et al., 2018), the fast flow is the dominant control on basal sliding (see Nick et al., 2012) and, therefore, presumably on glacial erosion for this catchment. Previous studies have suggested that modern rates may not be representative of longer-term (millennial) rates because of recent increases in subglacial erosion (and/or sediment evacuation) as glaciers accelerate in today's warming climate (Koppes and Montgomery, 2009). This is certainly true for the GrIS where surface mass balance has become increasingly negative over the last four decades (Mouginot et al., 2019), suggesting that modern glacial erosion rates have probably started to rapidly accelerate over the last decade. However, the rates that we calculate for the Petermann system are for a major phase of deglaciation when the ice stream likely accelerated and subglacial erosion was enhanced and therefore may be comparable to the accelerated retreat of today's glaciers. Regardless, we must be cautious when comparing rates that employ different procedures and are determined for very different timescales.
There is a large body of previous work using the volume of glacimarine sediments in fjords to derive sediment yields and, ultimately, glacial erosion rates during retreat (e.g. Powell et al., 1991; Hunter, 1994; Stravers and Syvitski, 1991; Hallet et al., 1996; Elverhøi et al., 1995; Koppes and Hallet, 2002; Fernandez et al., 2016). Erosion rates for Alaskan glaciers, where the climate is temperate and tectonic uplift are major contributing factors, are exceptionally high (>10–100 mm a−1; Hallet et al., 1996). The study of Fernandez et al. (2016) reported average millennial erosion rates between 0.02 and 0.83 mm a−1 for Patagonian and Antarctic Peninsula fjord systems (since deglaciation) and provides a ready comparison to the results of this study. Their values for the Antarctic Peninsula cluster around 0.1 mm a−1, which is comparable to the average value we derive for the Petermann catchment. They also highlight a decrease in erosion rates with increasing latitude that they attribute to decreasing temperatures and availability of liquid water at the ice–rock interface. The Petermann area, situated at ∼81∘ N, has a polar climate with a mean annual temperature (MAT) of around −11 ∘C (for Thule Air Base; Yr.no, 2019) at present; based on reconstruction from ice cores, surface air temperatures were around 1–3 ∘C higher than today during deglaciation (Lecavalier et al., 2017). The only system with a comparable MAT in the Fernandez et al. (2016) study is Herbert Sound on the eastern Antarctic Peninsula (MAT ∘C; mm a−1); however, as noted earlier, relatively little surface meltwater accesses the bed in this type of glaciologic setting and the fast flow of feeder glaciers likely dominates glacial erosion. We suggest that the higher deglacial erosion rate at Petermann compared with the Antarctic Peninsula fjords was, therefore, most likely caused by a high trapping efficiency of the Petermann Fjord–Hall Basin setting in conjunction with the erosive potential of a major (∼20 km wide; >1500 m thick) ice stream draining the area during deglaciation.
We present the first comprehensive, high-resolution investigation of the glacial sedimentary infill of a major fjord system in Greenland. The seismic stratigraphy of Petermann Fjord and the adjacent Nares Strait area confirm the episodic retreat of ice streams in the area marked by GZW deposits, followed by the deposition of sediment from meltwater plumes and icebergs. The rugged bedrock topography is a major control on sediment distribution in relation to the retreating ice margin; redeposition by gravity flows was important only on local scales. Our mapped unconsolidated sediment volumes provide glacial sediment fluxes for the former Petermann ice stream when it was stable on a sill at the fjord mouth, which are in line with sediment flux estimates from modern Antarctic and other Northern Hemisphere palaeo-ice streams, including the palaeo-Jakobshavn Isbræ. The average deglacial erosion rate that we calculate for the Petermann drainage basin is one of only a few erosion rate estimates for Greenland; it is similar to the rates from the Antarctic Peninsula and some Patagonian catchments, despite being subject to a much colder climate. In this setting, ice dynamics such as the fast flow of Petermann Glacier (or former ice stream), rather than climate, are the dominant controls on glacial erosion. The order-of-magnitude difference between glacial erosion rates during an early phase of deglaciation (when the grounding line was stable at the fjord mouth) and a later phase (of retreat through the fjord) confirms significant variability in erosion rates related to deglacial retreat rates and ice dynamics. Mapped pre-LGM surfaces, calculated glacial sediment fluxes and our range of glacial erosion rates provide much needed observational constraints on future numerical modelling experiments of the Petermann system, now one of the best studied outlet glacier systems in Greenland.
The marine geophysical data used in this paper can be obtained by contacting the second author (martin.jakobsson@geo.su.se). The 2001 BGR seismic-reflection profiles are available on request from https://cdi.seadatanet.org/ (last access: 9 December 2019).
The supplement related to this article is available online at: https://doi.org/10.5194/tc-14-261-2020-supplement.
KeAH, MJ and LM conceived the study; they and BR, AJ, AM, KaAH, EN, KJ, JSS and CS collected the data during the Petermann 2015 Expedition. TN, KJA and EK performed some initial mapping. KeAH analysed the SBP data, integrated them with the seismic-reflection data, and calculated flux and erosion estimates with contributions from MJ, AJ and BR. KeAH wrote the initial manuscript with substantial contributions from MJ, BR, AJ and LM. All authors contributed to data interpretation and writing of the final paper.
The authors declare that they have no conflict of interest.
The Petermann 2015 Expedition was supported by the US NSF Polar Programs, NASA, UNAVCO, CH2M Polar Field Services (Jessy Jenkins), Polar Geospatial Center, the Swedish Polar Research Secretariat, and the Swedish Maritime Administration. We thank the Federal Institute for Geosciences and Natural Resources (BGR), Hanover, for giving us permission to use the 2001 seismic-reflection profiles in this study. We also thank Geocenter Danmark, who supported the inclusion of multichannel seismic data acquisition during the Petermann 2015 Expedition and Per Trinhammer for his help acquiring these data. We thank Neil Arnold for the useful discussions about Greenland glaciology and hydrology.
This research has been supported by the National Science Foundation, Office of Polar Programs (grant nos. 1418053, 1417787, and 1417784). Kelly A. Hogan's time was supported by the British Antarctic Survey Polar Science for Planet Earth Programme funded by the UK's Natural Environment Research Council, as well as by the Visiting Scholar Program at the Center for Coastal and Ocean Mapping at the University of New Hampshire. Martin Jakobsson and his colleagues from Stockholm University were supported by a grant from the Swedish Research Council (VR). The Swedish Polar Research Secretariat and the US NSF Polar Program financed the operation of icebreaker Oden.
This paper was edited by Chris R. Stokes and reviewed by two anonymous referees.
Aarseth, I.: Western Norwegian fjord sediments: age, volume, stratigraphy, and role as temporary depository during glacial cycles, Mar. Geol., 143, 39–53, 1997.
Alley, R. B., Blakenship, D. D., Rooney, S. T., and Bentley, C. R.: Sedimentation beneath ice shelves – the view from Ice Stream B, Mar. Geol., 85, 101–202, 1989.
Alley, R. B., Anandakrishnan, S., Dupont, T. K., Parizek, B. R., and Pollard, D.: Effect of Sedimentation on Ice-Sheet Grounding-Line Stability, Science, 315, 1838–1841, 2007.
Amundson, J. M., M. Fahnestock, M. Truffer, J. Brown, M. P. Lüthi, and R. J. Motyka: Ice mélange dynamics and implications for terminus stability, Jakobshavn Isbræ, Greenland, J. Geophys. Res., 115, F01005, https://doi.org/10.1029/2009JF001405, 2010.
Anandakrishnan, S., Catania, G. A., Alley, R. B., and Horgan, H. J.: Discovery of Till Deposition at the Grounding Line of Whillans Ice Stream, Science, 315, 1835–1838, 2007.
Anderson, J. B.: Antarctic Marine Geology, Cambridge University Press, London, UK, 1999.
Andrews, J. T., Milliman, J. D., Jennings, A. E., Rynes, N., and Dwyer, J.: Sediment Thicknesses and Holocene Glacial Marine Sedimentation Rates in Three East Greenland Fjords (ca. 68∘ N), J. Geol., 102, 669–683, 1994.
Bellwald, B., Hjelstuen, B. O., Sejrup, H. P., and Haflidason, H.: Postglacial mass movements and depositional environments in a high-latitude fjord system – Hardangerfjorden, Western Norway, Mar. Geol., 379, 157–175, 2016.
Bjarnadóttir, L. R., Rüther, D. C., Winsborrow, M. C. M., and Andreassen, K.: Grounding-line dynamics during the last deglaciation of Kveithola, W Barents Sea, as revealed by seabed geomorphology and shallow seismic stratigraphy, Boreas, 42, 84–107, 2013.
Bøe, R., Longva, O., Lepland, A., Blikra, L. H., Sønstegaard, E., Haflidason, H., Bryn, P., and Lien, R.: Postglacial mass movements and their causes in fjords and lakes in western Norway, Norsk Geol. Tidsskr., 84, 35–55, 2004.
Briner, J. P., Miller, G. H., Davis, P. T., and Finkel, R. C.: Cosmogenic radionuclides from fiord landscapes support differential erosion by overriding ice sheets, GSA Bulletin, 118, 406–420, 2006.
Cai, C., Rignot, E., Menemenlis, D., and Nakayama, Y.: Observations and modeling of ocean-induced melt beneath Petermann Glacier Ice Shelf in northwestern Greenland, Geophys. Res. Lett., 44, 8396–8403, 2017.
Callard, S. L., Ó Cofaigh, C., Benetti, S., Chiverrell, R. C., Van Landeghem, K. J. J., Saher, M. H., Gales, J. A., Small, D., Clark, C. D., Livingstone, S. J., Fabel, D., and Moreton, S. G.: Extent and retreat history of the Barra Fan Ice Stream offshore western Scotland and northern Ireland during the last glaciation, Quaternary Sci. Rev., 201, 280–302, 2018.
Chen, X., Zhang, X., Church, J. A., Watson, C. S., King, M. A., Monselesan, D., Legresy, B., and Harig, C., The increasing rate of global mean sea-level rise during 1993–2014, Nat. Clim. Change, 7, 492–495, 2017.
Christoffersen, P., Tulaczyk, S., and Behar, A.: Basal ice sequences in Antarctic ice stream: Exposure of past hydrologic conditions and a principal mode of sediment transfer, J. Geophys. Res.-Earth, 115, F03034, https://doi.org/10.1029/2009JF001430, 2010.
Cochrane, G. R., De Santis, L., and Cooper, A. K.: Seismic velocity expression of glacial sedimentary rocks beneath the Ross Sea from sonobuoy seismic-refraction data, Antar. Res. S., 68, 261–270, 1995.
Cowton, T., Nienow, P., Bartholomew, I., Sole, A., and Mair, D.: Rapid erosion beneath the Greenland ice sheet, Geology, 40, 343–346, 2012.
Dawes, W.: Explanatory notes to the Geological map of Greenland, 1:500 000, Humboldt Gletscher, Sheet 6. 1–48, Geological Survey of Denmark and Greenland, Copenhagen, Denmark, 2004.
Dawes, P. R., Frisch, T., Garde, A. A., Iannelli, T. R., Ineson, J. R., Jensen, S. M., Pirajno, F., Sønderholm, M., Stemmerik, L., and Stouge, S.: Kane Basin 1999: mapping, stratigraphic studies and economic assessment of Precambrian and Lower Palaeozoic provinces in north-western Greenland, Geology of Greenland Survey Bulletin, 186, 11–28, 2000.
DMI: https://www.dmi.dk/en/groenland/hav/ice-charts/ (last access: 9 December 2019), 2018.
Dowdeswell, J. A. and Fugelli, E.: The seismic architecture and geometry of grounding-zone wedges formed at the marine margins of past ice sheets, Geol. Soc. Am. Bull., 124, 1750–1761, 2012.
Dühnforth, M., Anderson, R. S., Ward, D., and Stock, G. M.: Bedrock fracture control of glacial erosion processes and rates, Geology, 38, 423–426, 2010.
Elverhøi, A., Pfirman, S. L., Solheim, A., and Larssen, B. B.: Glacimarine sedimentation in epicontinental seas exemplified by the northern Barents Sea, Mar. Geol., 85, 225–250, 1989.
Elverhøi, A., Svendsen, J. I., Solheim, A., Andersen, E. S., Milliman, J., Mangerud, J., and Hooke, R. L.: Late Quaternary Sediment Yield from the High Arctic Svalbard Area, J. Geol., 103, 1–17, 1995.
Elverhøi, A., Hooke, R. L., and Solheim, A.: Late Cenozoic erosion and sediment yield from the Svalbard–Barents Sea region: implications for understanding erosion of glacierized basins, Quaternary Sci. Rev., 17, 209–241, 1998.
Enderlin, E. M., Howat, I. M., Jeong, S., Noh, M.-J., van Angelen, J. H., and van den Broeke, M. R.: An improved mass budget for the Greenland ice sheet, Geophys. Res. Lett., 41, 866–872, 2014.
Engelhardt, H. F. and Kamb, B.: Basal sliding of Ice Stream B, West Antarctica, J. Glaciol., 44, 223–230, 1998.
England, J.: Coalescent Greenland and Innuitian ice during the Last Glacial Maximum: revising the Quaternary of the Canadian High Arctic, Quaternary Sci. Rev., 18, 421–456, 1999.
England, J., Atkinson, N., Bednarski, J., Dyke, A. S., Hodgson, D. A., and Ó Cofaigh, C.: The Innuitian Ice Sheet: configuration, dynamics and chronology, Quaternary Sci. Rev., 25, 689–703, 2006.
Esteves, M., Bjarnadóttir, L. R., Winsborrow, M. C. M., Shackleton, C. S., and Andreassen, K.: Retreat patterns and dynamics of the Sentralbankrenna glacial system, central Barents Sea, Quaternary Sci. Rev., 169, 131–147, 2017.
Evans, J., Dowdeswell., J.A., Grobe, H., Niessen, F., Stein, R., Hubberten, H.-W., and Whittington, R. J.: Late Quaternary sedimentation in Kejser Franz Joseph Fjord and the continental margin of East Greenland, Geological Society, London, Special Publications, 203, 149–179, 2002.
Fernandez, R. A., Anderson, J. B., Wellner, J. S., Minzoni, R. L., Hallet, B., and Smith, R. T.: Latitudinal variation in glacial erosion rates from Patagonia and the Antarctic Peninsula (46∘ S–65∘ S), GSA Bulletin, 128, 1000–1023, 2016.
Flink, A. E., Noormets, R., Kirchner, N., Benn, D. I., Luckman, A., and Lovell, H.: The evolution of a submarine landform record following recent and multiple surges of Tunabreen glacier, Svalbard, Quaternary Sci. Rev., 108, 37–50, 2015.
Funder, S., Kjeldsen, K. K., Kjær, K. H., and Ó Cofaigh, C.: Chapter 50 – The Greenland Ice Sheet During the Past 300,000 Years: A Review, in: Developments in Quaternary Sciences, edited by: Ehlers, J., Gibbard, P. L., and Hughes, P. D., Elsevier, Amsterdam, the Netherlands, 2011.
Georgiadis, E., Giraudeau, J., Martinez, P., Lajeunesse, P., St-Onge, G., Schmidt, S., and Massé, G.: Deglacial to postglacial history of Nares Strait, Northwest Greenland: a marine perspective from Kane Basin, Clim. Past, 14, 1991–2010, https://doi.org/10.5194/cp-14-1991-2018, 2018.
Gilbert, R., Nielsen, N., Desloges, J. R., and Rasch, M.: Contrasting glacimarine sedimentary environments of two arctic fiords on Disko, West Greenland, Mar. Geol., 147, 63–83, 1998.
Gilbert, R., Nielsen, N., Möller, H., Desloges, J. R., and Rasch, M.: Glacimarine sedimentation in Kangerdluk (Disko Fjord), West Greenland, in response to a surging glacier, Mar. Geol., 191, 1–18, 2002.
Gohl, K.: The Expedition of the Research Vessel “Polarstern” to the Amundsen Sea, Antarctica, in 2010 (ANT-XXVI/3), Berichte zur Polar- und Meeresforschung, Alfred Wegener Institute for Polar and Marine Research, Bremerhaven, Germany, 168 pp., 2010.
Goudie, A. S.: The Schmidt Hammer in geomorphological research, Prog. Phys. Geog., 30, 703–718, 2006.
Hallet, B., Hunter, L., and Bogen, J.: Rates of erosion and sediment evacuation by glaciers: A review of field data and their implications, Global Planet. Change, 12, 213–235, 1996.
Hamilton, E. L.: Sound velocity, elasticity, and related properties of marine sediments, North Pacific, 1, Sediment properties, environmental control, and empirical relationships, Naval Undersea Research Development Center Technical Publication 1J3, San Diego, CA, USA, 1969.
Hasholt, B., van As, D., Mikkelsen, A. B., Mernild, S. H., and Yde, J. C.: Observed sediment and solute transport from the Kangerlussuaq sector of the Greenland Ice Sheet (2006–2016), Arct. Antarct. Alp. Res., 50, S100009, https://doi.org/10.1080/15230430.2018.1433789, 2018.
Hawkings, J. R., Wadham, J. L., Tranter, M., Lawson, E., Sole, A., Cowton, T., Tedstone, A. J., Bartholomew, I., Nienow, P., Chandler, D., and Telling, J.: The effect of warming climate on nutrient and solute export from the Greenland Ice Sheet, Geochem. Perspect. Lett., 1, 94–104, 2015.
Henriksen, N., Higgins, A. K., Kalsbeek, F., and Pulvertaft, T. C.: Greenland from Archaean to Quaternary Descriptive text to the 1995 Geological map of Greenland, 1 : 2 500 000, Geological Survey of Denmark and Greenland Bulletin, 18, 1–93, 2009.
Hesse, R., Khodabakhsh, S., Klaucke, I., and Ryan, W. B. F.: Asymmetrical turbid surface-plume deposition near ice-outlets of the Pleistocene Laurentide ice sheet in the Labrador Sea, Geo-Mar. Lett., 17, 179–187, 1997.
Heuzé, C., Wåhlin, A., Johnson, H. L., and Münchow, A.: Pathways of Meltwater Export from Petermann Glacier, Greenland, J. Phys. Oceanogr., 47, 405–418, 2017.
Hjelstuen, B. O., Haflidason, H., Sejrup, H. P., and Lyså, A.: Sedimentary processes and depositional environments in glaciated fjord systems – Evidence from Nordfjord, Norway, Mar. Geol., 258, 88–99, 2009.
Hofstede, C., Christoffersen, P., Hubbard, B., Doyle, S. H., Young, T. J., Diez, A., Eisen, O., and Hubbard, A.: Physical Conditions of Fast Glacier Flow: 2. Variable Extent of Anisotropic Ice and Soft Basal Sediment From Seismic Reflection Data Acquired on Store Glacier, West Greenland, J. Geophys. Res.-Earth, 123, 349–362, 2018.
Hogan, K. A., Dowdeswell, J., and Cofaigh, C. Ó.: Glacimarine sedimentary processes and depositional environments in an embayment fed by West Greenland ice streams, Mar. Geol., 311, 1–16, 2012.
Holland, D. M., Thomas, R. H., De Yound, B., Ribergaard, M. H., and Lyberth, B.: Acceleration of Jakobshavn Isbræ triggered by warm subsurface ocean waters, Nat. Geosci., 1, 659–664, 2008.
Hooke, R. and Elverhøi, A.: Sediment flux from a fjord during glacial periods, Isfjorden, Spitsbergen, Global Planet. Change, 12, 237–249, 1996.
Howat, I. M.: MEaSUREs Greenland Ice Velocity: Selected Glacier Site Velocity Maps from Optical Images, Version 2, edited by: Howat, I. M., NASA National Snow and Ice Data Center Distributed Active Archive Center. Ice Velocity, Boulder, Colorado, USA, 2017.
Hunter, L.: Grounding-line systems of modern temperate glaciers and their effects on glacier stability, PhD, Northern Illinois University, DeKalb, USA, 467 pp., 1994.
Jackson, H. R., Hannon, T., Neben, S., Piepjohn, K., and Brent, T.: Seismic Reflection Profiles from Kane to Hall Basin, Nares Strait: Evidence for Faulting, Polarforschung, 74, 21–39, 2006.
Jakobsson, M., Mayer, L., Coakley, B., Dowdeswell, J. A., Forbes, S., Fridman, B., Hodnesdal, H., Noormets, R., Pedersen, R., Rebesco, M., Schenke, H. W., Zarayskaya, Y., Accettella, D., Armstrong, A., Anderson, R. M., Bienhoff, P., Camerlenghi, A., Church, I., Edwards, M., Gardner, J. V., Hall, J. K., Hell, B., Hestvik, O., Kristoffersen, Y., Marcussen, C., Mohammad, R., Mosher, D., Nghiem, S. V., Pedrosa, M. T., Travaglini, P. G., and Weatherall, P.: The International Bathymetric Chart of the Arctic Ocean (IBCAO) Version 3.0, Geophys. Res. Lett., 39, L12609, https://doi.org/10.1029/2012GL052219, 2012.
Jakobsson, M., Hogan, K. A., Mayer, L. A., Mix, A., Jennings, A., Stoner, J., Eriksson, B., Jerram, K., Mohammad, R., Pearce, C., Reilly, B., and Stranne, C.: The Holocene retreat dynamics and stability of Petermann Glacier in northwest Greenland, Nat. Commun., 9, 2104, https://doi.org/10.1038/s41467-018-04573-2, 2018.
Jennings, A. E., Sheldon, C., Cronin, T. M., Francus, P., Stoner, J., and Andrews, J.: The Holocene History Of Nares Strait: Transition from Glacial Bay to Arctic-Atlantic Throughflow, Oceanography, 24, 26–41, 2011.
Jennings, A. E., Reilly, B., Andrews, J., Walczak, M., Stoner, J., Mix, A., and Jakobsson, M.: Sediment and Faunal Evidence of Ice Shelves and Their Disintegration during the Early Holocene Deglaciation of Nares Strait, American Geophysical Union, Fall Meeting 2018, 10–14 December 2018, Washington, D.C., USA, PP41B-02, 2018.
Jennings, A. E., Andrews, J. T., Oliver, B., Walczak, M., and Mix, A.: Retreat of the Smith Sound Ice Stream in the Early Holocene, Boreas, 48, 825–840, 2019.
Johnson, H. L., Münchow, A., Falkner, K. K., and Melling, H.: Ocean circulation and properties in Petermann Fjord, Greenland, J. Geophys. Res.-Oceans, 116, C01003, https://doi.org/10.1029/2010JC006519, 2011.
Kamb, B.: Basal Zone of the West Antarctic Ice Streams and its Role in Lubrication of Their Rapid Motion, in: The West Antarctic Ice Sheet: Behavior and Environment, Antar. Res. S., 77, 157–199, 2001.
King, E. C., Woodward, J., and Smith, A. M.: Seismic evidence for a water-filled canal in deforming till beneath Rutford Ice Stream, West Antarctica, Geophys. Res. Lett., 31, L20402, https://doi.org/10.1029/2004GL020379, 2004.
Koppes, M. and Hallet, B.: Erosion rates during rapid deglaciation in Icy Bay, Alaska, J. Geophys. Res.-Earth, 111, F02023, https://doi.org/10.1029/2005JF000349, 2006.
Koppes, M., Hallet, B., Rignot, E., Mouginot, J., Wellner, J. S., and Boldt, K.: Observed latitudinal variations in erosion as a function of glacier dynamics, Nature, 526, 100–103, https://doi.org/10.1038/nature15385, 2015.
Koppes, M., Hallet, B., and Anderson, J.: Synchronous acceleration of ice loss and glacial erosion, Glaciar Marinelli, Chilean Tierra del Fuego, J. Glaciol., 55, 207–220, 2009.
Koppes, M. N. and Montgomery, D. R.: The relative efficacy of fluvial and glacial erosion over modern to orogenic timescales, Nat. Geosci., 2, 644–647, https://doi.org/10.1038/ngeo616, 2009.
Koppes, M. L. N. and Hallet, B.: Influence of rapid glacial retreat on the rate of erosion by tidewater glaciers, Geology, 30, 47–50, 2002.
Krabbendam, M. and Glasser, N. F.: Glacial erosion and bedrock properties in NW Scotland: Abrasion and plucking, hardness and joint spacing, Geomorphology, 130, 374–383, 2011.
Laberg, J. S. and Vorren, T. O.: The Trænadjupet Slide, offshore Norway – morphology, evacuation and triggering mechanisms, Mar. Geol., 171, 95–114, 2000.
Larsen, N. K., Kjær, K. H., Funder, S., Möller, P., van der Meer, J. J. M., Schomacker, A., Linge, H., and Darby, D. A.: Late Quaternary glaciation history of northernmost Greenland – Evidence of shelf-based ice, Quaternary Sci. Rev., 29, 3399–3414, 2010.
Larter, R. D. and Vanneste, L. E.: Relict subglacial deltas on the Antarctic Peninsula outer shelf, Geology, 23, 33–36, 1995.
Lecavalier, B. S., Fisher, D. A., Milne, G. A., Vinther, B. M., Tarasov, L., Huybrechts, P., Lacelle, D., Main, B., Zheng, J., Bourgeois, J., and Dyke, A. S.: High Arctic Holocene temperature record from the Agassiz ice cap and Greenland ice sheet evolution, P. Natl. Acad. Sci. USA, 114, 5952–5957, https://doi.org/10.1073/pnas.1616287114, 2017.
Lomac-MacNair, K., Jakobsson, M., Mix, A., Freire, F., Hogan, K., Mayer, L., and Smultea, M. A.: Seal occurrence and habitat use during summer in Petermann Fjord, northwestern Greenland, Arctic, 71, 334–349, 2018.
MacDonald, G., Banwell, A. F., and MacAyeal, D. R.: Seasonal evolution of supraglacial lakes on a floating ice tongue, Petermann Glacier, Greenland, Ann. Glaciol., 59, 56–65, 2018.
Madaj, L.: Holocene Organic Carbon and Carbonate Records from Northeast Baffin Bay: Preliminary Age Model and Paleoenvironmental Significance, MSc, Department of Earth Sciences, University of Gothenburg, Gothenburg, Sweden, 48 pp., 2016.
Möller, P., Larsen, N. K., Kjær, K. H., Funder, S., Schomacker, A., Linge, H., and Fabel, D.: Early to middle Holocene valley glaciations on northernmost Greenland, Quaternary Sci. Rev., 29, 3379–3398, 2010.
Mouginot, J., Rignot, E., Bjørk, A. A., van den Broeke, M., Millan, R., Morlighem, M., Noël, B., Scheuchl, B., and Wood, M.: Forty-six years of Greenland Ice Sheet mass balance from 1972 to 2018, P. Natl. Acad. Sci. USA, 116, 9239–9244, https://doi.org/10.1073/pnas.1904242116, 2019.
Mudie, P. J., Rochon, A., Prins, M. A., Soenarjo, D., Troelstra, S. R., Levac, E., Scott, D. B., Roncaglia, L., and Kuijpers, A.: Late Pleistocene-Holocene Marine Geology of Nares Strait Region: Palaeoceanography from Foraminifera and Dinoflagellate Cysts, Sedimentology and Stable Isotopes, Polarforschung, 74, 169–183, 2006.
Münchow, A., Melling, H., and Falkner, K. K.: An Observational Estimate of Volume and Freshwater Flux Leaving the Arctic Ocean through Nares Strait, J. Phys. Oceanogr., 36, 2025–2041, 2006.
Münchow, A., Padman, L., Washam, P., and Nicholls, K. W.: The Ice Shelf Of Petermann Gletscher, North Greenland, And Its Connection To The Arctic And Atlantic Oceans, Oceanography, 29, 84–95, 2016.
Nick, F. M., Luckman, A., Vieli, A., Van Der Veen, C.J., Van As, D., Van De Wal, R. S. W., Pattyn, F., Hubbard, A. L., and Floriciou, D.: The response of Petermann Glacier, Greenland, to large calving events, and its future stability in the context of atmospheric and oceanic warming, J. Glaciol., 208, 229–239, 2012.
Nielsen, T. and Rasmussen, T. L.: Reconstruction of ice sheet retreat after the Last Glacial maximum in Storfjorden, southern Svalbard, Mar. Geol., 402, 228–243, 2018.
Nitsche, F. O., Gohl, K., Larter, R. D., Hillenbrand, C.-D., Kuhn, G., Smith, J. A., Jacobs, S., Anderson, J. B., and Jakobsson, M.: Paleo ice flow and subglacial meltwater dynamics in Pine Island Bay, West Antarctica, The Cryosphere, 7, 249–262, https://doi.org/10.5194/tc-7-249-2013, 2013.
Nygård, A.: Pleistocene sedimentary processes and glacial history of the Southern Norwegian continental margin, PhD, University of Bergen, Bergen, Norway, 126 pp., 2003.
Nygård, A., Sejrup, H. P., Haflidason, H., Lekens, W. A. H., Clark, C. D., and Bigg, G. R.: Extreme sediment and ice discharge from marine-based ice streams: New evidence from the North Sea, Geology, 35, 395–398, 2007.
Ó Cofaigh, C., Dowdeswell, J. A., and Grobe, H.: Holocene glacimarine sedimentation, inner Scoresby Sund, East Greenland: influence of fast-flowing ice-sheet outlet glaciers, Mar. Geol., 175, 103–129, 2001.
Ó Cofaigh, C., Dowdeswell, J. A., Allen, C. S., Hiemstra, J. F., Pudsey, C. J., Evans, J., and Evans, D. J. A.: Flow dynamics and till genesis associated with a marine-based Antarctic palaeo-ice stream, Quaternary Sci. Rev., 24, 709–740, 2005.
Ó Cofaigh, C., Dowdeswell, J. A., Jennings, A. E., Hogan, K. A., Kilfeather, A., Hiemstra, J. F., Noormets, R., Evans, J., McCarthy, D. J., Andrews, J. T., Lloyd, J. M., and Moros, M.: An extensive and dynamic ice sheet on the West Greenland shelf during the last glacial cycle, Geology, 41, 219–222, 2013.
Ó Cofaigh, C., Hogan, K. A., Dowdeswell, J. A., and Streuff, K.: Stratified glacimarine basin-fills in West Greenland fjords, Geological Society, London, Memoirs, 46, 99–100, 2016.
O'Regan, M., Backman, J., Barrientos, N., Cronin, T. M., Gemery, L., Kirchner, N., Mayer, L. A., Nilsson, J., Noormets, R., Pearce, C., Semiletov, I., Stranne, C., and Jakobsson, M.: The De Long Trough: a newly discovered glacial trough on the East Siberian continental margin, Clim. Past, 13, 1269–1284, https://doi.org/10.5194/cp-13-1269-2017, 2017.
Ottesen, D. and Dowdeswell, J. A.: Assemblages of submarine landforms produced by tidewater glaciers in Svalbard, J. Geophys. Res.-Earth, 111, F01016, https://doi.org/10.1029/2005JF000330, 2006.
Overeem, I., Hudson, B. D., Syvitski, J. P. M., Mikkelsen, A. B., Hasholt, B., van den Broeke, M. R., Noël, B. P. Y., and Morlighem, M.: Substantial export of suspended sediment to the global oceans from glacial erosion in Greenland, Nat. Geosci., 10, 859–863, 2017.
Pollard, D., DeConto, R. M., and Alley, R. B.: Potential Antarctic Ice Sheet retreat driven by hydrofracturing and ice cliff failure, Earth Planet. Sc. Lett., 412, 112–121, 2015.
Powell, R. D.: Glacimarine processes and inductive lithofacies modelling of ice shelf and tidewater glacier sediments based on Quaternary examples, Mar. Geol., 57, 1–52, 1984.
Powell, R. D.: Subaquatic Landsystems: fjord, in: Glacial Landsystems, edited by: Evans, D. J. A., Hodder Arnold, London, UK, 2005.
Powell, R. D. and Domack, G. W.: 12 – Modern glacimarine environments, in: Modern and Past Glacial Environments, edited by: Menzies, J., Butterworth-Heinemann, Oxford, UK, 2002.
Powell, R. D., Anderson, J. B., and Ashley, G. M.: Grounding-line systems as second-order controls on fluctuations of tidewater termini of temperate glaciers, Glacial marine sedimentation: paleoclimatic significance, Geological Society of America, Special Paper Boulder, CO, USA, 261, 75–93, 1991.
Reilly, B. T., Stoner, J. S., and Wiest, J.: SedCT: MATLABTM tools for standardized and quantitative processing of sediment core computed tomography (CT) data collected using a medical CT scanner, Geochem. Geophy. Geosy., 18, 3231–3240, 2017.
Reilly, B. T., Stoner, J., Mix, A., Walczak, M. H., Jennings, A., Jakobsson, M., Dyke, L., Glueder, A., Nicholls, K. W., Hogan, K., Mayer, L. A., Hatfield, R., Fallon, S., and Cheseby, M.: Holocene Break-up and Reestablishment of the Petermann Ice Tongue, Northwest Greenland, Quaternary Sci. Rev., 218, 322–342, 2019.
Reimer, P. J., Bard, E., Bayliss, A., Beck, J. W., Blackwell, P. G., Ramsey, C. B., Buck, C. E., Cheng, H., Edwards, R. L., Friedrich, M., Grootes, P. M., Guilderson, T. P., Haflidason, H., Hajdas, I., Hatté, C., Heaton, T. J., Hoffmann, D. L., Hogg, A. G., Hughen, K. A., Kaiser, K. F., Kromer, B., Manning, S. W., Niu, M., Reimer, R. W., Richards, D. A., Scott, E. M., Southon, J. R., Staff, R. A., Turney, C. S. M., and van der Plicht, J.: IntCal13 and Marine13 Radiocarbon Age Calibration Curves 0–50 000 Years cal BP, Radiocarbon, 55, 1869–1887, 2013.
Rignot, E. and Kanagaratnam, P.: Changes in the Velocity Structure of the Greenland Ice Sheet, Science, 311, 986–990, 2006.
Rignot, E., Koppes, M. and Velicogna, I., Rapid submarine melting of the calving faces of West Greenland glaciers, Nat. Geosci., 3, 187–191, 2010.
Roberts, D. H. and Long, A. J.: Streamlined bedrock terrain and fast ice flow, Jakobshavns Isbræ, West Greenland: implications for ice stream and ice sheet dynamics, Boreas, 34, 25–42, 2005.
Roberts, D. H., Lloyd, J. M., O Cofaigh, C., Callard, S. L., Grobe, H., and Kappelsberger, M.: NEGIS: Understanding the mechanisms controlling the long-term stability of the Northeast Greenland Ice Stream, in: The Expedition PS100 of the Research Vessel POLARSTERN to the Fram Strait in 2016, edited by: Kanzow, T., Berichte zur Polar-und Meeresforschung: Reports on Polar and Marine Research, Alfred Wegener Institut, Bremerhaven, Germany, 2017.
Smith, A. M.: Basal conditions on Rutford Ice Stream, West Antarctica, from seismic observations, J. Geophys. Res.-Sol. Ea., 102, 543–552, 1997.
Smith, J. A., Graham, A. G., Post, A. L., Hillenbrand, C. D., Bart, P. J., and Powell, R. D.: The marine geological imprint of Antarctic ice shelves, Nat. Commun., 10, 5635, https://doi.org/10.1038/s41467-019-13496-5, 2019.
Smith, R. W., Bianchi, T. S., Allison, M., Savage, C., and Galy, V.: High rates of organic carbon burial in fjord sediments globally, Nat. Geosci., 8, 450–453, 2015.
Smith, W. H. F. and Wessel, P.: Gridding with continuous curvature splines in tension, Geophysics, 55, 293–305, 1990.
Stoker, M. S., Bradwell, T., Howe, J. A., Wilkinson, I. P., and McIntyre, K., Lateglacial ice-cap dynamics in NW Scotland: evidence from the fjords of the Summer Isles region, Quaternary Sci. Rev., 28, 3161–3184, 2009.
Straneo, F., Sutherland, D. A., Holland, D., Gladish, C., Hamilton, G. S., Johnson, H. L., Rignot, E., Xu, Y., and Koppes, M.: Characteristics of ocean waters reaching Greenland's glaciers, Ann. Glaciol., 53, 202–210, 2012.
Stravers, J. A. and Syvitski, J. P. M.: Land-Sea Correlations and Evolution of the Cambridge Fiord Marine Basin during the Last Deglaciation of Northern Baffin Island, Quaternary Res., 35, 72–90, 1991.
Streuff, K., Ó Cofaigh, C., Hogan, K., Jennings, A., Lloyd, J. M., Noormets, R., Nielsen, T., Kuijpers, A., Dowdeswell, J. A., and Weinrebe, W.: Seafloor geomorphology and glacimarine sedimentation associated with fast-flowing ice sheet outlet glaciers in Disko Bay, West Greenland, Quaternary Sci. Rev., 169, 206–230, 2017.
Stroeven, A. P., Fabel, D., Harbor, J., Hättestrand, C., and Kleman, J.: Reconstructing the erosion history of glaciated passive margins: applications of in situ produced cosmogenic nuclide techniques, Geological Society, London, Special Publications, 196, 153–168, https://doi.org/10.1144/GSL.SP.2002.196.01.10, 2002.
Sugden, D. E., Glasser, N., and Clapperton, C. M.: Evolution of Large Roches Moutonnées, Geogr. Ann. A, 74, 253–264, 1992.
Syvitski, J. P. M. and Shaw, J.: Sedimentology and Geomorphology of Fjords, Developments in Sedimentology, 53, 113–178, 1995.
Syvitski, J. P. M., Andrews, J. T., and Dowdeswell, J. A.: Sediment deposition in an iceberg-dominated glacimarine environment, East Greenland: basin fill implications, Global Planet. Change, 12, 251–270, 1996.
Tessensohn, F., Jackson, H. R., and Reid, I. D.: The tectonic evolution of Nares strait: implications of new data, Polarforschung, 2006, 191–198, 2006.
Tinto, K. J., Bell, R. E., Cochran, J. R., and Münchow, A.: Bathymetry in Petermann fjord from Operation IceBridge aerogravity, Earth Planet. Sc. Lett., 422, 58–66, 2015.
Tulaczyk, S., Kamb, B., Scherer, R. P., and Engelhardt, H. F.: Sedimentary processes at the base of a West Antarctic ice stream; constraints from textural and compositional properties of subglacial debris, J. Sediment. Res., 68, 487–496, 1998.
Uenzelmann-Neben, G., Jokat, W., and Vanneste, K.: Quaternary sediments in Scoresby Sund, East Greenland: their distribution as revealed by reflection seismic data, LUNDQUA Report, 33, 139–148, 1991.
Walter, F., Chaput, J., and Lüthi, M. P.: Thick sediments beneath Greenland's ablation zone and their potential role in future ice sheet dynamics, Geology, 42, 487–490, 2014.
Young, N. E. and Briner, J. P.: Holocene evolution of the western Greenland Ice Sheet: Assessing geophysical ice-sheet models with geological reconstructions of ice-margin change, Quaternary Sci. Rev., 114, 1–17, 2015.
Young, N. E., Briner, J. P., Rood, D. H., Finkel, R. C., Corbett, L. B., and Bierman, P. R.: Age of the Fjord Stade moraines in the Disko Bugt region, western Greenland, and the 9.3 and 8.2 ka cooling events, Quaternary Sci. Rev., 60, 76–90, 2013.
Yr.no: https://www.yr.no/place/Greenland/Other/Thule_Air_Base/, last access: 9 December 2019.