the Creative Commons Attribution 3.0 License.
the Creative Commons Attribution 3.0 License.
The Greater Caucasus Glacier Inventory (Russia, Georgia and Azerbaijan)
Roger D. Wheate
There have been numerous studies of glaciers in the Greater Caucasus, but none that have generated a modern glacier database across the whole mountain range. Here, we present an updated and expanded glacier inventory at three time periods (1960, 1986, 2014) covering the entire Greater Caucasus. Large-scale topographic maps and satellite imagery (Corona, Landsat 5, Landsat 8 and ASTER) were used to conduct a remote-sensing survey of glacier change, and the 30 m resolution Advanced Spaceborne Thermal Emission and Reflection Radiometer Global Digital Elevation Model (ASTER GDEM; 17 November 2011) was used to determine the aspect, slope and height distribution of glaciers. Glacier margins were mapped manually and reveal that in 1960 the mountains contained 2349 glaciers with a total glacier surface area of 1674.9 ± 70.4 km2. By 1986, glacier surface area had decreased to 1482.1 ± 64.4 km2 (2209 glaciers), and by 2014 to 1193.2 ± 54.0 km2 (2020 glaciers). This represents a 28.8 ± 4.4 % (481 ± 21.2 km2) or 0.53 % yr−1 reduction in total glacier surface area between 1960 and 2014 and an increase in the rate of area loss since 1986 (0.69 % yr−1) compared to 1960–1986 (0.44 % yr−1). Glacier mean size decreased from 0.70 km2 in 1960 to 0.66 km2 in 1986 and to 0.57 km2 in 2014. This new glacier inventory has been submitted to the Global Land Ice Measurements from Space (GLIMS) database and can be used as a basis data set for future studies.
- Article
(8663 KB) - Full-text XML
- Companion paper 1
- Companion paper 3
- Companion paper 4
-
Supplement
(1373 KB) - BibTeX
- EndNote


Glacier inventories provide the basis for further studies on mass balance and volume change, which are relevant to local- to regional-scale hydrological studies (Huss, 2012; Fischer et al., 2015) and to global calculation of sea level change (Gardner et al., 2013; Radic and Hock, 2014). In addition, glacier inventories are invaluable data sets for revealing the characteristics of glacier distribution and for upscaling measurements from selected locations to entire mountain ranges (Nagai et al., 2016).
In a high mountain system such as the Greater Caucasus, glaciers are an important source of water for agricultural production, and runoff supplies several hydroelectric power stations. Most rivers originate in the mountains, and the melting of glaciers/snow is an important component of the inputs in terms of water supply and for recreational opportunities (Tielidze, 2017). However, glacier hazards are relatively common in this region, leading to major loss of life. On 20 September 2002, for example, Kolka Glacier (North Ossetia) initiated a catastrophic ice-debris flow killing over 100 people (Evans et al., 2009), and on 17 May 2014 Devdoraki Glacier (Georgia) caused a rock–ice avalanche and glacial mudflow killing nine people (Tielidze, 2017). The Greater Caucasus glaciers also have economic importance as a major tourist attraction, e.g. Svaneti, Racha and Kazbegi regions in Georgia, with thousands of visitors each year (Georgian National Tourism Administration, 2017).
The Global Land Ice Measurements from Space (GLIMS) database (9 February 2017) for the Greater Caucasus identified in excess of 1295 glaciers with a combined area of 1111.8 km2 but with some inconsistent registration. The Randolph Glacier Inventory (RGI5) database identifies in excess of 1638 glaciers with a combined area of 1276.9 km2 and incorporates nominal glaciers as circles in the eastern and western Caucasus sections (i.e. no outline extents) from the World Glacier Inventory – Extended Format (WGI-XF; Cogley, 2009); these are omitted from the GLIMS database. As nobody volunteered to write a section about the glaciers in the Caucasus for the GLIMS book (Kargel et al., 2014), the region is missing in this compilation.
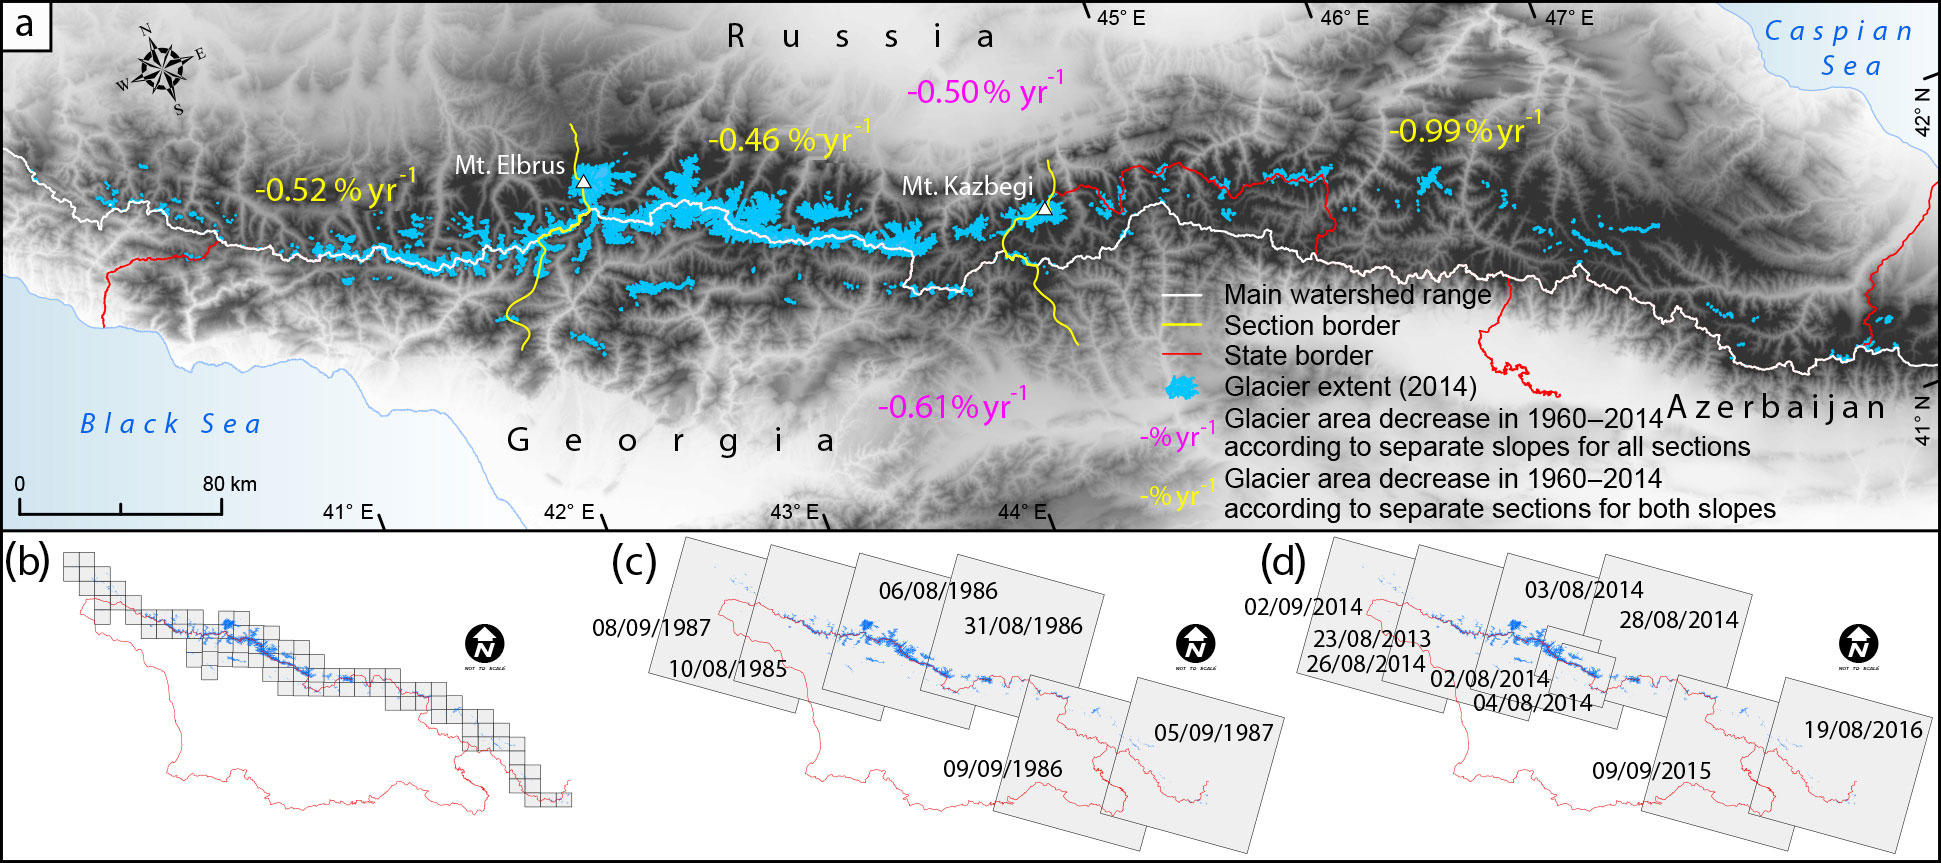
Figure 1(a) Distribution of the Greater Caucasus glaciers. (b) 1960s 1:50 000 scale map sheets (88) are based on aerial photographs, 1950–1960. (c) Six Landsat 5 TM satellite scenes, 1985–1987. (d) Seven Landsat 8 OLI satellite scenes from 2013 to 2016 and two (smaller) ASTER satellite scenes from 2014.
Thus, the objectives of this paper are to construct an updated glacier inventory for the Greater Caucasus region based on manual delineation of glaciers from multi-temporal satellite images and especially to fill the gap in the eastern Greater Caucasus.
The Caucasus mountains consist of two separate mountain systems: the Greater Caucasus (the higher and more extensive part) extends for ∼ 1300 km from northwest to southeast between the Black and Caspian seas, while the Lesser Caucasus, approximately 100 km to the south, is characterized by relatively lower elevations. The Greater and Lesser Caucasus are connected by the Likhi Range, which represents the watershed between the Black and Caspian seas.
The Greater Caucasus can be divided into western, central and eastern sections based on morphology divided by the mountains Elbrus (5642 m) and Kazbegi (5047 m) (Maruashvili, 1981) (Fig. 1). At the same time, the terms northern and southern Caucasus are frequently used to refer to the corresponding macroslopes of the Greater Caucasus Range (Solomina et al., 2016).
Glacier retreat started from the Little Ice Age (LIA) maximum positions in the northern Caucasus from the late 1840s, with minor re-advances in the 1860s–1880s and re-advances or steady states in the 20th century (1910s, 1920s and 1970s–1980s) (Solomina, et al., 2016).
In the Caucasus, supra-glacial debris cover has a smaller extent than in many glacierized regions, especially Asia (Stokes et al., 2007; Shahgedanova et al., 2014). Direct field monitoring reveals evident debris expansion for some glaciers (e.g. Djankuat) from 2 to 13 % between 1968 and 2010 (Popovnin et al., 2015). Glacier retreat appears to be associated with expansion of supra-glacial debris cover and ice-contact/proglacial lakes, which may increase the likelihood of glacier-related hazards and debris flows (Stokes et al., 2007). Debris cover is more common in the north than in the south (Lambrecht et al., 2011; Tielidze et al., 2017).
2.1 Previous studies
The study of glaciers in the Caucasus began in the first quarter of the 18th century, in the works of Georgian scientist Vakhushti Bagrationi (Tielidze, 2016); subsequently there were many early expeditions and glacier photographs covering the time period 1875–1906 (Solomina et al., 2016). Studies focused on glacier mapping began when Podozerskiy (1911) published the first inventory of the Greater Caucasus glaciers, based on large-scale military topographical maps (1:42 000) from 1881 to 1910, identifying 1329 glaciers, with a total area of 1967.4 km2 (Kotlyakov et al., 2015). Detailed analysis of these early data showed some defects in the depicted shape of the glaciers and in particular those in inaccessible valley glaciers (Tielidze, 2016). Reinhardt (1916, 1936) noted Podozerskiy's errors in compiling a new catalogue for some glacial basins of the Greater Caucasus region (Tielidze, 2017).
The next inventory of the Caucasus glaciers (Catalog of Glaciers of the USSR, 1967–1978) assessed glacier parameters from ∼ 1950–1960 aerial photographs. This includes some errors as temporary snowfields were misinterpreted as glaciers (Gobejishvili, 1995; Tielidze, 2016), and the catalogue data sets contained glacier parameters but not outlines. As the USSR catalogue and 1960s large-scale (1:50 000) topographic maps were based on the same aerial photographs, we have used both data sets in this article for a more comprehensive comparison.
Gobejishvili (1995) documented further statistical information about the glaciers of Georgia based on the same 1960s topographic maps, reporting there were 786 glaciers with a total area of 563.7 km2 in the Georgian Caucasus. The current investigation revealed that he missed some small glaciers, particularly in the Bzipi, Kodori, Rioni, Enguri and Tergi (Terek) river basins.
Khromova et al. (2009, 2014) used manually digitized results to estimate changes of more than 1200 glaciers in the Caucasus in two periods: 1911–1957 and 1957–2000. They found that glacier area decreased from 1911 to 1957 by 24.7 % (0.52 % yr−1) and from 1957 to 2000 by 17.7 % (0.41 % yr−1). Elbrus glaciers lost 14.8 % (0.31 % yr−1) and 6.3 % (0.14 % yr−1) respectively for the two time periods. However, there was a difference between north and south slopes of the Greater Caucasus. Glacier area change on the north slope was 30 % (0.63 % yr−1) for the first part of the 20th century and 17.9 % for the second part (0.41 % yr−1). In contrast, the south slope lost 12 % (0.25 % yr−1) and 28 % respectively (0.65 % yr−1), indicating a contrasting slowdown (increase) of the loss rate on the northern (southern) slopes.
Lur'e and Panov (2014) examined northern Caucasus glacier variation for 1895–2011, finding glacier area decreased by 849 km2 (52.6 %). During this period, the average rate of glacier area reduction was 0.45 % yr−1, varying from 0.52 % yr−1 in 1895–1970 to 0.32 % yr−1 in 1971–2011. The most significant decrease was registered in the basins of Dagestan rivers (eastern Greater Caucasus section); however, they did not describe the data sources for their glacier mapping.
The most recent glacier inventory, based on old topographic maps (1911/1960) and modern satellite imagery (Landsat/ASTER, 2014) was published by Tielidze (2016) but compiled only for Georgian Caucasus glaciers, which reduced from 613.6 ± 9.8 to 355.8 ± 8.3 km2 (0.37 % yr−1) between 1911 and 2014, while glacier numbers increased from 515 to 637. The current investigation has revealed that some small glaciers were omitted as Tielidze used Gobejishvili's (1995) glacier database.
Other recent published works about the Greater Caucasus have mainly examined changes in glacier area and length for individual river basins or separate sections. Stokes et al. (2006, 2007) determined that 94 % of 113 selected glaciers in the central Greater Caucasus retreated between 1985 and 2000; the largest glaciers (> 10 km2) had retreated at twice the rate (∼ 12 m yr−1) of the smallest (< 1 km2) glaciers (∼ 6 m yr−1). Shahgedanova et al. (2014) calculated 4.7 ± 2.1 % or 0.20 % yr−1 glacier area loss from 407.3 ± 5.4 to 388.1 ± 5.2 km2 in the central and western Greater Caucasus between 1987 and 2010.
In this article, we present the percentage and quantitative changes in the number and area of glaciers for the whole Greater Caucasus in the years 1960, 1986 and 2014, including analyses of various glacier attributes (aspect, slope) and location.
3.1 Data sources
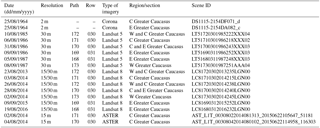
We utilize increasingly accessible global satellite imagery (Wulder et al., 2012, 2016; Pope et al., 2014) to investigate glacier area and number change in the Greater Caucasus in the periods 1960–1986, 1986–2014 and 1960–2014. Changes in glacier extent in the Greater Caucasus between 1986 and 2014 were determined through analysis of images from the Landsat 5 Thematic Mapper (TM), Landsat 8 Operational Land Imager (OLI) and Advanced Spaceborne Thermal Emission and Reflection Radiometer (ASTER) (Table 1). Georeferenced images were downloaded using the EarthExplorer (http://earthexplorer.usgs.gov/) and Reverb/ECHO tools (http://reverb.echo.nasa.gov/).
We used the Landsat 8 panchromatic band, along with a colour composite scene for each acquisition date, combining shortwave infrared, near infrared and red for Landsat, and near-infrared, red and green for ASTER images. These false-colour composite images can accurately show many glacier termini where meltwater streams are displayed in bright blue and contrast with the snout, which casts an obvious shadow (Stokes at al., 2006). This contrast remains apparent even with significant glacier retreat.
All images were acquired at the end of the ablation season, ranging from 2 August to 9 September, when glaciers were mostly free of seasonal snow under cloud-free conditions, but with some glacier margins obscured by shadows from rock faces and glacier cirque walls. In total, six Landsat 5 (TM) scenes were used for 1985–1987, with seven Landsat 8 (OLI) scenes for 2013–2016 and two ASTER scenes used for 2014 (Fig. 1c, d; Table 1). The latter were used primarily to complete coverage from isolated cloud cover in the Landsat scenes.
Large-scale topographic maps (88 sheets, 1:50 000 scale) with a contour interval of 20 m from several hundred aerial photographs taken between 1950 and 1960 were used to evaluate glacier outlines (Fig. 1b). Corona images dating from 1964 were obtained from the EarthExplorer website (http://earthexplorer.usgs.gov/), and two were georectified for comparison with map extents. As the maps were only available in printed form, we scanned at 300 dpi with 5 m ground resolution and with the Corona imagery co-registered using the 3 August 2014 Landsat image as a master (Tielidze, 2016). Offsets between the images and the Corona/archival maps were within one pixel (15 m) based on an analysis of common features identifiable in each data set. We reprojected Corona imagery and maps in Universal Transverse Mercator (UTM) coordinates, zones 37/38N on the WGS84 ellipsoid, to facilitate comparison with modern image data sets (ArcGIS 10.2.1). Together with Landsat imagery, these older topographic maps and Corona imagery enabled us to identify changes in the number and area of glaciers over the last half century.
The 30 m resolution ASTER Global Digital Elevation Model (GDEM, 17 November 2011) was used to determine the aspect, slope and height distribution of glaciers, downloaded from NASA LP DAAC Collections (http://earthexplorer.usgs.gov/).
We detected the glacier length by measurement of changes in the central flow line (Paul and Svoboda, 2009). This method uses the maximum length along the central flow line in different years, input that is required for glacier inventories.
3.2 Glacier uncertainty and accuracy assessment
We have determined uncertainty with two independent methods (buffer and multiple digitization). We used a buffer method similar to Granshaw and Fountain (2006) and Bolch et al. (2010) and adopted by Tielidze (2016). The uncertainty term for the 1960 extents is based on a buffer incorporating the root-mean-square error (RMSEx,y) of the map rectification (15 m) and the digitizing uncertainty equal to the width of a contour line (15 m).
Uncertainty is introduced by the resolution of the satellite image in terms of what can be seen and by the contrast between the glacier and adjacent terrain (Stokes et al., 2013). For debris-free glacier ice that is not obscured by clouds, DeBeer and Sharp (2007) suggested that line placement uncertainty is unlikely to be larger than the resolution of the imagery, i.e. ±30 m for Landsat 5 TM and Landsat 8 OLI. This can be seen in Fig. 2, along with a ±1- or 2-pixel buffer for debris-covered ice. A buffer with a width of one RMSE was created along the glacier outlines, and the uncertainty term was calculated as an average ratio between the original glacier areas and the areas with a buffer increment; for the 1986 images we used a buffer equal to the resolution of the data (30 m) and a similar buffer for the 2014 glacier extents. This generated an average uncertainty of the mapped glacier area of 4.6 % for 2014, 4.4 % for 1986 and 4.2 % for 1960. Using the buffer method from Granshaw and Fountain (2006), these yield a total potential overall error of ±4.4 %.
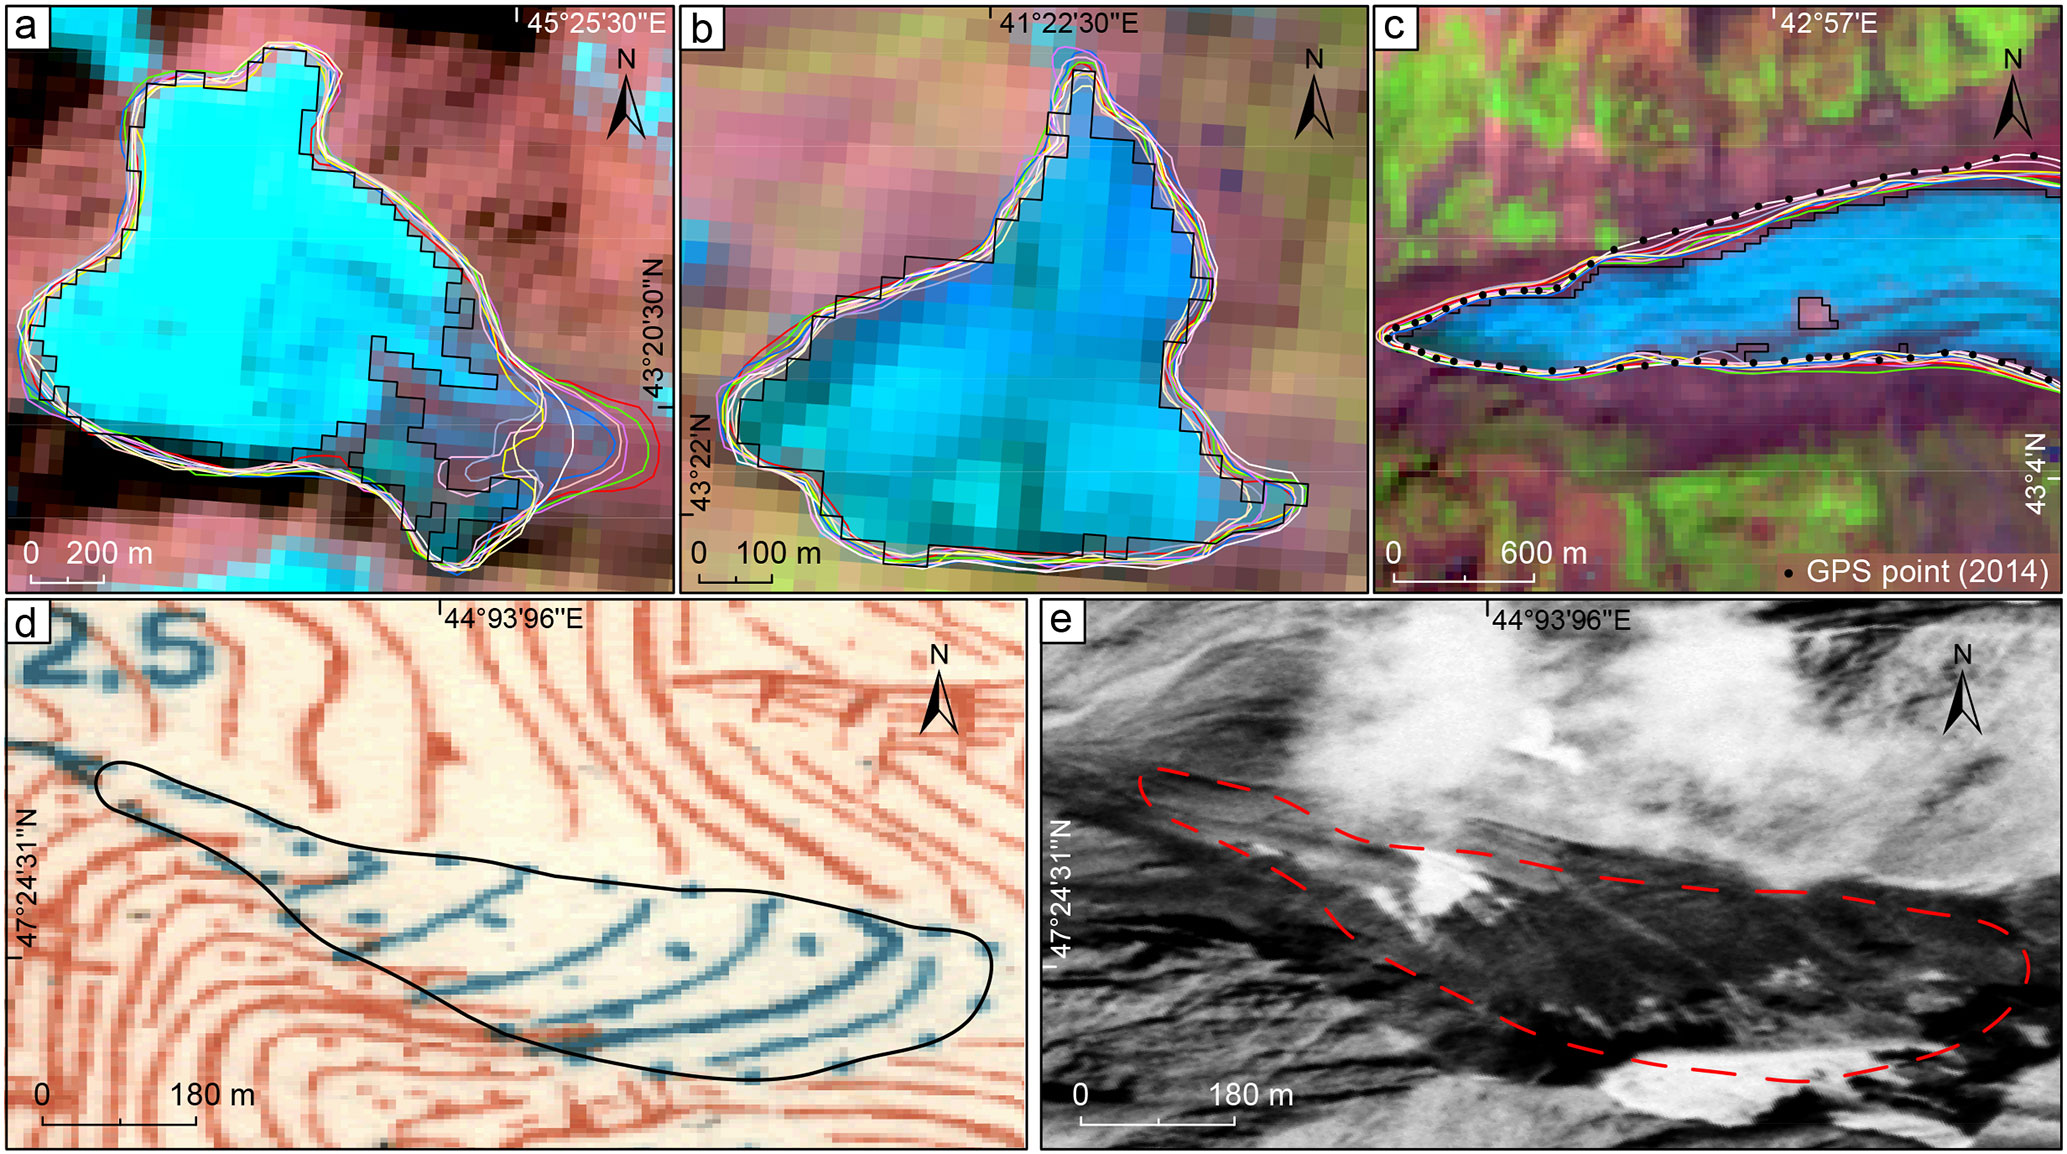
Figure 2(a–c) Examples from the multiple digitizations of glaciers (bands 654 as RGB) using the OLI scene performed by different analysts (coloured lines). Black outlines refer to the automatically derived extents (4∕6 ratio); pixel size is 30 m. (d) Error in the 1960 map included mapped snow for small cirque type glacier; (e) 1964 Corona imagery of the same place.
For 1986 and 2014 imagery we digitized the outlines of both debris-covered and debris-free ice and tested a number of well-known semi-automated techniques (band ratio TM3 / TM5 and OLI4 / OLI6, ratio thresholds range ≥ 2.0) (Paul and Kaab, 2005; Andreassen et al., 2008; Bolch et al., 2010) to extract glacier outlines and compare with manually generated outlines (Fig. 2).
Generally, for debris-free glaciers, automated delineation using the spectral ratio is more consistent and reproducible than manual delineation. These techniques are relatively useful for large sample sizes and/or large glaciers where manual delineation would be time-consuming (e.g. central Greater Caucasus), but their value can be limited by areas of glacier with supra-glacial debris (e.g. western and eastern Greater Caucasus) (Paul et al., 2013).
Following Paul et al. (2013) to determine the precision of the digitizing, we manually digitized 15 differently sized glaciers independently five times in the western, central and eastern Greater Caucasus to estimate 1986 and 2014 glacier area error. For debris-covered glaciers (Fig. 2a), the normalized standard deviation (NSD – based on delineations by multiple digitalization divided by the mean glacier area for all outlines) was 6.9 %, and the difference between the manually and automatically derived area was 13.41 %. For debris-free glaciers (Fig. 2b, c) the NSD was 5.7 %, and the difference between the manually and automatically derived area was 4.9 %.
To estimate 1960s glacier area error, we digitized multiple (3) times three different size glaciers (< 2, 2–5, > 5 km2) in the central and eastern Greater Caucasus using topographic maps and two Corona images (Fig. 3a–c). For 1960 topographic map glaciers, NSD was 0.4 %, and for Corona it was 5.9 %. Between the maps and Corona imagery NSD was 4.8 %.
Importantly, debris cover is not continuous on the snouts of many glaciers in the Greater Caucasus and most glaciers of Mt. Elbrus (Shahgedanova et al., 2014; Tielidze et al., 2017), but there are some glaciers covered by heavy debris. One of the most debris-covered we digitized in the Caucasus is Shkhelda Glacier (8.28 ± 0.65 km2) (43∘10′ N, 42∘38′ E), where supra-glacial debris covers approximately 35 % (Fig. 3d). To account for the error term due to debris cover, and following Frey et al. (2012), we increased the buffer size to two pixels (30 m), and error of mapping was calculated as ±7.9 %, which is the largest error in our database. In addition, for more accurate assessment we used GPS (GARMIN GPSMAP 62stc) measurement data from 2011 to 2016 for some glaciers (Figs. 2c, 3d), where GPS readings were assumed to be within one-half pixel of true coordinates.
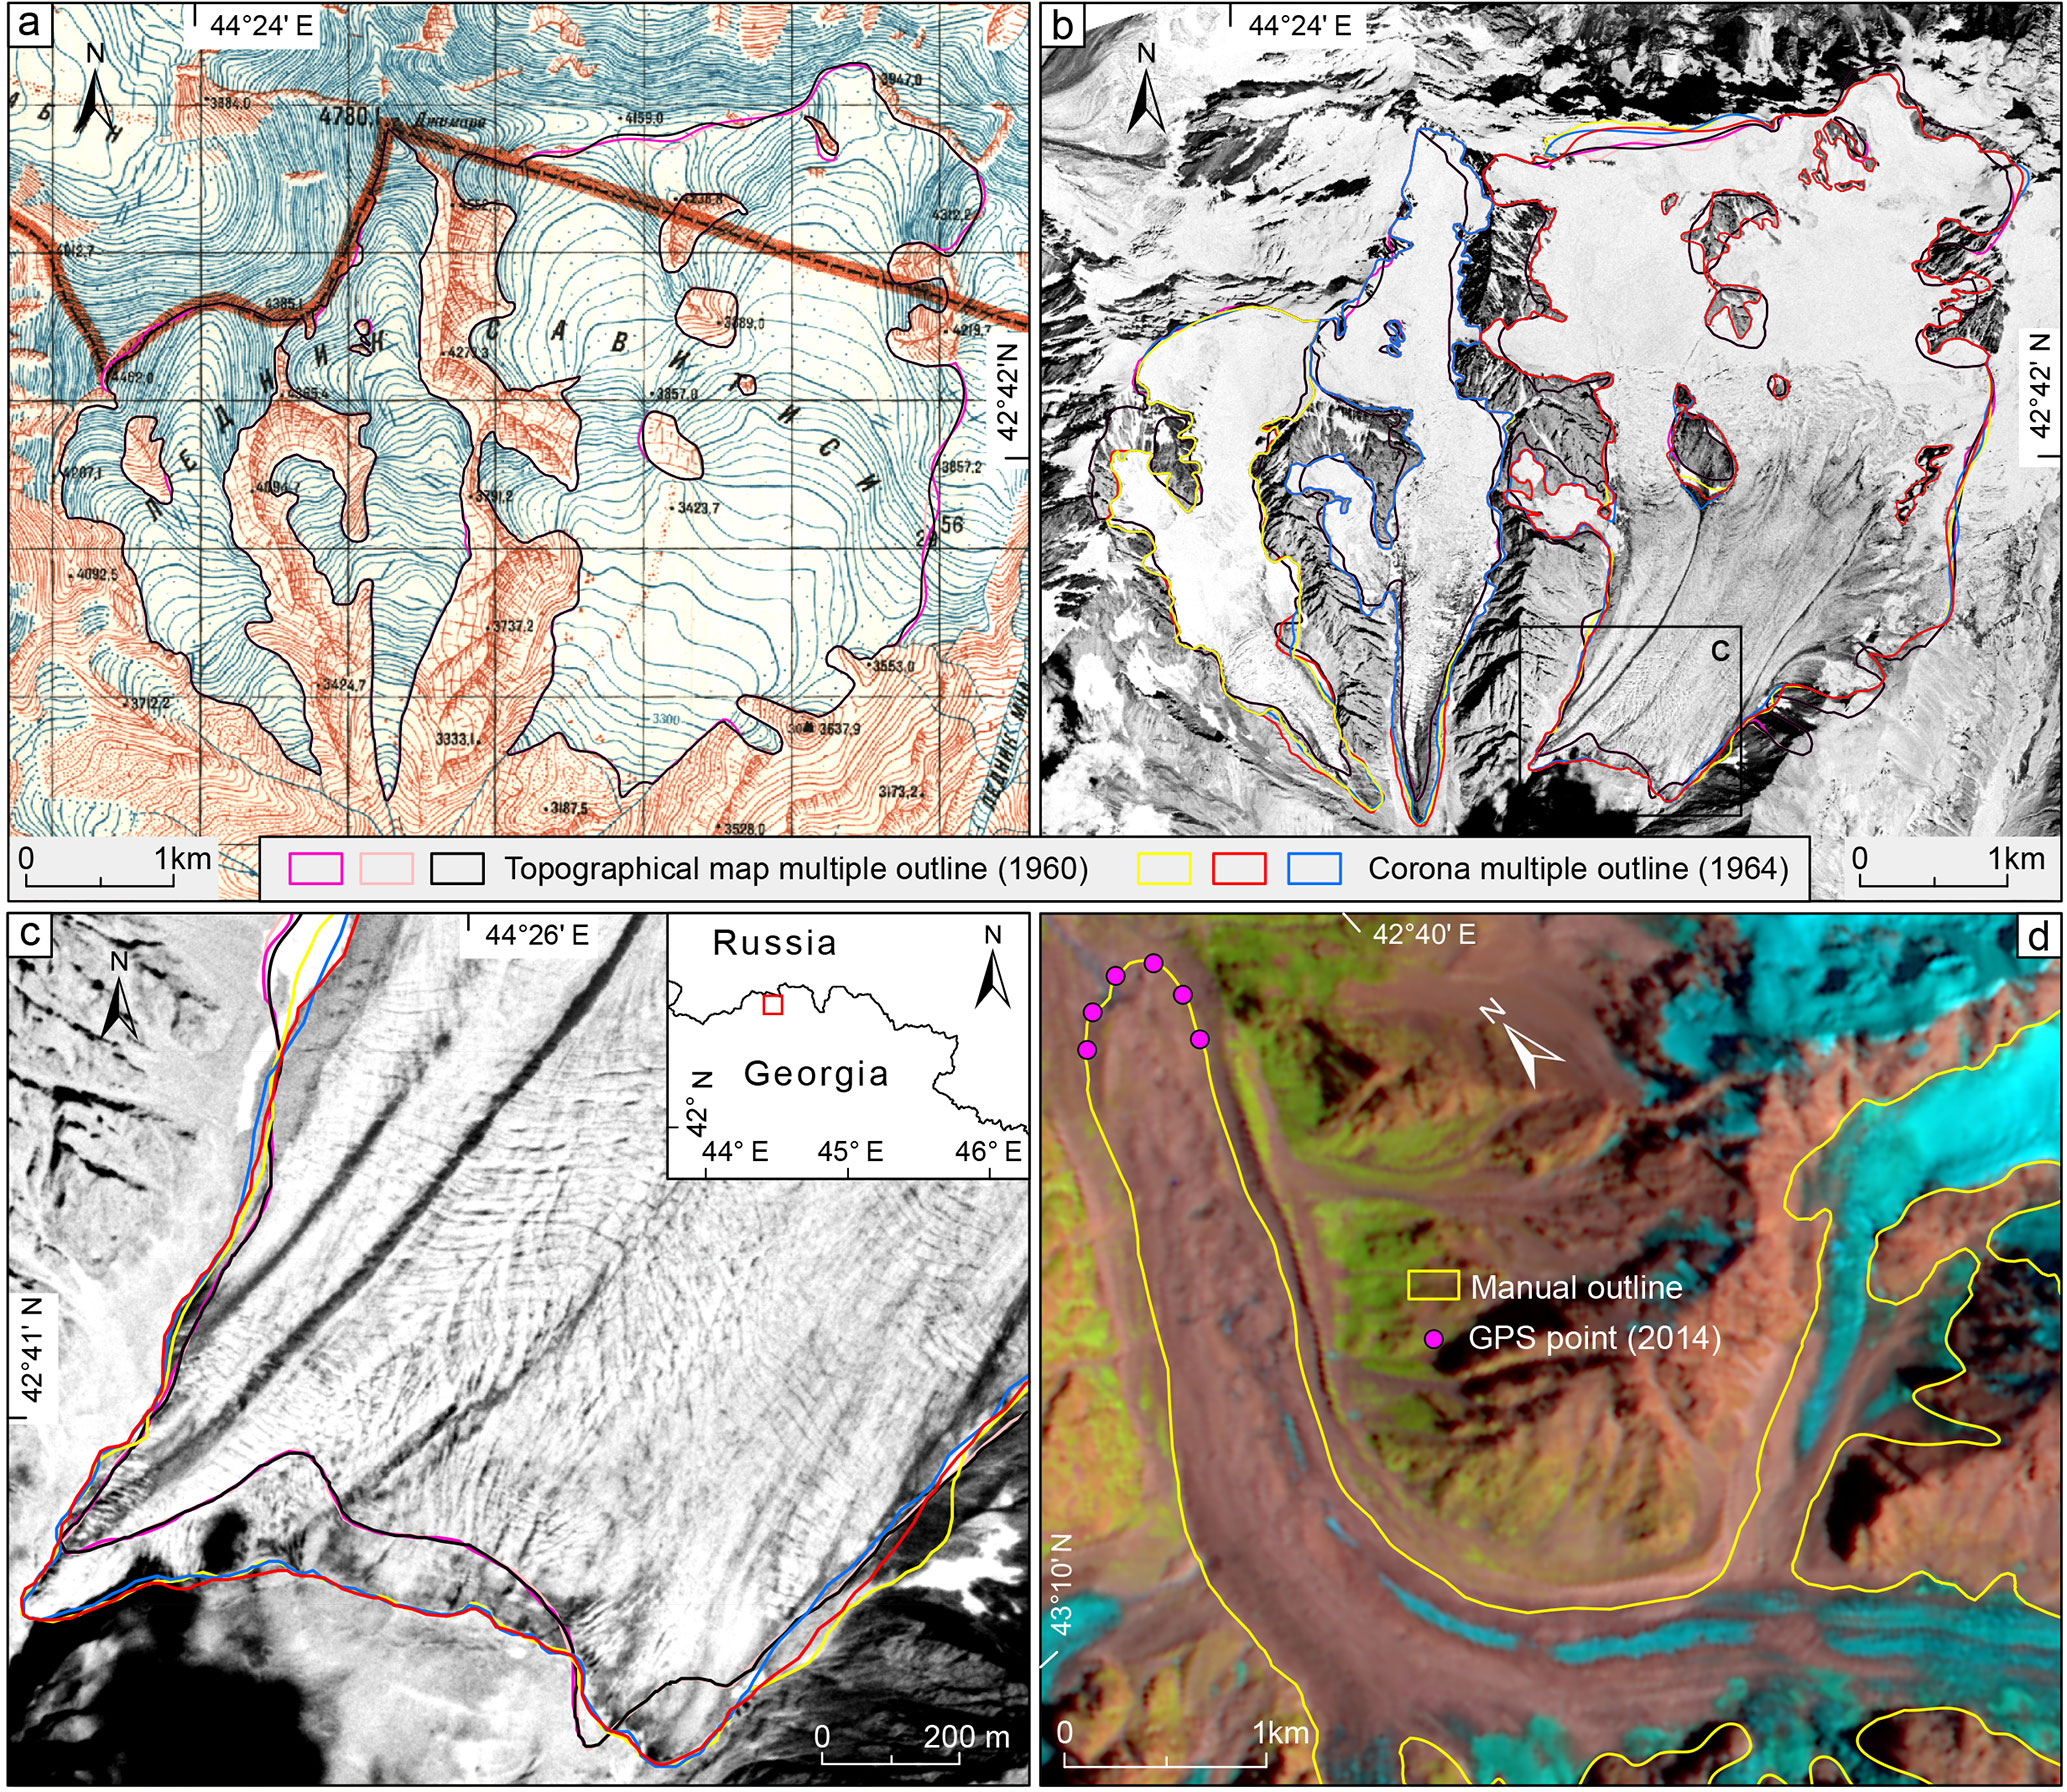
Figure 3(a–c) Examples from the multiple digitizations of glaciers using the 1960s topographic map and 1964 Corona imagery performed by different analysts (coloured lines). (d) Shkhelda Glacier, one of the heavily debris-covered glaciers in the Greater Caucasus. The 23 August 2014 Landsat 8 image (Table 1) is used as the background.
4.1 Glacier changes for the entire study region
The total ice area loss between 1960 and 1986 was 192.8 ± 8.4 km2 or 11.5 ± 4.4 % (0.44 % yr−1), while the number of glaciers reduced from 2349 to 2209. Between 1986 and 2014, glacier area decreased by 288.9 ± 12.8 km2 or 19.5 ± 4.6 % (0.69 % yr−1), and glacier numbers from 2209 to 2020.
Glaciers in the northern Greater Caucasus lost 131.0 ± 5.8 km2 or 11.0 ± 4.2 % of their area (0.42 % yr−1) between 1960 and 1986, while the number of glaciers reduced from 1622 to 1523. Between 1986 and 2014, glacier area decreased by 189.7 ± 8.4 km2 or 18.0 ± 4.4 % (0.64 % yr−1), while the number of glaciers reduced from 1523 to 1391. Glacier mean size decreased from 0.73 to 0.69 to 0.62 km2 in the northern Greater Caucasus in 1960, 1986 and 2014 respectively.
On the southern macroslope, glacier area decreased by 61.8 ± 3.4 km2 or 12.7 ± 5.4 % (0.48 % yr−1) between 1960 and 1986, while the number of glaciers reduced from 727 to 686. Between 1986 and 2014, glacier area decreased by 99.2 ± 4.6 km2 or 23.3 ± 4.6 % (0.83 % yr−1), while the number of glaciers reduced from 686 to 629. Glacier mean size decreased from 0.67 to 0.62 to 0.52 km2 in 1960, 1986 and 2014 respectively.
Overall, the differences between the two macroslopes were small. The greater loss was observed on the southern slope, where glaciers lost 33.0 ± 5.0 % (0.61 % yr−1) over the last half century, while the northern-slope glaciers lost 27.0 ± 4.2 % (0.50 % yr−1) (Table 2; Fig. 4).
The eastern Greater Caucasus section (Aragvi; Tergi (Terek) headwaters; Sunja right (southeast) tributaries – Sulak, Samur, Agrichai and Kusarchai) experienced the highest relative glacier area loss, where the total ice area loss between 1960 and 2014 was 53.3 ± 4.4 % (0.98 % yr−1) or 100.5 ± 4.4 km2 (Table 2; Fig. 4). Glacier area and number change by individual river basins and countries are given in the Supplement (Tables S1, S2).
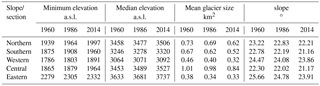
Glacier mean elevation for the northern macroslope changed from 3458 to 3477 to 3506 m a.s.l. in 1960, 1986 and 2014 respectively, and minimum elevation changed from 1939 to 1964 to 1997 m a.s.l. For the southern macroslope, mean elevation changed from 3246 to 3278 to 3320 m a.s.l. and minimum from 1875 to 1908 to 1960 m a.s.l. in the same time period. Detailed glacier parameter changes according to different slopes and sections are shown in Table 3.
4.2 Glacier changes on the Elbrus and Kazbegi-Jimara massifs
Glaciers located on Mt. Elbrus lost 9.9 ± 0.2 km2 or 7.3 ± 2.2 % (0.28 % yr−1) of their combined area between 1960 and 1986 and the same amount from 1986 to 2014. Overall, the relative loss was 14.7 ± 2.4 % (0.27 % yr−1) between 1960 and 2014.
Table 2The Greater Caucasus glacier number and area change according to the different slopes and sections in 1960–1986, 1986–2014 and 1960–2014.
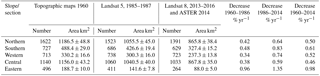
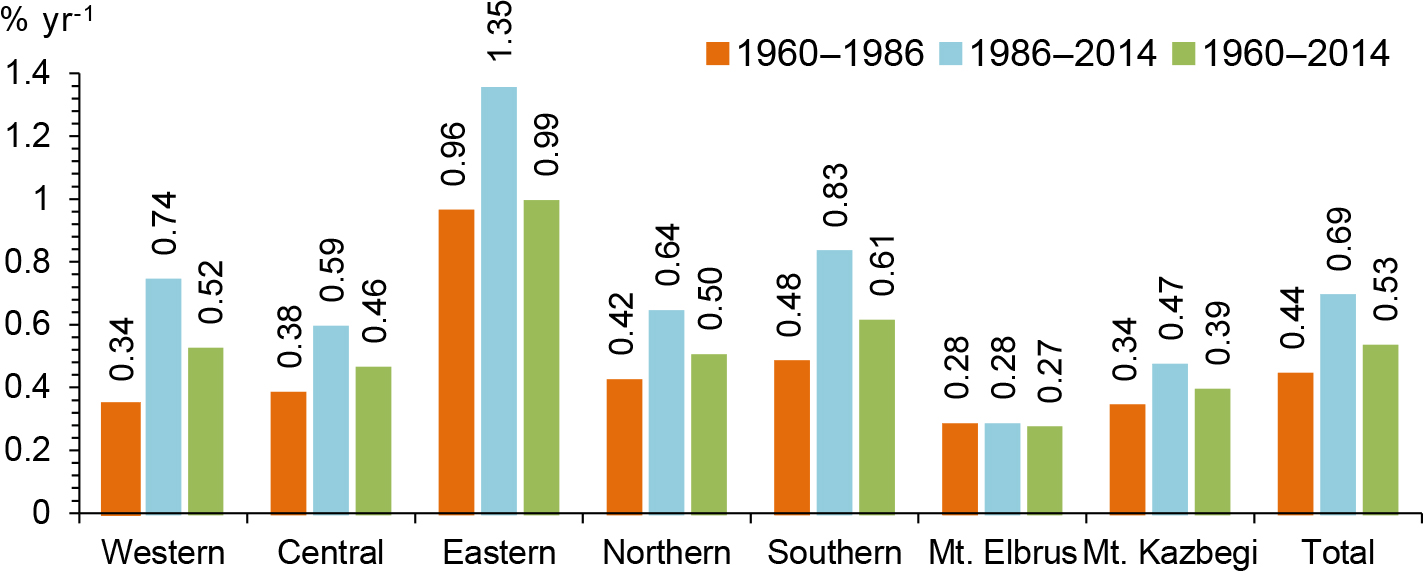
Figure 4Greater Caucasus glacier area decrease by slopes, sections and mountain massifs in 1960–1986, 1986–2014 and 1960–2014.
Among the large glaciers (> 10 km2), Dzhikiugankez Glacier experienced a high rate of reduction, as the most extensive glacier on the Elbrus massif; the relative loss was 27.2 ± 1.2 % (0.50 % yr−1) between 1960 and 2014. The important relative losses for Dzhikiugankez Glacier can be explained by the role of post-volcanic activity, especially the influence of thermal and fluid flows in the northeastern part of the Elbrus volcano (Masurenkov and Sobisevich, 2012; Holobâcă, 2016).
Table 3Topographic parameters for glaciers in 1960, 1986 and 2014.
Unlike the Elbrus, the size of the change varied dramatically from glacier to glacier on the Kazbegi-Jimara massif. The total ice area loss between 1960 and 1986 was 6.1 ± 0.2 km2 or 9.0 ± 4.0 % (0.34 % yr−1). From 1986 to 2014 glacier area decreased by 8.3 ± 0.4 km2 or 13.4 ± 4.4 % (0.47 % yr−1). Overall, the relative loss was 21.2 ± 4.4 % (0.39 % yr−1) between 1960 and 2014 (Fig. 4).
Among glaciers with an area of 2–5 km2, Devdoraki Glacier experienced a high rate of reduction between 1960 and 2014, with a relative loss of 38.8 ± 2.8 % (1.4 % yr−1). We do not include Kolka Glacier in a statistical analysis, as it was almost removed by its strong rock–ice avalanche in 2002 (Haeberli et al., 2004; Huggel et al., 2005; Petrakov et al., 2008). Area and number change of Elbrus and Kazbegi-Jimara glaciers are given in the Supplement (Tables S3–4; Figs. S1–2).
4.3 Glacier characteristics
The greatest area is occupied by glaciers in the size class 1.0–5.0 km2 across all three time periods. (Fig. 5; in Table S5). The largest glaciers are located in the central Greater Caucasus, where valley glaciers have individual areas of 5–37 km2. The total area of glaciers in the central section is more than triple that in the western Greater Caucasus, which in turn is almost triple the glacier area in the eastern section, even though the eastern section is higher than the western (Table 3). For 1960 there were 22 glaciers with individual area > 10 km2, and for 2014 there were just 13 in the central Greater Caucasus. There are no glaciers of > 10 km2 area in the eastern and western Greater Caucasus.

Figure 5Cumulative glacier area and number values for seven size classes in the Greater Caucasus in 1960, 1986 and 2014.
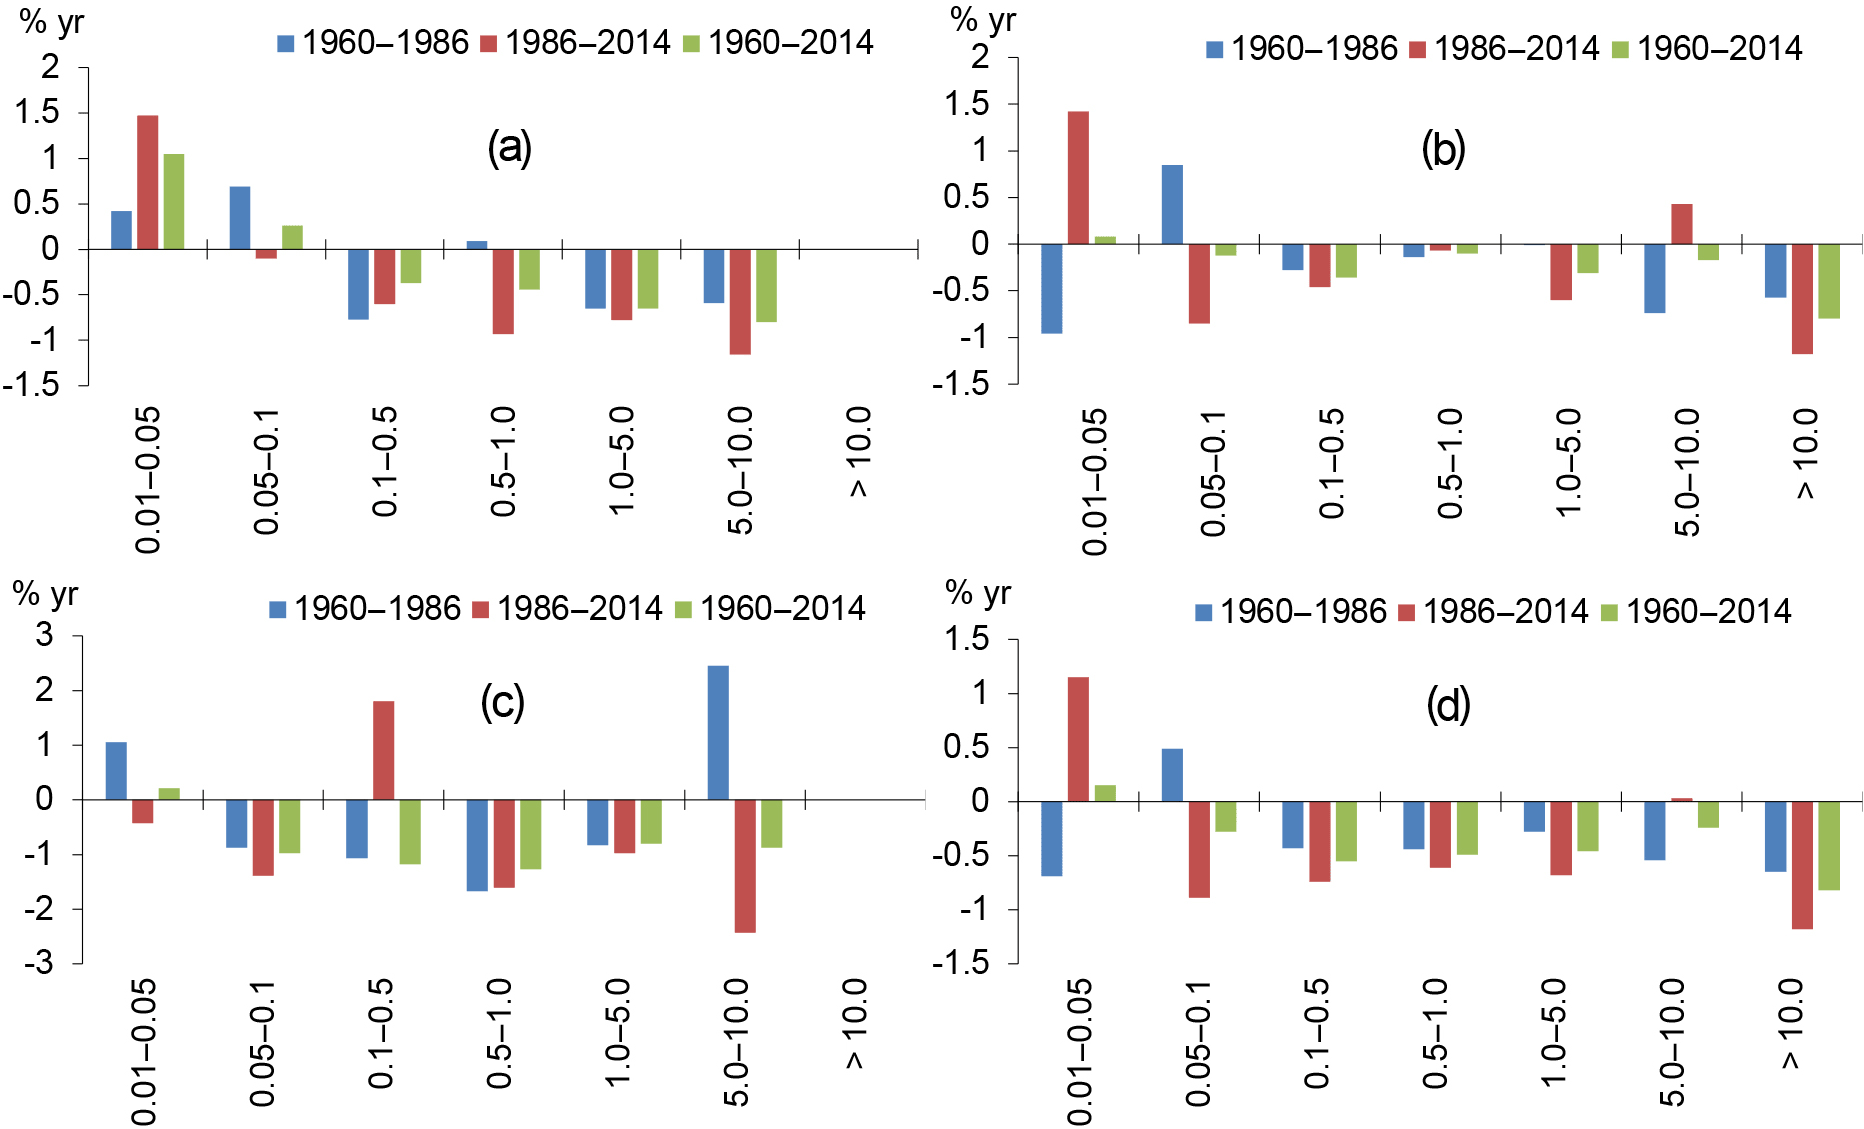
Figure 6Area change for the seven glacier size classes in the (a) western, (b) central and (c) eastern sections and in (d) the entire Greater Caucasus in 1960–1986, 1986–2014 and 1960–2014.

Figure 7(a) Distribution of glacier area with elevation for northern, southern and both slopes in the Greater Caucasus. (b) Scatter plot showing glacier size vs. minimum and maximum elevation.
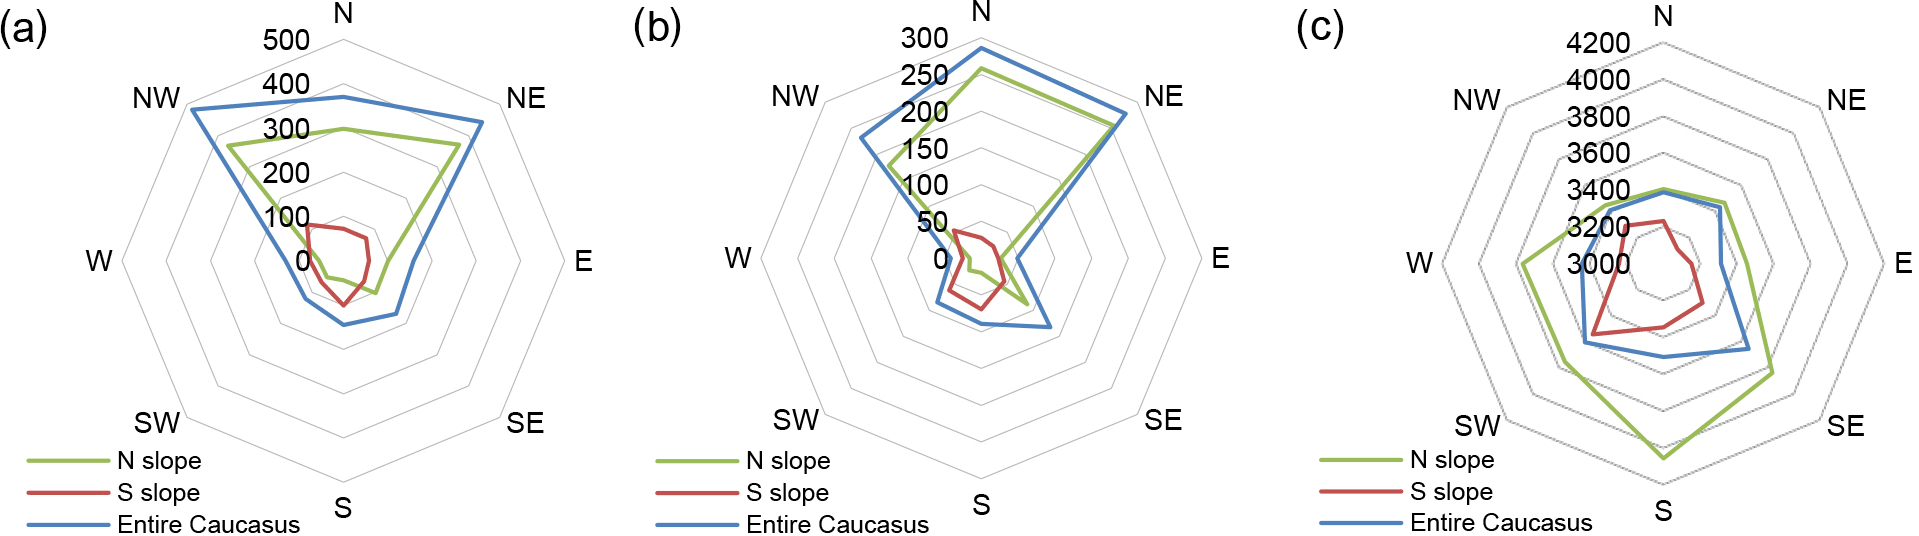
Figure 8Proportion of glacier aspect by (a) number, (b) area (km2) and (c) aspect vs. mean elevation (a.s.l.).

Figure 9Greater Caucasus, mean slope vs. glacier area for northern and southern macroslopes.
During the 1986–2014 period the number of smallest glaciers (0.01–0.05 km2) increased in the western and central Greater Caucasus (1.15 % yr+1) at the expense of relatively larger glaciers. Glacier area change by individual sections are shown in Fig. 6a–c and in Table S6.
Glacier area reduction varies between the individual sections of the Greater Caucasus, with the highest increase in the number of glaciers in the smallest category (< 0.05 km2) in the western section, resulting from the disintegration of larger glaciers. Glaciers of 0.1–10.0 km2 showed the smallest decrease in the central Greater Caucasus, with the largest in the eastern Greater Caucasus. The largest glaciers with > 10 km2 area, all located in the central Greater Caucasus, showed the greatest overall loss (0.82 % yr−1) (Fig. 6d). The Greater Caucasus cumulative glacier area and number values by individual sections and slopes for seven glacier size classes in 1960, 1986 and 2014 are given in the Supplement (Figs. S3–S12).
Most of the glacier area in the Greater Caucasus occurs between 3000 and 4000 m a.s.l. (857.6 km2), and glaciers in the northern and southern slopes are distributed mainly in the same altitudinal range. The valley glacier terminus positions are between 1900 and 3200 m., whereas cirque and hanging glaciers are at higher elevations, between 2800 and 4500 m. The distribution of glacier area with elevation is depicted in Fig. 7a–b.
Glaciers with north, northeast and northwest aspects are the most extensive in the Greater Caucasus, covering 286.0 ± 12.2 km2 (370 glaciers), 277.7 ± 12.0 km2 (443 glaciers) and 231.6 ± 11.8 km2 (483 glaciers) respectively, and together accounting for 66.7 % of all glaciers (Fig. 8a, b). The south, southeast and southwest aspects cover 89.4 ± 3.8 km2 (145 glaciers), 132.7 ± 4.8 km2 (169 glaciers) and 85.0 ± 3.4 km2 (121 glaciers) respectively, and together account for 25.7 % of all glaciers. The southern macroslope of the greater Caucasus is relatively shorter than the northern one, providing more favourable conditions for the existence of large-size glaciers in the north.
Glaciers with south aspects located on the northern slope are the most elevated in the Greater Caucasus. For the southern slope, southwest aspects are more elevated; for the entire mountain range, southeast aspects are more elevated (Fig. 8c).
The slopes with 10–15∘ gradient are most common for both northern and southern Greater Caucasus glaciers (Fig. 9).
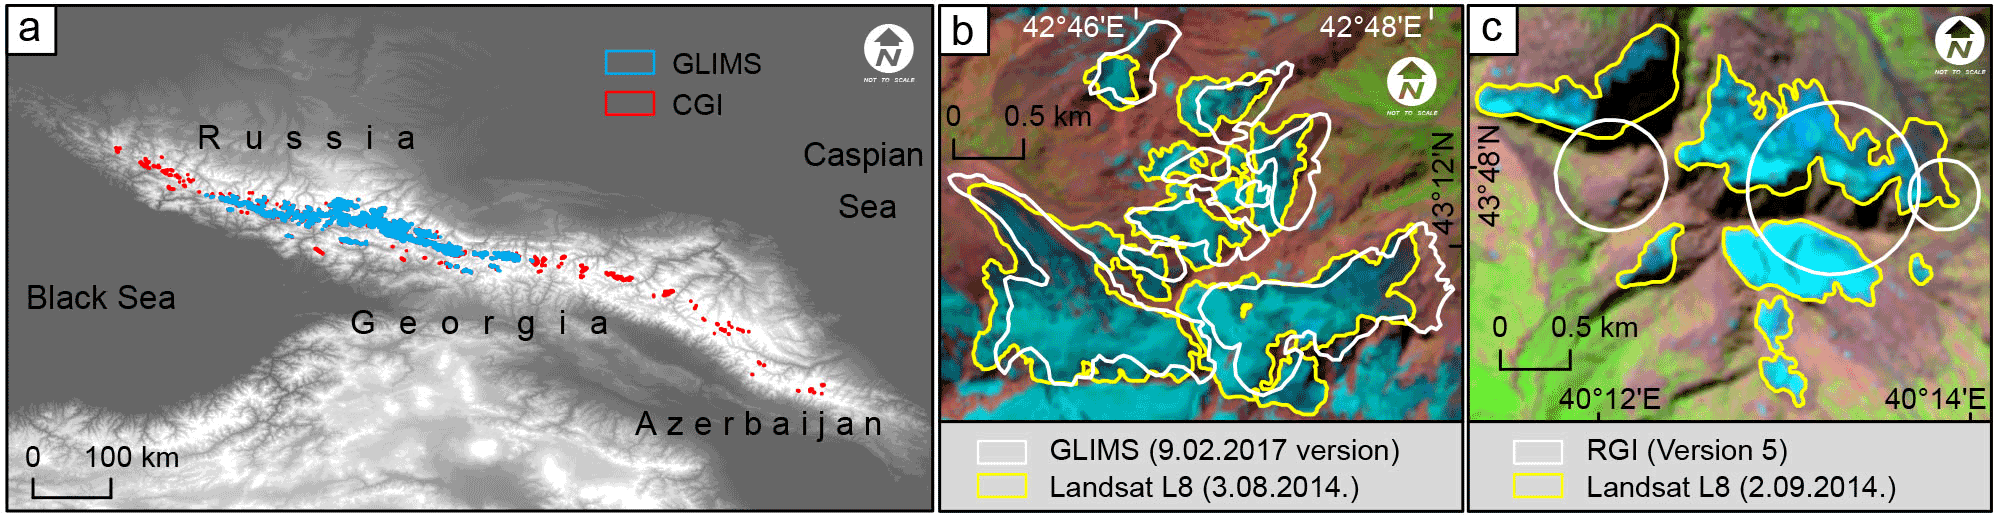
Figure 10(a) Comparison of the GLIMS with the new Caucasus Glacier Inventory (CGI). (b) The GLIMS outlines an example of inconsistent registration. (c) Glacier outlines from 2014, showing the RGI nominal glaciers (circles).
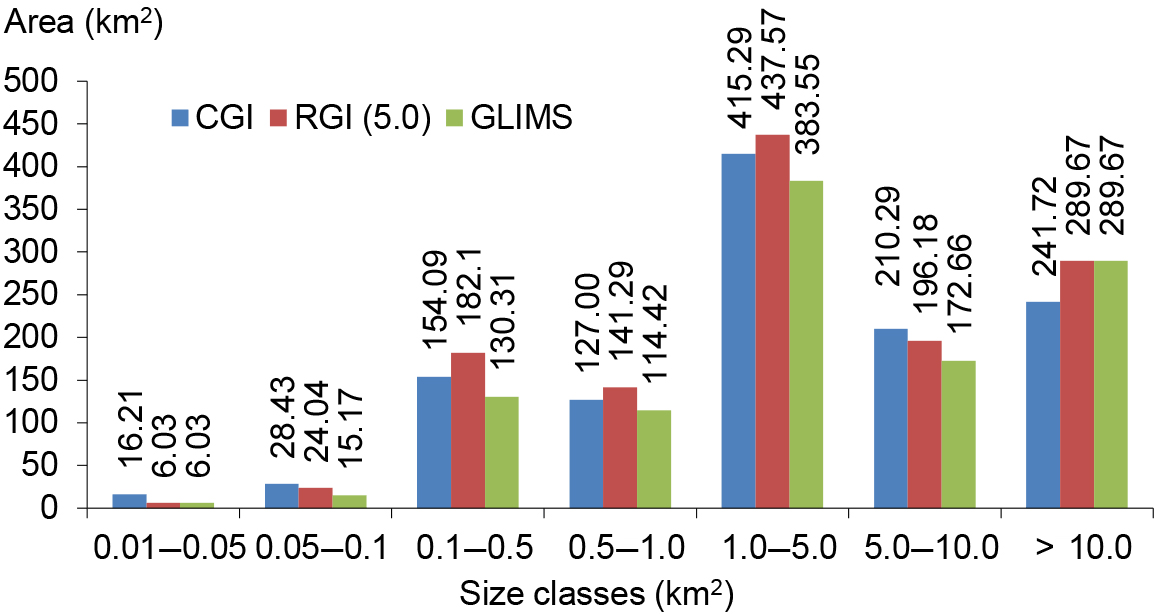
Figure 11Glacier area comparison for seven glacier classes in the Greater Caucasus according to the RGI (5), GLIMS and new Caucasus Glacier Inventory (CGI).
4.4 Glacier length change
We chose 30 glaciers in four size classes (< 1, 1–5, 5–10, > 10 km2) in the western, central and eastern Greater Caucasus macroslopes for sampling retreat rates. Across the region, retreat rates mostly increased from the 1960–1986 period to 1986–2014. The highest retreat rates of 48.8 m yr−1 were observed on the Karaugom Glacier northern macroslope in 1986–2014, while Shkhelda Glacier experienced double the retreat rate in 1960–1986 (36.5 m yr−1) as compared to 1986–2014 (17.1 m yr−1). The greatest total retreat was exhibited by Lekhziri Glacier, the largest glacier on the southern macroslope, retreating 1595 m at an average rate of 29.5 m yr−1 in 1960–2014.
Of the 30 glaciers measured, 29 retreated between 1986 and 2014. Thirteen glaciers showed less change in 1986–2014 than in 1960–1986, and one glacier (Mizhirgi) advanced. These results correlate well with detailed field measurement of the snout position of Chalaati Glacier (Gobejishvili, 1995; Gobejishvili et al., 2012) and are in agreement with sporadic field measurement and anecdotal evidence from other glaciers (e.g. field investigation confirms that Mizhirgi Glacier advanced between 1985 and 2000). The overall advance of Mizhirgi Glacier between 1985 and 2000 was around 110 ± 25 m (Stokes et al., 2006). Microstadial moraines in front of Chalaati Glacier confirm ∼ 20 m glacier advance during 1990–1993 (Gobejishvili, 1995; Gobejishvili et al., 2012), but there is no clear geographical template which characterizes the advancing glaciers.
Overall, the largest glaciers (> 10 km2) on average retreated ∼ 21.2 m yr−1 between 1960 and 2014; glaciers with an area of 5–10 km2 retreated ∼ 15.6 m yr−1; glaciers with an area of 1–5 km2 retreated ∼ 12.0 m yr−1; and glaciers < 1 km2 retreated ∼ 7.8 m yr−1.
According to this current inventory, Bezingi Glacier represents the largest single glacier (37.47 ± 0.94 km2) in the Greater Caucasus. Characteristics of glaciers used for measuring length change are given in the Supplement (Table S7; Figs. S13, S14).
5.1 Glacier inventory parameters
Considering some errors in the 1911 catalogue (Tielidze, 2016), we calculate that glacier area decreased from 1967.4 km2 in 1911 to 1674.9 km2 in 1960 or 14.9 % (0.30 % yr−1). Overall this was 39.4 % (0.34 % yr−1) between 1911 and 2014. Thus, we consider that glacier area reduction increased between 1986 and 2014 in comparison with the 1960–1986 period and between 1960 and 2014 in comparison with the 1911–1960 period. Therefore, our results contrast with those of Lur'e and Panov (2014), where the northern Greater Caucasus glacier decrease was faster in 1895–1970 (0.52 % yr−1) than in 1971–2011 (0.32 % yr−1), and Khromova et al. (2009), where the Greater Caucasus glacier decrease was faster in 1911–1957 (0.52 % yr−1) than in 1957–2000 (0.41 % yr−1). Glacier distribution and change during the investigation period are characterized by obvious regional differences (Fig. 4). These may be related to the different topography, aspect and climatic settings of glaciers of different size, as well as climate change.
Our results also showed that eastern Greater Caucasus glaciers are shrinking faster than those in the western and central areas; the smaller size of glaciers there may be the reason for this phenomenon. The Elbrus glacier area rate of loss is lower than in the Greater Caucasus main watershed range due to the higher elevation and larger accumulation areas.
5.2 Glacier changes
One of the important steps in utilizing our glacier inventory data is to understand spatial patterns in glacier characteristics across the region. Our study area displays region-wide consistency in glacier characteristics – notably glacier area, elevation and topography – across the five subregions based on the ∼ 2000 glacier data (Table 3).
Comparisons between glacier size and surface area fluctuations suggest that smaller glaciers, though losing the least surface area, actually lost a greater proportion of their total area. Approximately 28.37 % (0.52 % yr−1) of the glacier area that disappeared was from glaciers 0.1–1.0 km2 in size between 1960 and 2014. Compared with similar-size glaciers in the surrounding regions, e.g. the Swiss Alps, rate of glacial shrinkage was twice as high (1.13 % yr−1 between 1973 and 2010) (Fischer et al., 2014). Similar trends, with small glaciers showing a propensity to shrink rapidly, have been found in numerous regions globally (Tennant et al., 2012; Stokes et al., 2013; Racoviteanu et al., 2015). This is considered a result of the greater volume-to-area and perimeter-to-area ratios of smaller glaciers – meaning they respond rapidly to a given ablation rate (Granshaw and Fountain, 2006; Tennant et al., 2012). Small glaciers are particularly sensitive to climate change. Their number will increase in the future (especially in the central Greater Caucasus) as the larger glaciers shrink and disaggregate.
Unlike the small glaciers, the largest glaciers (> 10 km2) are disappearing more rapidly in the Caucasus (0.82 % yr−1) than the Alps (0.60 % yr−1) (Fischer et al., 2014).
Glacier slope may also play a significant role in determining glacier area change (Table 3); i.e. the steeper the glacier, the larger the area loss observed in our study. The same tendency was observed in the Himalaya (Salerno et al., 2008; Racoviteanu et al., 2015).
We note that direct comparison of such numbers can be critical for various reasons, such as diverse sample size or size class distribution of the investigated glaciers, different subregional to local climate conditions, various length and onset of observation periods etc.
5.3 Comparison to GLIMS and the RGI
The GLIMS glacier database (9 February 2017 version) contained a number of deficiencies which have been remedied after this inventory; for example these river basins did not contain any glacier outlines: Belaya, Malaya Laba and Mzimba in the western Greater Caucasus; Khobistskali in the central Greater Caucasus; and Aragvi, Assa, Arghuni, Sharo Argun, Andiyskoye Koysu, Avarskoye Koysu, Samur, Agrichai and Kusarchai in the eastern Greater Caucasus. These constitute more than one-half of the territory for the whole Greater Caucasus where modern glaciers are present (Fig. 10a). The GLIMS outlines also involve inconsistent registration, which appears to be associated with the use of ASTER imagery (Fig. 10b) (Khromova, 2009).
The RGI 5.0 version database similarly contains errors, especially in the central Greater Caucasus section. For example in the Samegrelo, Lechkhumi and Shoda-Kedela subranges, where the RGI database contains 39 nominal glaciers (circles representing areas) with a total area of 40.2 km2, we found an additional 40 glaciers with a total area of 3.5 km2. In addition, almost the whole eastern Greater Caucasus section (except the Terek headwaters) and some parts of the western Greater Caucasus section (Belaya, Malaya Laba and Mzimba river basins) are represented by nominal glaciers (Fig. 10c).
Overall, glacier area difference was 165.1 km2 between the RGI (1276.9 km2) and GLIMS (1111.8 km2), 83.7 km2 between the RGI and the new Caucasus Glacier Inventory (CGI) (1193.2 ± 54.0 km2), and 81.4 km2 between the GLIMS and CGI (Fig. 11).
We present a glacier change analysis including multi-temporal data sets covering the entire Greater Caucasus for the first time. Manual digitization from 1960s large-scale (1:50 000) topographic maps and satellite imagery from 1964 (Corona), 1986 (Landsat 5) and 2014 (Landsat 8, ASTER) were used to map glacier surface area. We expect that this inventory will substantially improve existing knowledge for this region.
The main errors occur from data quality. Errors in the 1960s maps included mapped snow patches (especially for small cirque type glaciers) and uncertain glacier extents, which could be verified using available Corona 1964 satellite imagery (Fig. 2d–e). Other sources of error for aerial imagery include seasonal snow, shadows and debris cover, which can impede glacier mapping. Using GPS field data, debris cover error can be resolved for some glaciers; while incorrect identification of seasonal snow generally affects small glaciers more than larger complexes, these do not make up a large percentage of the total area.
The main study findings can be summarized as follows:
- a.
The Greater Caucasus region experienced glacier area loss at an average annual rate of 0.44 % yr−1 between 1960 and 1986 and 0.69 % yr−1 between 1986 and 2014. Overall, the glacier loss was 0.53 % yr−1 between 1960 and 2014.
- b.
Glacier number and area changes indicate that glaciers in the eastern Greater Caucasus have decreased (0.98 % yr−1) more than in the central (0.46 % yr−1) and western (0.52 % yr−1) sections, and southern glaciers have retreated (0.61 % yr−1) more than northern (0.50 % yr−1) glaciers between 1960 and 2014. Although this rate is exceeded in other world mountain ranges (Huss and Hock, 2015), if the decrease in the surface area of glaciers in the eastern Greater Caucasus continues over the 21st century, many will disappear by 2100.
- c.
Glaciers of the Elbrus and Kazbegi-Jimara massifs lost a smaller proportion of their area between 1960 and 2014 than glaciers located in the main watershed range: 0.27 and 0.39 % yr−1 respectively.
The inventory presented here will further enable focus on assessing changes in glaciers, debris cover, mass balance, total volume and hydrological modelling.
The data described in this article are available for public download at http://www.glims.org/download/.
The Greater Caucasus Glacier Inventory includes the number and area change in 1960–1986, 1986–2014 and 1960–2014 by individual river basins and countries (Tables 1–2); Elbrus and Kazbegi-Jimara massif glacier number and area change in 1960–1986, 1986–2014 and 1960–2014 (Tables 3–4; Figs. 1–2); cumulative glacier area and number values for seven size classes in 1960, 1986 and 2014 for the northern, southern, western, central and eastern Greater Caucasus (Table 5; Figs. 3–12); area change for the seven glacier size classes in the western, central and eastern sections and the entire Greater Caucasus in 1960–1986, 1986–2014 and 1960–2014 (Table 6); and characteristics of glaciers used for measuring length change (Table 7).
The supplement related to this article is available online at: https://doi.org/10.5194/tc-12-81-2018-supplement.
The authors declare that they have no conflict of interest.
We gratefully acknowledge the financial support from
the Shota Rustaveli Georgian National Science Foundation “State science
grants for outgoing research internship of young scientists 2016” project –
the Greater Caucasus Glacier Inventory (IG/3/1/16). We also gratefully acknowledge the financial support from the International
Educational Center of Georgia “Professional Development and Retraining Program 2017–2018”.
Special thanks to the editor, Chris R. Stokes, and two reviewers, Frank Paul and Maria Shahgedanova, for useful suggestions and
detailed comments which clearly enhanced the quality of the paper.
Edited by: Chris R. Stokes
Reviewed by: Maria Shahgedanova and Frank Paul
Andreassen, L. M., Paul, F., Kääb, A., and Hausberg, J. E.: Landsat-derived glacier inventory for Jotunheimen, Norway, and deduced glacier changes since the 1930s, The Cryosphere, 2, 131–145, https://doi.org/10.5194/tc-2-131-2008, 2008.
Bolch, T., Menounos, B., and Wheate, R.: Landsat-based inventory of glaciers in western Canada, 1985–2005, Remote Sens. Environ., 114, 127–137, https://doi.org/10.1016/j.rse.2009.08.015, 2010.
Catalog of Glaciers of the USSR: Katalog Lednitov USSR, vol. 8–9, Gidrometeoizdat, Leningrad, 1967–1978.
Cogley, J. G.: A more complete version of the World Glacier Inventory, Ann. Glaciol., 50, 32–38, 2009.
DeBeer, C. M. and Sharp, M. J.: Recent changes in glacier area and volume within the southern Canadian Cordillera, Ann. Glaciol., 46, 215–221, 2007.
Evans, S. G, Tutubalina, O. V., Drobyshev, V. N., Chernomorets, S. S., McDougall, S., Petrakov, D. A., and Hungr, O.: Catastrophic detachment and highvelocity long-runout flow of Kolka Glacier, Caucasus Mountains, Russia in 2002, Geomorphology, 105, 314–321, https://doi.org/10.1016/j.geomorph.2008.10.008, 2009.
Fischer, M., Huss, M., Barboux, C., and Hoelzle, M.: The new Swiss Glacier Inventory SGI2010: Relevance of using high resolution source data in areas dominated by very small glaciers, Arct. Antarct. Alp. Res., 46, 933–945, 2014.
Fischer, A., Seiser, B., Stocker Waldhuber, M., Mitterer, C., and Abermann, J.: Tracing glacier changes in Austria from the Little Ice Age to the present using a lidar-based high-resolution glacier inventory in Austria, The Cryosphere, 9, 753–766, https://doi.org/10.5194/tc-9-753-2015, 2015.
Frey, H., Paul, F., and Strozzi, T.: Compilation of a glacier inventory for the western Himalayas from satellite data: methods, challenges, and results, Remote Sens. Environ., 124, 832–843, 2012.
Gardner, A., Moholdt, J., Cogley, G., Wouters, B., Arendt, A., Wahr, J., Berthier, E., Hock, R., Pfeffer, W., Kaser, G., Ligtenberg, S., Bolch, T., Sharp, M., Hagen, J., Van den Broeke, M., and Paul, F.: A reconciled estimate of glacier contributions to sea level rise: 2003 to 2009, Science, 340, 852–857, 2013.
Georgian National Tourism Administration: https://gnta.ge/statistics/, 2017.
Gobejishvili, R. G.: Saqartvelos tanamedrove mkinvarebi da Evraziis mtebshi gamkinvarebis evolucia gvian Pleistocensa da Holocenshi (Present day glaciers of Georgia and evolution of glaciation in the mountains of Eurasia in late Pleistocene and Holocene), sadoqtoro disertacia, Tbilisi, 320 pp., 1995.
Gobejishvili, R. G., Tielidze, L. G., Lomidze, N., and Javakhishvili A.: Monitoring of Glaciers on the background of Climate change. Monograph, Publ. Universali, 176 pp., 2012 (in Georgian).
Granshaw, F. D. and Fountain, A. G.: Glacier change (1958–1998) in the North Cascades National Park Complex, Washington, USA, J. Glaciol., 52, 251–256, https://doi.org/10.3189/172756506781828782, 2006.
Haeberli, W., Huggel, C., Kääb, A., Zgraggen-Oswald, S., Polkvoj, A., Galushkin, I., Zotikov, I., and Osokin, N.: The Kolka-Karmadon rock/ice slide of 20 September 2002: an extraordinary event of historical dimensions in North Ossetia, Russian Caucasus, Journal of Glaciology, 50, 533–546, doi.org/10.3189/172756504781829710, 2004.
Holobâcă I. H.: Recent retreat of the Elbrus glacier system, J. Glaciol., 62, 94–102, https://doi.org/10.1017/jog.2016.15, 2016.
Huggel, C., Zgraggen-Oswald, S., Haeberli, W., Kääb, A., Polkvoj, A., Galushkin, I., and Evans, S. G.: The 2002 rock/ice avalanche at Kolka/Karmadon, Russian Caucasus: assessment of extraordinary avalanche formation and mobility, and application of QuickBird satellite imagery, Nat. Hazards Earth Syst. Sci., 5, 173–187, https://doi.org/10.5194/nhess-5-173-2005, 2005.
Huss, M.: Extrapolating glacier mass balance to the mountain-range scale: the European Alps 1900–2100, The Cryosphere, 6, 713–727, https://doi.org/10.5194/tc-6-713-2012, 2012.
Huss, M. and Hock, R.: A new model for global glacier change and sea-level rise, Front. Earth Sci., 3, 1–22, https://doi.org/10.3389/ferat.2015.00054, 2015.
Kargel, J. S., Leonard, G. J., Bishop, M. P., Kaab, A., and Raup, B. (Eds.): Global Land Ice Measurements from Space (Springer-Praxis), 33 chapters, 876 pp., https://doi.org/10.1007/978-3-540-79818-7, 2014.
Khromova, T., Nosenko, G., and Chernova L.: Mapping of glacier extent changes in the mountain regions using space images and glacier inventories, the 24th International Cartographic Conference, Santiago, Chile, 2009.
Khromova, T., Nosenko, G., Kutuzov, S., Muraviev, A., and Chernova, L.: Glacier area changes in Northern Eurasia, Environ. Res. Lett., 9, 015003, https://doi.org/10.1088/1748-9326/9/1/015003, 2014.
Kotlyakov, V. M., Khromova, T. E., Nosenko, G. A., Popova, V. V., Chernova, L. P., and Murav'ev A. Ya.: New Data on Current Changes in the Mountain Glaciers of Russia, Doklady Earth Sciences, Vol. 464, Part 2, 1094–1100, https://doi.org/10.1134/S1028334X15100207, 2015.
Lambrecht, A., Mayer, C., Hagg, W., Popovnin, V., Rezepkin, A., Lomidze, N., and Svanadze, D.: A comparison of glacier melt on debris-covered glaciers in the northern and southern Caucasus, The Cryosphere, 5, 525–538, https://doi.org/10.5194/tc-5-525-2011, 2011.
Lur'e, P. M. and Panov, V. D.: Variations of Contemporary Glaciation of the Northern Slope of the Greater Caucasus in the 20th Century and the Forecast of Its Degradation in the 21st Century, Russ. Meteorol. Hydro., 39, 254–259, https://doi.org/10.3103/S1068373914040062, 2014.
Maruashvili, L.: Kavkasiis fizikuri geografia (Physical Geography of the Caucasus), Monograph. Publ. “Metsniereba”, Tbilisi, 1981 (in Georgian).
Masurenkov, Yu. P. and Sobisevich, A. L.: Influence of thermal and fluid flows on the dynamics of Elbrus glaciers, Dokl. Earth Sci., 442, 144–147, https://doi.org/10.1134/S1028334X12010175, 2012.
Nagai, H., Fujita, K., Sakai, A., Nuimura, T., and Tadono, T.: Comparison of multiple glacier inventories with a new inventory derived from high-resolution ALOS imagery in the Bhutan Himalaya, The Cryosphere, 10, 65–85, https://doi.org/10.5194/tc-10-65-2016, 2016.
Paul, F. and Kaab, A.: Perspectives on the production of a glacier inventory from multispectral satellite data in Arctic Canada: Cumberland Peninsula, Baffin Island, Ann. Glaciol., 42, 59–66, 2005.
Paul, F. and Svoboda, F.: A new glacier inventory on southern Baffin Island, Canada, from ASTER data: II. Data analysis, glacier change and applications, Ann. Glaciol., 50, 22–31, https://doi.org/10.3189/172756410790595921, 2009.
Paul, F., Barrand, N. E., Baumann, S. Berthier, E. Bolch, T. Casey, K. Frey, H. Joshi, S. P., Konovalov, V., Le Bris, R., Molg, N., Nosenko, G., Nuth, C., Pope, A., Racoviteanu, A., Rastner, P., Raup, B., Scharrer, K., Steffen, S., and Winsvold, S.: On the accuracy of glacier outlines derived from remote-sensing data, Ann. Glaciol., 54, 171–182, https://doi.org/10.3189/2013AoG63A296, 2013.
Petrakov, D. A., Chernomorets, S. S., Evans, S. G., and Tutubalina, O. V.: Catastrophic glacial multi-phase mass movements: a special type of glacial hazard, Adv. Geosci., 14, 211–218, https://doi.org/10.5194/adgeo-14-211-2008, 2008.
Podozerskiy, K. I.: Ledniki Kavkazskogo Khrebta (Glaciers of the Caucasus Range): Zapiski Kavkazskogo otdela Russkogo Geograficheskogo Obshchestva, Publ. Zap. KORGO., Tifis, 29, 200 pp., 1911.
Pope, A., Rees, W., G., Fox, A., J., and Fleming, A.: Open access data in polar and cryospheric remote sensing, Remote Sensing, 6, 6183–6220, https://doi.org/10.3390/rs6076183, 2014.
Popovnin, V. V., Rezepkin, A. A., and Tielidze, L. G.: Superficial moraine expansion on the Djankuat Glacier snout over the direct glaciological monitoring period, Earth Cryosphere, vol. XIX, No. 1, 79–87, 2015.
Racoviteanu, A. E., Arnaud, Y., Williams, M. W., and Manley, W. F.: Spatial patterns in glacier characteristics and area changes from 1962 to 2006 in the Kanchenjunga–Sikkim area, eastern Himalaya, The Cryosphere, 9, 505–523, https://doi.org/10.5194/tc-9-505-2015, 2015.
Radić, V. and Hock, R.: Glaciers in the Earth's hydrological cycle: assessments of glacier mass and runoff changes on global and regional scales, Surv. Geophys., 35, 813–837, https://doi.org/10.1007/s10712-013-9262-y, 2014.
Reinhardt, A. L.: Snejnaya granica Kavkaze (The snow line in the Caucasus), Izvestia Kavkazskogo otdela Imperatorskogo Russkogo Geograficheskogo Obshchestva, 3, 275–307, 1916 (in Russian).
Reinhardt, A. L.: Lednikovii period kavkaza i ego otnoshenie k oledeneniu alp i altai (Ice Age of the Caucasus and its relation to the glaciation of the Alps and the Altai), tr. II. mejd. konf. po izuchenie chetvertichnogo perioda evropi. L-M, bip. 2, 1936 (in Russian).
Salerno, F., Buraschi, E., Bruccoleri, G., Tartari, G., and Smiraglia, C.: Glacier surface-area changes in Sagarmatha pational park, Nepal, in the second half of the 20th century, by comparison of historical maps, J. Glaciol., 54, 738–752, 2008.
Shahgedanova, M., Nosenko, G., Kutuzov, S., Rototaeva, O., and Khromova, T.: Deglaciation of the Caucasus Mountains, Russia/Georgia, in the 21st century observed with ASTER satellite imagery and aerial photography, The Cryosphere, 8, 2367–2379, https://doi.org/10.5194/tc-8-2367-2014, 2014.
Solomina, O., Bushueva, I., Dolgova, E., Jomelli, V., Alexandrin, M., Mikhalenko, V., and Matskovsky, V.: Glacier variations in the Northern Caucasus compared to climatic reconstructions over the past millennium, Glob. Planet. Change, 140, 28–58, https://doi.org/10.1016/j.gloplacha.2016.02.008, 2016.
Stokes, C. R., Gurney, S. D., Popovnin, V., and Shahgedanova M.: Late-20th-century changes in glacier extent in the Caucasus Mountains, Russia/Georgia, J. Glaciol., 52, 99–109, 2006.
Stokes, C. R., Popovnin, V. V., Aleynikov, A., and Shahgedanova, M.: Recent glacier retreat in the Caucasus Mountains, Russia, and associated changes in supraglacial debris cover and supra/proglacial lake development, Ann. Glaciol., 46, 196–203, 2007.
Stokes, C. R., Shahgedanova, M., Evans, I., and Popovnin, V. V.: Accelerated loss of alpine glaciers in the Kodar Mountains, south-eastern Siberia, Glob. Planet. Change, 101, 82–96, 2013.
Tennant, C., Menounos, B., Wheate, R., and Clague, J. J.: Area change of glaciers in the Canadian Rocky Mountains, 1919 to 2006, The Cryosphere, 6, 1541–1552, https://doi.org/10.5194/tc-6-1541-2012, 2012.
Tielidze, L.: Introduction, Chapter in Glaciers of Georgia, Springer, Geography of the Physical Environment, 1–4, https://doi.org/10.1007/978-3-319-50571-8_1, 2017.
Tielidze, L. G.: Glacier change over the last century, Caucasus Mountains, Georgia, observed from old topographical maps, Landsat and ASTER satellite imagery, The Cryosphere, 10, 713–725, https://doi.org/10.5194/tc-10-713-2016, 2016.
Tielidze, L. G., Wheate, R. D., Kutuzov, S. S., Doyle, K., and Lavrentiev, I. I.: Supraglacial debris cover assessment in the Caucasus Mountains, 1986–2000–2014, Earth Syst. Sci. Data Discuss., https://doi.org/10.5194/essd-2017-96, in review, 2017.
Wulder, M., A, Masek, J., G., Cohen, W., B., Loveland, T., R., and Woodcock, C., E.: Opening the archive: how free data has enabled the science and monitoring promise of Landsat, Remote Sens. Environ., 122, 2–10, https://doi.org/10.1016/j.rse.2012.01.010, 2012.
Wulder, M. A., White, J., C., Loveland, T., R., Woodcock, C., E., Belward, A., S., Cohen, W., B., Fosnight, E., A., Shaw, J., Masek, J., G., and Roy, D., P.: The global Landsat archive: status, consolidation, and direction, Remote Sens. Environ., 185, 271–283, https://doi.org/10.1016/j.rse.2015.11.032, 2016.
- Article
(8663 KB) - Full-text XML